Electronic Thesis and Dissertation Repository
4-15-2015 12:00 AM
Configuration, Programming, Implementation, and Evaluation of
Configuration, Programming, Implementation, and Evaluation of
Distributed Control System for a Process Simulator
Distributed Control System for a Process Simulator
Ximing LiuThe University of Western Ontario
Supervisor Jin Jiang
The University of Western Ontario
Graduate Program in Electrical and Computer Engineering
A thesis submitted in partial fulfillment of the requirements for the degree in Master of Engineering Science
© Ximing Liu 2015
Follow this and additional works at: https://ir.lib.uwo.ca/etd
Part of the Controls and Control Theory Commons
Recommended Citation Recommended Citation
Liu, Ximing, "Configuration, Programming, Implementation, and Evaluation of Distributed Control System for a Process Simulator" (2015). Electronic Thesis and Dissertation Repository. 2801.
https://ir.lib.uwo.ca/etd/2801
This Dissertation/Thesis is brought to you for free and open access by Scholarship@Western. It has been accepted for inclusion in Electronic Thesis and Dissertation Repository by an authorized administrator of
AND EVALUATION OF DISTRIBUTED CONTROL SYSTEM
FOR A PROCESS SIMULATOR
(Thesis format: Monograph)
by
Ximing Liu
Graduate Program in
Electrical and Computer Engineering
A thesis submitted in partial fulfilment of the requirements for the degree of
Master of Engineering Science
School of Graduate and Postdoctoral Studies The University of Western Ontario
London, Ontario, Canada
ii
Abstract
A common industrial distributed control system (DCS), DeltaV, is configured and programmed to control and monitor the Nuclear Process Control Test Facility (NPCTF). A cabinet which holds the hardware of the DelatV DCS system, including programmable logic controller (PLC), power supplies, input/output (I/O) cards, terminals, and relays are configured and wired to field devices of NPCTF. A workstation and HMI screen are configured and setup.
To implement the main functions of NPCTF in the DelatV system, the programming architecture is designed in the DelatV system. The main control and monitoring functions of NPCTF are programmed using industrial languages of Function Block Diagram (FBD) and Sequential Function Chart (SFC) by IEC61113-3. Safety interlocks are added in the program to protect the NPCTF devices from damage. A HMI is developed to operate and monitor the NPCTF. Through the HMI, the operator can monitor the parameters of process of NPCTF, operate the NPCTF, change parameters of the controller, and force the devices.
The process model of SG (Steam Generator) Tank level control is developed using the MATLAB System Identification tool. The model is taken as an example to demonstrate the process of analysis and design the controller of process control. PID is used as the controller algorithm.
The main control and monitoring functions of NPCTF in the DeltaV system are commissioned, tested and evaluated. The evaluation results conclude that the DelatV DCS system can control the NPCTF to achieve the main functions of the NPCTF.
iii
Acknowledgments
I would like to express my appreciation and thanks to my advisor Dr. Jin Jiang, whose expertise, understanding and patience added considerably to my graduate experience. I appreciate his thorough guidance through my research and graduate life. I must thank the members of the examining board for taking time from their busy schedules to provide valuable feedback.
I would also like to thank Dr. Xinhong Huang for her encouragement, patience and assistance in writing this thesis and Dr. Ataul Bari for his support in this research, and for ordering the devices for it.
I am also thankful to all the members of the Control Instrumentation and Electrical Systems research group of the University of Western Ontario, in particular Drew Rankin and Jianping Ma, for their support in various aspects of my research work. Our debates, and exchanges of knowledge and skills throughout my graduate program have enriched my graduate experience.
I give special thanks to my wife. Words cannot express how grateful I am to her for all her sacrifices. Without her support, encouragement, and love I would not have returned to academia and completed this thesis.
iv
Table of Contents
Abstract………..……….……….….…..ii
Acknowledgements...iii
Table of Contents………...…....……....iv
List of Tables………...viii
List of Figures………...ix
Abbreviations and Nomenclature………..……….……….……xv
1 Introduction ... 1
1.1 Background ... 1
1.1.1 CANDU Nuclear Power Plant (NPP) ... 1
1.1.2 Distributed Control System (DCS) ... 3
1.1.3 Programmable logic controller (PLC) ... 6
1.2 Motivations ... 8
1.3 Objectives and Scope ... 9
1.4 Contributions ... 9
1.5 Organization of the Thesis ... 10
2 Control System Requirements for Nuclear Process Control Test Faciliy ... 12
2.1 System Introduction ... 12
2.2 Process Control... 15
2.3 Sequence Control ... 16
2.4 Safety Systems ... 17
2.4.1 Shutdown System Number 1 (SDS1) ... 18
v
2.4.3 Emergency Core Cooling (ECC) ... 20
2.5 Operation Modes ... 21
2.5.1 Normal mode of operation ... 22
2.5.2 Solid mode of operation ... 24
2.5.3 Open mode of operation ... 26
2.6 Summary……….…………27
3 Control System Design for NPCTF using DeltaV DCS ... 28
3.1 Introduction to DeltaV DCS system ... 28
3.2 System Configuration and Connection... 29
3.2.1 DeltaV cabinet configuration ... 29
3.2.2 I/O card wiring diagrams ... 31
3.2.3 Connection to field devices... 35
3.3 Programming Architecture Design ... 39
3.4 DCS Programming Languages (IEC 61131-3) ... 42
3.4.1 Function block diagram (FBD) ... 43
3.4.2 Sequential Function Chart (SFC) ... 45
3.5 Programming Algorithms for Modules ... 46
3.6 Human Machine Interface (HMI) Configuration: Graphics and Faceplates ... 47
3.7 Summary………..51
4 Process Controller Design in DeltaV DCS ... 52
4.1 Development of Control Strategies ... 52
4.1.1 Proportional-integral-derivative (PID) algorithm ... 53
vi
4.2 Controller Analysis and Design for Steam Generator Level Control ... 57
4.2.1 Process model ... 57
4.2.2 Stable analysis... 61
4.2.3 Controller parameters tuning using simpe-IMC method ... 62
4.2.4 Comparison of tuning results in MATLAB and on NPCTF ... 65
4.3 Empirical Tuning Methods for Process Loops ... 67
4.4 Summary………..70
5 Evaluation and Testing of the DCS operated NPCTF ... 71
5.1 Process Control... 71
5.1.1 Evaluation methods... 71
5.1.2 Primary water flow control ... 73
5.1.3 Water heater control... 75
5.1.4 HX Tank pressure control ... 77
5.1.5 Pressurizer pressure control ... 80
5.1.6 Pressurizer water level control ... 83
5.1.7 Upper Tank level control ... 85
5.1.8 Water inventory pressure control ... 87
5.2 Sequence Control ... 89
5.3 Safety Systems Evaluation ... 91
5.3.1 Shut-down System Number 1 (SDS1) ... 91
5.3.2 Shut-down System Number 2 (SDS2) ... 94
5.3.3 Emergency Core Cooling (ECC) ... 96
vii
5.4.1 Normal mode evaluation ... 99
5.4.2 Solid mode evaluation ... 100
5.4.3 Open mode evaluation ... 101
5.5 Summary………102
6 Conclusions ... 103
6.1 Summary of Contributions ... 104
6.2 Suggestions for Future Work ... 105
References ... 107
Appendices ... 111
A List of I/O (input/output) signals ... 111
B Process control loops I/O ... 118
C Safety Systems Logic Diagrams ... 120
D Programs of NPCTF in DeltaV DCS system ... 121
viii
List of Tables
ix
List of Figures
1.1 Simplified block diagram of main process and control systems of a CANDU NPP... 2
1.2 Heat transport system inventory control……….…………. 3
1.3 Typical DCS system structure ……….6
1.4 PLC architecture……….. 8
2.1 Physical system of NPCTF ... 13
2.2 P&ID Diagram for NPCTF ... 14
2.3 P&ID Diagram for NPCTF process variables ... 16
2.4 Logical diagram for start-up procedure ... 17
2.5 Logic function diagram of relays ... 19
2.6 2oo3 logic function diagram of SDS1 ... 19
2.7 Logic function diagram of SDS2 ... 20
2.8 Logic function diagram of ECC ... 20
2.9 P&I diagram of NPCTF to show ECC ... 21
2.10 P&ID diagram of partial NPCTF in Normal mode ... 23
2.11 Logic function diagram of Normal mode ... 24
2.12 P&ID diagram of partial NPCTF in Solid mode ... 25
x
2.14 P&ID diagram of partial NPCTF in Open mode ... 27
3.1 DeltaV system overview diagram ... 28
3.2 Device schematic diagram in DeltaV cabinet ... 31
3.3 AI card wiring ... 32
3.4 AO card wiring ... 33
3.5 DI card wiring diagram ... 33
3.6 DO card wiring diagram ... 34
3.7 DO signal intermediate circuit ... 35
3.8 Schematic diagram of wiring system ... 36
3.9 DeltaV server and screen ... 37
3.10 DeltaV cabinet ... 37
3.11 Wiring of DCS cabinet... 38
3.12 Field devices of NPCTF... 38
3.13 Programming architecture schematic diagram of typical DeltaV system ... 39
3.14 Programming architecture schematic diagram of NPCTF ... 40
3.15 Programming architecture diagram of NPCTF ... 41
3.16 Individual function block ... 43
xi
3.18 SFC network ... 45
3.19 Programming architecture of NPCTF ... 47
3.20 HMI of NPCTF ... 49
3.21 Typical faceplate ... 50
3.22 Current trend of controller parameters ... 50
3.23 Controller tuning parameters ... 51
4.1 Process control diagram ... 52
4.2 Diagram of water inventory control process ... 56
4.3 Diagram for system identification procedure ... 59
4.4 Diagram of SG HX Tank level control ... 60
4.5 Input and output curve from experiment data ... 61
4.6 Block diagram of closed-loop ... 62
4.7 Gain and phase margins on a Bode plot... 65
4.8 Function block diagram of close loop control ... 66
4.9 SG Tank level responses from Simulink ... 66
4.10 SG Tank level responses from NPCTF experiment ... 67
4.11 Effect of changing Kc ... 68
xii
5.1 Performance specifications in time domain ... 72
5.2 Primary water flow performance ... 73
5.3 Performance characteristics of step response of decrease primary water flow ... 74
5.4 Performance characteristics of step response of increase primary water flow ... 74
5.5 Heater outlet temperature performances ... 75
5.6 Performance characteristics of step response of decrease heater outlet temperature 76 5.7 Performance characteristics of step response of heater outlet temperature ... 77
5.8 HX Tank pressure performances ... 78
5.9 Performance characteristics of step response of HX tank pressure (0psig-2psig) ... 79
5.10 Performance characteristics of step response of HX tank pressure (2psig-3psig) ... 79
5.11 Performance characteristics of step response of HX tank pressure (3psig-4psig) ... 80
5.12 Pressurizer pressure control performances ... 81
5.13 Performance characteristics of step response of pressurizer pressure (2psig-3psig) . 81 5.14 Performance characteristics of step response of pressurizer pressure (3psig-4psig) . 82 5.15 Performance characteristics of step response of pressurizer pressure (4psig-5psig) . 82 5.16 Pressurizer water level control performances ... 83
5.17 Performance characteristics of step response of pressurizer level (42%-45%) ... 84
xiii
5.19 Upper Tank level control performances ... 85
5.20 Upper Tank level step response from 30% to 35% ... 86
5.21 Upper Tank level step response from 35% to 40% ... 86
5.22 Upper Tank level step response from 40% to 45% ... 87
5.23 Primary water pressure P1 step response ... 88
5.24 Primary water pressure P1 step response from 3 psig to 5 psig... 89
5.25 Tanks level change during start-up ... 90
5.26 NPCTF system diagram during start-up ... 91
5.27 T2 average curves for SDS1 ... 92
5.28 NPCTF system diagram for SDS1 ... 93
5.29 Alarm of SDS1 ... 93
5.30 Primary water pressure P1 curve for SDS2 ... 94
5.31 NPCTF system diagram for SDS2 ... 95
5.32 Alarm of SDS2 ... 95
5.33 Primary water pressure P1 for ECC ... 97
5.34 NPCTF system diagram for ECC ... 98
5.35 Alarm of ECC and SDS2 ... 98
xiv
xv
Abbreviations and Nomenclature
Abbreviations
2oo3 Two-out-of-three voting A/D Analog to Digital
AECL Atomic Energy of Canada Limited AI Analog Input
AO Analog Output
CANDU Canadian Deuterium Uranium CB Circuit Breaker
CPU Central Processing Unit CV Control Valve
D/A Digital to Analog
DCS Distributed Control System DDC Direct-digital Control DI Digital Input
DO Digital Output
D2O Deuterium Oxide, Heavy Water
xvi FBD Function Block Diagram
FOPDT First-order-plus-dead-time FPE Final Prediction Error HMI Human Machine Interface I&C Instrumentation and Control ICI Imperial Chemical Industries IL Instruction List
IMC Internal Model Control I/O Input / Output
LD Ladder Diagram
LOCA Loss-of-coolant Accident mA milli-ampere
MSE Mean Square Error MWe Megawatt Electrical NC Normal Close NO Normal Open
xvii OLE Object Linking and Embedding OPC OLE for Process Control PEM Prediction Error Method
PID Proportional-integral-derivative PLC Programmable Logic Controller P&ID Piping and Instrumentation Diagram PV Process variable
SDS1 Shutdown System Number 1 SDS2 Shutdown System Number 2 SFC Sequential Function Chart SG Steam Generator
SIMC Simple Internal Model Control SOPDT Second-order-plus-dead-time SP Set-point
xviii
Nomenclature
controller gain integral time scan interval derivative time process gain time constant
θ process delay critical frequency gain cross frequency
c
K
I
s
T
D
p
K
p
c
Chapter 1
Introduction
1.1 Background
1.1.1 CANDU Nuclear Power Plant (NPP)
The CANDU (Canadian Deuterium Uranium) is a Canadian invented, pressurized heavy water reactor. It is characterized by heavy water as coolant and moderator, and use natural uranium as fuel [1]. CANDU NPPs (nuclear power plants) are developed and maintained by AECL (Atomic Energy of Canada Limited) [2] [3].There are 22 units of CANDU reactors with a capacity of 15,358 MWe. It provides approximately 15% of Canada’s total electricity needs (over 50% in Ontario, Canada) [4]. CANDU reactors have been installed in seven countries [5].
The main energy exchange process in the CANDU nuclear power plant (NPP) is illustrated in Figure 1.1. The heavy water (D2O) of the heat transport system is pumped to
the reactor to be heated and becomes heated heavy water. The heatedheavy water is then transported to steam a generator. Inside the steam generator, the heated heavy water heats the feed-water to saturated steam and becomes cooled heavy water. The cooled heavy water feeds back to the reactor. The saturated steam is fed to drive the turbine and generator to produce power. Thereafter, steam becomes water and is pumped back to the steam generator.
steam generator. The turbine control system controls the flow or pressure of the main steam via turbine governors.
The heat transport system has two operation modes: Normal mode and Solid mode. Under Normal operating mode, the pressurizer keeps the pressure of the heat transport system while the feed and bleed system controls the inventory through pressurizer level, as shown in Figure 1.2. Under the Solid operating mode, the pressurizer is isolated. Instead, the feed and bleed system controls both pressure and inventory, as shown in Figure 1.2. Reactor Reactor Regulator System Steam Generator Pressure and Level Control Feedwater Generator Turbine Steam Generator Heat Transport Moderator Heat Transport Pressure and Inventory Control Turbine Controller Containment Condenser
[6]
The reactor safety system performs the functions necessary to maintain the plant in safe conditions. SDS1 (Shutdown System Number 1), SDS2 (Shutdown System Number 2), and ECC (Emergency Core Cooling) are three main reactor safety systems. SDS1 and SDS2 are two shutdown systems that shut down the reactor for safety reasons. SDS1 consists of mechanical shutdown rods while SDS2 injects a gadolinium nitrate solution into the moderator. These two shutdown systems are independent, and either of them can shut down the reactor and maintain the shut down for all design basis events. Emergency Core Cooling system supplies coolant to the reactor in the event of a loss-of-coolant accident (LOCA).
1.1.2 Distributed Control System (DCS)
To study the dynamic properties of CANDU NPP, a physical component known as Nuclear Power Control Test Facility (NPCTF) has been constructed in the CIES lab of the University of Western Ontario. In this research, a DCS system is developed to implement its functions.
Heat transport system Feed valve Bleed valve Pressurizer level Heat transport system
inventory control Solid mode Heat transport system
inventory control Normal mode
Pressure
A Distributed control system is a computer based control system of an industry process where its elements are distributed through different places [7] [49].
In the 1950’s, plants used large, local pneumatic controllers; the computers could only be used for supervisory tasks. Many companies started the research to determine if computers could be used for process control.
In the 1960s, the development of electronic integrated circuits led to the development of micro-computers [8]. In 1962, an Argus computer developed by Ferranti Ltd. replaced a complete analog control system in an ammonia/soda plant by a British chemistry company, Imperial Chemical Industries (ICI). It is a direct-digital control (DDC) computer and is expensive; however, it is still cheaper than the relay based control system [9].
The development of computer technology, which is faster, cheaper and more reliable, incubated the first distributed control system, TDC2000, and was introduced by Honeywell in 1975 [10] [11]. However, this DCS was not suitable for discrete and batch applications until the incorporating of PLC with DCS [12].
The further advances in computer hardware and software technology in 1980s caused the DCSs to expand its function beyond process control. It facilitated the production, such as process modeling, process accounting, expert system, and production planning and dispatch. Another feature of DCS during this period was that DCSs were shifted from proprietary systems to open systems to accommodate third party software. UNIX, one of the operating systems, was a popular choice for operating system of DCS [13].
tools Visual Basic and Visual C++ coupled with Active tools made complex and highly specialized applications affordable for users.
Right now, DCS has been applied extensively in process control of different industries: chemical plants, petrochemical industries and refines, power plant systems, nuclear power plants, environmental control systems, water management systems, oil refining plants, metallurgical process plants, and pharmaceutical manufacturing [11].
A nuclear power plant is a complex system. The distribute control system can perform complex tasks and, thus, has been applied to process control in NPP [16] [17].
[18]
1.1.3 Programmable logic controller (PLC)
In the DCS system designed in this research, PLCs (programmable logic controllers) are used as the control equipment.
Originally, the process was often controlled by relays where the control room was full of relays, terminals blocks and wire. For the relay-based control system, significant changes are required to expand the system and add more functions. Moreover, it is difficult to conduct troubleshooting considering there are huge number of relays and wiring. In the 1960’s, engineers at GM proposed to develop a prototype to eliminate costly scrapping of assembly-line relays during changeovers, and replace unreliable relays. In 1971, Allen Bradly developed a new concept, Bulletin 1774 PLC, and named it “Programmable Logic Controller” (PLC). From then on, the PLC terminology became the industrial standard. Several improvements have been made for PLC since it was first developed [19].
In the early 1980s, the industrial processes became more complex and a single PLC could not control the entire system. Therefore, PLC began to incorporate distributed control functions so they could be linked much in the way that DCSs were linked [20] [21].
Supervisory Level
Process Control Level
Field Level
DCS
Process
During the 1990s, standardization and an open system enabled further improvement in PLC development.
In the market, there are different sizes of configurations: Micro PLC with less than 100 I/O, Small PLC with 100 to 200 I/O, Medium with less than 1000 I/O and large PLC with more than 1000 I/O.
PLC has been extensively applied in different industry areas. According to a recent Control Engineering magazine poll, “The major applications for PLCs include machine control (87%), process control (58%), motion control (40%), batch control (26%), diagnostic (18%), and others (3%).” The results do not add up to 100% because a single control system generally has multiple applications [19].
1.2 Motivations
DCS is applied in many industries [22], including different types of power stations. Nuclear power plants are large, complex systems with potential risks [23]. An accident could cause serious loss and impact on society. Therefore, any new control strategy or function needs to be proved before applying it to a real nuclear power plant. In the past, software which simulates the process of an NPP is the common method to test and prove a new control strategy and function. However, process in the software is created by a model which is always different from real plants. A system between software and a real NPP will improve the validation process. Therefore, the NPCTF (Nuclear Process Control Test Facility) is built in the CIES research lab at the University of Western Ontario to simulate the main processes in a CANDU NPP and some other industrial processes for I&C research. Even though it is not a real NPP, it is a real physical system. In addition, this DCS operated NPP simulator can be used to train operators and students. For students, it helps to create some concepts about CANDU NPP. For operators, it helps to improve operating skills and emergency handling capabilities.
This research project is to design the DCS to control and operate the NPCTF. The popular industrial DCS, Delta-V manufactured by Emerson, is used to design this system [24].
CPU Power
supply Memory
I/O system modules
Output Devices Input
Devices
1.3 Objectives and Scope
As described in Section 1.2, it is important to develop a DCS system to implement the functions of NPCTF. The following are the main objectives of this research:
1. Design and implementation of a DCS system using a DeltaV platform to control the NPCTF.
2. Development of programs to implement the main functions of the NPCTF system 3. The process model of steam generator (SG) level control is developed and analyzed to present the process control strategies design process.
4. Development of the operator interface to operate the NPCTF system.
5. Evaluation of the main functions of a DCS system to demonstrate the functionalities of DeltaV DCS system to control NPCTF.
The goal of this work is to develop the DeltaV DCS system to control the NPCTF system, and demonstrate the functionalities of NPCTF. Therefore, the following issues are out of the scope of this research:
1. The specifications and the system design of NPCTF
1.4 Contributions
The following are the major contributions:
1. Control system development: A DCS system is developed to implement the process control, sequence control, designed functions of safety systems and operation mode selection on the NPCTF.
3. Model development: A Steam Generator (SG) level process model within operating range of 36% to 44% is constructed using MATLAB and used to design the controller of SG level control.
4. Tuning technique: The tuning technique is compared in MATLAB and on NPCTF system.
5. Commissioning of the DCS: The control system of the NPCTF described in Chapter 2 are commissioned.
6. Evaluation of the DCS system: The control system described in chapter 2 are tested and evaluated.
1.5 Organization of the Thesis
This thesis is organized as follows.
Chapter 2 introduces and describes the main functions to be implemented and achieved in the NPCTF simulator through the DCS system. The functions are expressed in logic diagrams.
Chapter 3 describes the DeltaV DCS platform used in this thesis, and how the DeltaV DCS platform is used to program and implement the functions described in Chapter 2. The hardware design and construction of the DCS system using the DeltaV platform are discussed. The control architecture design of NPCTF is also presented. In addition, the main programming languages used in this research are introduced. Furthermore, how to use these two kinds of languages to program and implement the functions described in Chapter 2 is also presented. In the end of Chapter 3, the details of developing HMI for monitoring and operating the NPCTF are also discussed.
presented. Steam Generator (SG) level control is taken as an example to explain the control process. In this example, the process model of Steam Generator level control is created and two tuning techniques are compared in both MATLAB and NPCTF system. Chapter 5 presents the results of the experiments and evaluations performed to demonstrate the main functions of the DCS system for the NPCTF.
Chapter 2
Control System Requirements for Nuclear Process Control
Test Facility (NPCTF)
The simulator NPCTF (Nuclear Process Control Test Facility) has been built in the CIES research lab at the University of Western Ontario. There are mainly four functions of this simulator to be implemented in this research: process control, sequence control, designed functions of safety systems, and operation modes. Process control is to control the process variables of NPCTF. The main purpose of Sequence control is to fill in the pipes and tanks in order for the system to be ready for operation. Safety system is used to investigate the safety shut down functions: SDS1, SDS2, and ECC. Operation mode is to make the NPCTF system run under different situations: Normal mode, Open mode and Solid mode. These functions are programed and evaluated in this research.
2.1 System Introduction
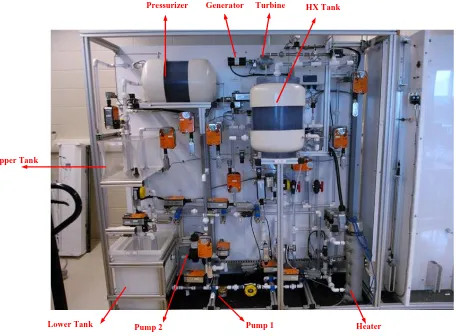
Figure 2.1 Physical system of NPCTF
Pressurizer HX Tank
Upper Tank
Lower Tank Pump 2 Pump 1 Heater
Pump1 Heater SV-2 F1 (Magnetic) Alarm/Display Relief valve CV-1 CV-2 40psi air supply CV-19 CV-20 SV-1 Legend: Sensors:
C:Current; T:Temperature; L:Level; P:Pressure; V:Vibration; F:Flow; Po: Position; A: Acoustic
Valves: CV: Control; FV: Fault injection; SV: Reverse flow Stop;
Flow Lines: Main water Air Hidden water Natural flow Support water SDS current FV-1 FV-3 LOCA water
Max outlet temp:
65 Celsius Copyright:
CIES laboratory
The University of Western Ontario London, Ontario, Canada
Coiled pipe Bearing fault injection Display Instrument signals
Spill water collection tray
Upper tank DAQ Po1 C1 V1 P02 T4 T1 T2-1/2/3 P1 C2 FV-2 FV-5 FV-6 CV-25 T5 T3 CV-5 L4 P2 Diffuser at tank bottom Regulator CV-21
To lower tank or spill collection Chiller HX F3 T6 T7 CV-18 CV-11 CV-9 CV-10 CV-12 Pressurizer P4 L3 Regulator
To lower tank or spill collection Sp il l pr ev en ti on F4 CV-17 CV-15 L1 Muffler F2(VA) CV-4 Turbine-Generator P3 rpm G CV-8 SDS1 Switch Controller B B A C C A 2-out-of-3 relays C3 CV-14 CV-16 Pump2 C5 V2 CV-3 CV-13 Lower Tank HX behind tank CV-34 Linear motor assembly SDS2 Switch Gravity drop rod Pneumatic gripper air Lower Tank Heater
Pump 2 Pump 1
Pressurizer HX Tank
Upper Tank
Turbine Generator
2.2 Process Control
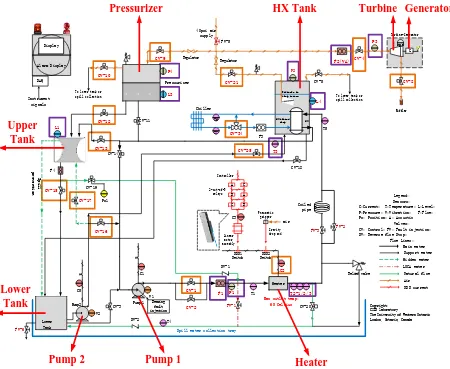
Figure 2.3 P&ID Diagram for NPCTF process variables
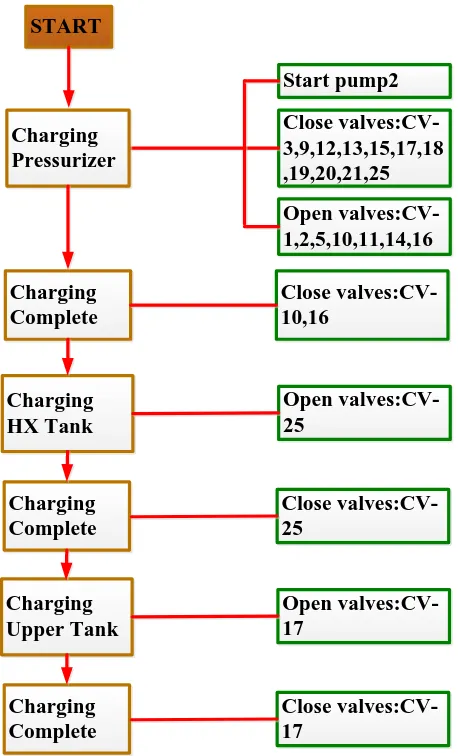
2.3 Sequence Control
Before the system starts, the tanks and pipes are required to be filled up and ready for operation. The Start-up procedure is designed for this objective. When the START button on the HMI is pressed, the pump begins to charge the Pressurizer, HX Tanks, and Upper Tank in sequence. When the levels of tanks reach certain values, such as 30% to 60%, the tanks are considered to be finished charging. In order to charge the related tanks, their corresponding valves are open, and then close after finishing the charge, as shown in Figure 2.4. For example, when charging the Pressurizer in the first step, valves CV-16, CV-1, CV-2, CV-11, CV-14, and CV-16 are open to fill in the pipes and Pressurizer tank.
Pump1 Heater SV-2 F1 Alarm/Display Relief valve CV-1 CV-2 40psi air supply CV-19 CV-20 SV-1 Legend: Sensors: C:Current; T:Temperature; L:Level; P:Pressure; V:Vibration; F:Flow; Po: Position; A: Acoustic
Valves: CV: Control; FV: Fault injection; SV: Reverse flow Stop;
Flow Lines: Main water Air Hidden water Natural flow Support water SDS current FV-1 FV-3 LOCA water
Max outlet temp:
65 Celsius Copyright:
CIES laboratory The University of Western Ontario London, Ontario, Canada Coiled pipe Bearing fault injection Display Instrument signals
Spill water collection tray
Upper tank DAQ Po1 C1 V1 T4 T1 T2-1/2/3 P1 C2 FV-2 FV-5 FV-6 CV-25 T5 T3 CV-5 L4 P2 Diffuser at tank bottom Regulator CV-21
To lower tank or spill collection Chiller HX F3 T6 T7 CV-18 CV-11 CV-9 CV-10 CV-12 Pressurizer P4 L3 Regulator
To lower tank or spill collection S p i l l p r e v e n t i o n F4 CV-17 CV-15 L1 Muffler F2(VA) CV-4 Turbine-Generator P3 rpm G CV-8 SDS1 Switch Controller B B A C C A 2-out-of-3 relays C3 CV-14 CV-16 Pump2 C5 V2 CV-3 CV-13 Lower Tank HX behind tank CV-34 Linear motor assembly SDS2 Switch Gravity drop rod Pneumatic gripper air Lower Tank Heater Pump 2 Pump 1
Pressurizer HX Tank
Upper Tank
Meanwhile, valves CV-3, CV-9, CV-12, CV-13, CV-15, CV-17, CV-18, CV-19, CV-20, CV-21, and CV-25 are closed. Refer to system P&I, diagram Figure 2.2 for the detail of these valves.
Figure 2.4 Logical diagram for start-up procedure
2.4 Safety Systems
There are three main safety systems for this NPCTF: SDS1 (Shutdown System Number 1), SDS2 (Shutdown System Number 2), and ECC (Emergency Core Cooling). SDS1 and SDS2 are designed to prevent the potential damage of the NPCTF when key operating parameters are out of the prescribed limit (see Appendix C for detail). If the
cooling of the Heater is judged to be insufficient, the ECC system will act to cool the Heater. In CANDU NPP, the safety systems are not designed in DCS system. However, the safety systems take action to shut down reactor when the trip parameters are out of limits, such as low pressurizer level. The trip parameters are measured with 2oo3 voting. The simulator is used to simulate this protected process, for the system to take action in response to the trip parameters and 2oo3 voting.
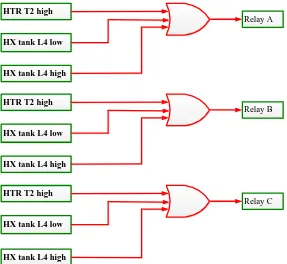
2.4.1 Shutdown System Number 1 (SDS1)
Figure 2.5 Logic function diagram of relays
2.4.2 Shutdown System Number 2 (SDS2)
SDS2 (Shutdown System Number 2) is an independent safety system. Three parameters are selected to simulate the potential risk of the Heater. If any of these parameters is
Relay B
HTR T2 high
HX tank L4 low
HX tank L4 high
Relay A
HTR T2 high
HX tank L4 low
HX tank L4 high
Relay C
HTR T2 high
HX tank L4 low
HX tank L4 high
Relay B
Relay C Relay A
SDS1
Shut off HTR
higher than the threshold, SDS2 will act and shut down the Heater. The logic is shown in Figure 2.7.
Figure 2.7 Logic function diagram of SDS2
2.4.3 Emergency Core Cooling (ECC)
The objective of an ECC system is to identify the potential risk of insufficient cooling of the Heater and then act to stop this situation, i.e. stopping the heat source (Heater) and feeding water from the Upper Tank to cool the Heater. As show in Figure 2.8, two conditions are simulated as Heater insufficient cooling conditions. Either SDS1 or SDS2 is active and Pump 1 is shut down. When this insufficient cooling condition is met, the ECC is created to shut off the heater and build the cooling circle of the Heater. As indicated in Figure 2.9 as seen using a highlighted green line, cooling water from the Upper Tank is fed to the Heater through the CV-19 and sent back to the Lower Tank. Pump 2 then feeds the water to the Upper Tank again. During this circling process, related valves are closed and opened to achieve the above functions, as shown in Figure 2.8.
Figure 2.8 Logic function diagram of ECC
SDS2 HTR T2 high
HX tank L4 high
WTR P1 high
Shut off HTR
Pump1 off SDS1
SDS2
ECCS
1. Close CV-1 and CV-2
Shut off HTR
Figure 2.9 P&I diagram of NPCTF to show ECC
2.5 Operation Modes
The Pressurizer is used to maintain the pressure of the heat transport system. This operation mode is called Normal mode. However, under warm-up and cool-down conditions, the Pressurizer is isolated. In this situation, the feed and bleed system is used to maintain pressure and inventory of the heat transport system. This operation mode is named Solid mode. In NPCTF, two operation modes are also designed to simulate both
Pump1 Heater SV-2 F1 Alarm/Display Relief valve CV-1 CV-2 CV-19 CV-20 SV-1 FV-1 FV-3
Max outlet temp: 65 Celsius Coiled pipe Bearing fault injection Display Instrument signals
Spill water collection tray
Upper tank DAQ Po1 C1 V1 T4 T1 T2-1/2/3 P1 C2 FV-2 FV-6 CV-25 T5 T3 L4 P2 Diffuser at tank bottom Chiller HX F3 T6 T7 CV-18 CV-11 CV-12 P4 L3 Sp il l pr ev en ti on F4 CV-17 CV-15 L1 SDS1 Switch Controller B B A C C A 2-out-of-3 relays C3 CV-14 CV-16 Pump2 C5 V2 CV-3 CV-13 Lower Tank HX behind tank CV-34 Linear motor assembly SDS2 Switch Gravity drop rod Pneumatic gripper air Lower Tank Heater
Pump 2 Pump 1
Pressurizer
HX Tank
Normal mode and Solid mode. Moreover, an operation mode called Open mode is also designed in NPCTF for general I&C related research purposes such as advanced control theories, fault diagnostics, fault tolerance.
2.5.1 Normal mode of operation
Figure 2.10 P&ID diagram of partial NPCTF in Normal mode Pump1 Heater SV-2 F1 Alarm/Display Relief valve CV-1 CV-2 CV-19 CV-20 SV-1 FV-1 FV-3
Max outlet temp: 65 Celsius Coiled pipe Bearing fault injection Display Instrument signals
Spill water collection tray
Upper tank DAQ Po1 C1 V1 T4 T1 T2-1/2/3 P1 C2 FV-2 FV-6 CV-25 T5 T3 L4 P2 Diffuser at tank bottom Chiller HX F3 T6 T7 CV-18 CV-11 CV-12 Pressurizer P4 L3 To lower tank or
spill collection S p i l l p r e v e n t i o n F4 CV-17 CV-15 L1 SDS1 Switch Controller B B A C C A 2-out-of-3 relays C3 CV-14 CV-16 Pump2 C5 V2 CV-3 CV-13 Lower Tank HX behind tank CV-34 Linear motor assembly SDS2 Switch Gravity drop rod Pneumatic gripper air Lower Tank Heater
Pump 2 Pump 1
Pressurizer
HX Tank
Figure 2.11 Logic function diagram of Normal mode
2.5.2 Solid mode of operation
Under Solid mode, the Pressurizer is isolated from water cycling. Primary water circling is shown in Figure 2.12 with a highlighted brown line: water is fed by Pump 1 to Heater, cooled by Chiller and come back to inlet of Pump1. As shown in Figure 2.12, the primary water pressure (P1) is controlled by CV-13 and CV-16 and is shown using a purple line. As shown in Figure 2.13, related valves and controllers are operated in order to achieve the above functions under Solid mode.
1.Close CV-3, 13 2.Open CV-11, 14
Close Water Loop with
Pressurizer(Normal)
Water Inventory and Pressure(L3,P1)
Pressurizer Pressure (P4)
P4 controlled by CV-9, CV-10
Valves
Controllers
Figure 2.12 P&ID diagram of partial NPCTF in Solid mode Pump1 Heater SV-2 F1 Alarm/Display Relief valve CV-1 CV-2 CV-19 CV-20 SV-1 FV-1 FV-3
Max outlet temp: 65 Celsius Coiled pipe Bearing fault injection Display Instrument signals
Spill water collection tray
Upper tank DAQ Po1 C1 V1 T4 T1 T2-1/2/3 P1 C2 FV-2 FV-6 CV-25 T5 T3 L4 P2 Diffuser at tank bottom Chiller HX F3 T6 T7 CV-18 CV-11 CV-12 Pressurizer P4 L3
To lower tank or spill collection S p i l l p r e v e n t i o n F4 CV-17 CV-15 L1 SDS1 Switch Controller B B A C C A 2-out-of-3 relays C3 CV-14 CV-16 Pump2 C5 V2 CV-3 CV-13 Lower Tank HX behind tank CV-34 Linear motor assembly SDS2 Switch Gravity drop rod Pneumatic gripper air Lower Tank Heater
Pump 2 Pump 1
Pressurizer
HX Tank
Figure 2.13 Logic function diagram of Solid mode
2.5.3 Open mode of operation
The NPCTF in the CIES lab at the University of Western Ontario is designed, not only for research of CANDU NPP, but for other general I&C related research as well. For example, if the research is only to investigate the nonlinear and adaptive control algorithm, and not related to CANDU, only a non-linear shaped Upper Tank and coiled pipe are used for this research. Therefore, NPCTF can be operated under the Open mode. Under Open mode, the Pressurizer is isolated from water cycling. Primary water circling is shown in Figure 2.14 using a highlighted brown line: water is fed by Pump1 from the Lower Tank via CV-3 to the Heater, cooled by the Chiller and then to Upper Tank. In order to build this cycling, valves 3 and 13 are open and valves 11 are CV-14 are close.
1.Close CV-3, 11,13 2.Open CV-14 Close Water Loop
without
Pressurizer(Solid)
P1 controlled by CV-13, CV-16
Primary water pressure (P1) Valves
Figure 2.14 P&ID diagram of partial NPCTF in Open mode
2.6 Summary
In summary, in this chapter, four main functions of this NPCTF, are explained and described in detail. They are process control, sequence control, safety systems and operation modes. The construction and design of the DCS system to implement these functions are the topics of this research and are presented in Chapters 3 and 4. Their evaluations are also the topic of this research and are discussed in Chapter 5.
Pump1 Heater SV-2 F1 Alarm/Display Relief valve CV-1 CV-2 CV-19 CV-20 SV-1 FV-1 FV-3
Max outlet temp: 65 Celsius Coiled pipe Bearing fault injection Display Instrument signals
Spill water collection tray
Upper tank DAQ Po1 C1 V1 T4 T1 T2-1/2/3 P1 C2 FV-2 FV-6 CV-25 T5 T3 L4 P2 Diffuser at tank bottom Chiller HX F3 T6 T7 CV-18 CV-11 CV-12 Pressurizer P4 L3
To lower tank or spill collection S p i l l p r e v e n t i o n F4 CV-17 CV-15 L1 SDS1 Switch Controller B B A C C A 2-out-of-3 relays C3 CV-14 CV-16 Pump2 C5 V2 CV-3 CV-13 Lower Tank HX behind tank CV-34 Linear motor assembly SDS2 Switch Gravity drop rod Pneumatic gripper air Lower Tank Heater
Pump 2 Pump 1
Pressurizer
HX Tank
Chapter 3
Control System Design for NPCTF using DeltaV DCS
The Delta-V DCS system is one of the widely used DCS systems in industry [26] [27]. Therefore, DeltaV DCS system is selected to be used in this research to implement the functions of NPCTF described in Chapter 2: process control, sequence control, safety system, and operation modes.
3.1 Introduction to DeltaV DCS system
As a typical DCS system presented in Section 1.1.2, the DeltaV DCS system consists of devices at the control and supervisory level. As illustrated in Figure 3.1, the DeltaV DCS system in this research consists of workstation, two hubs, two system power supplies and two controllers for redundancy, and I/O cards. While the other components are standard design, I/O cards are different from project to project.
Figure 3.1 DeltaV system overview diagram
The workstation has all the software to configure the control strategies for the field device and HMI to monitor and operate process variables. The DeltaV system used in this
Workstation
Primary Control Network Primary Hub
Secondary Control Network Secondary Hub
I/O Subsystem System Power Supply Process
Control Level Supervisory
Level
research is Version 8 with the operating system Microsoft Windows XP and has OLE for Process Control (OPC) which stands for Object Linking and Embedding (OLE) for Process Control, to connect with third party software. The communication between PLC and computer is Ethernet with redundancy through two hubs.
At the control level, two power sources supply DC power to controllers. I/O modules function as the interface between field devices and CPU. Typically, there are four kinds of I/O cards: AI (analog input), AO (analog output), DI (digital input), and DO (digital output). I/O modules obtain data from field process and convert to discrete signal. Output cards send the signal from the process unit to drive field devices. One important function of an I/O card is to isolate high level real world signals from low level signals in the I/O bus with optical isolators to protect the I/O card. A/D converters in analog input cards convert analog signal to discrete signal for the/a process unit. D/A converters in input cards convert discrete signal to analog signal to drive field devices.
In this NPCTF system, there are 25 AI signals, 20 AO signals, 3 DI signals, and 12 DO signals. The details are listed in Appendix A. Each of the DeltaV I/O cards has 8 channels for 8 signals. Therefore, it needs 4 AI cards (4x8=32 channels), 3 AO cards (3x8=24channels), 1 DI card (8 channels), and 2 DO cards (2x8=16 channels).
3.2 System Configuration and Connection
3.2.1 DeltaV cabinet configuration
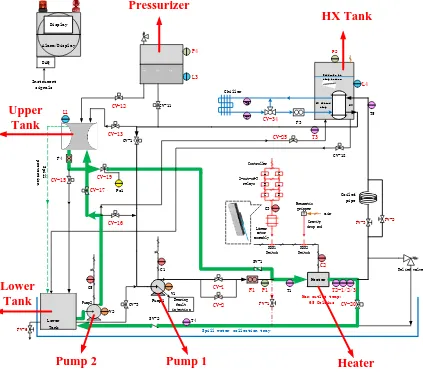
Figure 3.2 Device schematic diagram in DeltaV cabinet
3.2.2 I/O card wiring diagrams
I/O cards communicate with CPU through carriers which hold all the I/O cards. Meanwhile, all the I/O cards need to be wired to the field devices in order to communicate with field devices.
AI4 AO1 AO2 AO3 DI DO1 DO2
AI1
DI1
AI2 AI3 AI4 AO1 AO2 AO3
DO1 DO2 DO3 DO4
AO3
129-144
101-112113-128 145-160161-176177-192193-200
1-16 17-32 33-48 49-64 65-80 81-96 97-100
SPARE
PWR 1 PWR2 F
CB
DO3
DO4 S
P RM
P1 C1 P2 C2 FB FB PB DN AS-i AI1 AI2 AI3
PWR1 PWR2 PWR2
PWR2
PWR1 AC
P: System Power Supply
C: Controller MD Plus
DN: DeviceNet PB: Profibus DP
FB: Fieldbus H1 F: Fuse
CB: Circuit Breaker
SWITCHES
RM: Remote Unit S: Serial R_DO1_5 R_DO1_6 R_DO1_7 R_DO1_8 R_DO1_1 R_DO1_2 R_DO1_3 R_DO1_4 TERMINALs TERMINALs RELAYs CARRIER 3 CARRIER 1 CARRIER 2
All the process variables, such as pressure, level, flow, temperature, are sent to the PLC in the format of 4-20 mA through analog input (AI) cards. Because the 4-20 mA analog input signals have power source, 4-wire AI cards are used to isolate the power source in the AI cards to prevent the conflict of the two power sources in the AI signal circuit. Wiring of the AI card is shown in Figure 3.3. Two wires of each signal from transmitter (“T”) are connected to the AI card termination (“+” and “-”), as shown in Figure 3.3.
Figure 3.3 AI card wiring [28]
Figure 3.4 AO card wiring [28]
Digital input (DI) signals indicate the switch status. The power source comes from DI cards. The contacts of the switch are directly connected to the DI card termination (“+” and “-”), as shown in Figure 3.5.
For digital output (DO) signals, DeltaV DO cards only allow DC power source. Therefore, except signals of “ROD DOWN”, “DOWN”, “INTERM”, and “HOME” which are powered by DC, other digital output signals which are powered by AC cannot be directly wired to DeltaV DO card and, thus, an intermediate circuit is needed. Therefore, signals “ROD DOWN”, “DOWN”, “INTERM”, and “HOME”, are directly wired to DO card termination (“+” and “-”), as shown in Figure 3.6. Others, shown as “Load” in Figure 3.7, are wired to the contacts of the relays (“RELAYS R_DO1_1~8” in Figure 3.7) in the intermediate circuit and the relays (“RELAYS R_DO1_1~8” in Figure 3.7) are wired to DO cards, as shown in Figure 3.7.
Figure 3.7 DO signal intermediate circuit
3.2.3 Connection to field devices
The connection includes connecting the server to the switches which are connected to PLCs with a Cat5e Internet cable, and connecting I/O cards to field devices using 22 gauge wires, as indicated in Figure 3.8.
The DelatV system has primary and redundant networks. Therefore, there are primary and secondary ports for two networks in the server. Accordingly, there are two switches for two networks. Each of two PLCs is connected to two switches: primary port of PLC will be connected to the primary switch, and the secondary port of the PLC will be connected to secondary switch. Figure 3.8 shows the wiring.
The wiring from I/O cards to the field devices are connected through terminals in the DeltaV cabinet and DCS cabinet, as shown in Figure 3.8. The wiring diagrams of each kind of I/O cards are presented in section 3.2.2.
DO1
NO DC
RELAYs R_DO1_1~ 8
FUSE
POWER
All signals, their terminal numbers in DeltaV cabinet and DCS cabinet, their cable number, position in I/O cards, and their signal types are listed in the appendix A.
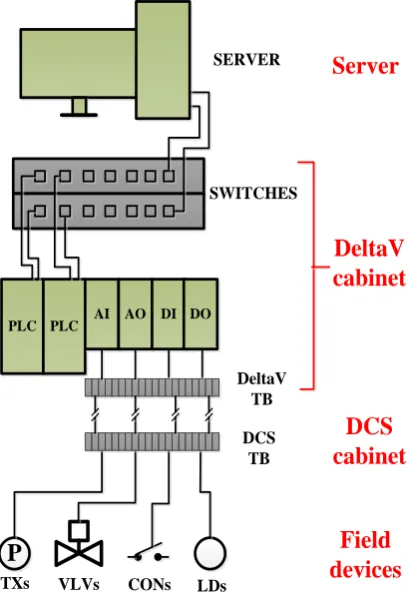
Figure 3.8 Schematic diagram of wiring system
The actual devices corresponding to the system indicated in Figure 3.8 are shown in Figure 3.9 to 3.12. Figure 3.9 indicates the server and the screen. Figure 3.10 shows the DeltaV cabinet where all the PLCs, I/O cards, switches, DeltaV terminals and powers are mounted inside the cabinet. Figures 3.11 shows the DCS cabinet where all of the signals from the DeltaV cabinet are connected to the field devices. Figure 3.12 shows all filed devices including control valves and transmitters.
PLC PLC AI AO DI
P
SWITCHES SERVER
VLVs TXs
DO
CONs LDs
DeltaV TB
DCS TB
Field devices
Figure 3.9 DeltaV server and screen
Figure 3.10 DeltaV cabinet
TERMINALS SWITCHES IO CARDS PLCs
Figure 3.11 Wiring of DCS cabinet
\
3.3 Programming Architecture Design
As discussed in Chapter 2, there are mainly three functions implemented in this research. The hardware of the DeltaV system, in order to implement these functions is discussed in Section 3.2. This section will present the structure to implement the functions.
The whole control structure involves many subsystems and algorithms. A clear and logical organization of the subsystems and algorithms facilitate not only the running of the program, but also design maintenance and troubleshooting.
As shown in Figure 3.13, a typical DeltaV system organizes the programming architecture as hierarchical structure: “Areas”, “Modules”, “Algorithm”, “Function Blocks or Composites”, and “Parameters”.
Figure 3.13 Programming architecture schematic diagram of typical DeltaV system
Plant
Tank Plant Areas
Modules FBs Parameters Control Strategies FIC-101 (PID Loop) PID1 Gain (Tuning) IO_IN (Input) HI_LIM (Alarm) XV-101 (Block Valve) MTR-101 (2-State Motor) AI AO Function Block Diagram Algorithm (FBD or SFC)
Steam
Generator Deaerator
For NPCTF, control architecture of the whole system, named as “PCTF_SIMON”, is designed in the “Areas” level. Each sub-system is designed at the “Modules” level, as shown in Figure 3.14. Each sub-system includes the algorithm and logic which are programmed using languages of FBD (Function Block Diagram) or SFC (Sequential Function Chart). Each module consists of different kinds of function blocks with their own parameters, such as Proportional-integral-derivative (PID). In order to implement the functions (i.e. process control, safety, sequence, and operation modes) described in Chapter 2, twenty modules are designed for this NPCTF system, as shown in Figure 3.15. Each process control loop becomes one module and there are eleven modules for process control. Each type of I/O signals has one module and, thus, there are four modules for I/O signals. There are five other modules for safety, sequence, operation mode, stop system, and ratio.
Figure 3.14 Programming architecture schematic diagram of NPCTF
CONTROL STRATEGIES PCTF_SIMON Areas Modules FBs Parameters Control Strategies UPPER_TANK_L PID1 Gain (Tuning) SP (Setpoint) IO_IN (Input) STOP_SYSTEM SG_HX_TANK_L CALC1 AI1
3.4 DCS Programming Languages (IEC 61131-3)
As discussed in section 3.3, the modules of the programming architecture are programmed with industrial languages prescribed in the standard of IEC 61131-3.
The programming of the early PLC was of ladder the diagram type. It resembled the circuit diagram and still remains one of the most popular PLC programming languages [29] [30]. However, with the integration of distributed control, sequential control, and factory control system, the controller is required to do multi-task operations. However, ladder diagram language is difficult to control application with multiple events occurring at the same time [31]. Other limitations includes: lack of software structure, problem in reusability, poor data structure definition, lack of support for describing sequential behavior, and difficulty in handling complex arithmetical operation [32]. Different PLC manufacturers developed their own programming languages to solve these problems. The multiplicities of languages and even proprietary programming languages or tools were too complex for customers to handle. Standardization of these practices became necessary. IEC adopted the prevalent programming practices of major PLC manufacturers and published the standard IEC 61131-3. In fact, language defined by IEC 61131-3 is also recommended to implement application functions of nuclear power plants [33].
3.4.1 Function block diagram (FBD)
FBD is one of the graphical languages in the IEC61131-3 for programmable logic controller design. It uses the following graphical conventions as shown in Figure 3.16 [32]:
A function block is a rectangular bock with inputs entering from the left and outputs exiting from the right.
The name of the function block and its instance are shown on top of the block.
The inputs and outputs of the function block are shown within the block.
Figure 3.16 Individual function block
The function block diagram (FBD) network includes connections, graphical elements for execution control (“Jump” in Figure 3.17), and graphical elements to call function or function blocks. Some platforms of manufacturers include connectors which are used to construct long network. These connectors are not control or data flow elements [34]. Connections are horizontal or vertical lines which carry the signal and connect the functions and function blocks. Signals flow from left to right or from top to bottom along the connections. Left or top is input, and right or bottom is output. In special cases, the signals can be fed back, as shown in Figure 3.17. It is possible to split a line into several
FB Type FB
Instance
connections. For example, in Figure 3.17, the connection from “OUT” of “AI1” is split into two connections. However, it is forbidden to connect more than one output to one input. For example, in Figure 3.17, it is not allowed to connect more than one connection to “CAS_IN” of “AO1”. Different data type of variables, such as a floating-point double word or Boolean value, can flow along the connections. However, the output parameter must be the same data type as the connected input parameter.
In an FBD network, the execution could transfer from one part of network to another. As shown in Figure 3.17, “PV” points to the signal from “AI1” to other part of FBD network. The graphical representations for calling an FB or function are similar. They have input and output parameters which are indicated in the block, as “PID” in the Figure 3.17.
Figure 3.17 FBD Network
The FBD network is evaluated by PLC according the following rules:
Before the functions or function blocks in the network are evaluated, all the inputs values from other elements must be available.
Connection FB
Jump
The outputs of a function block cannot be considered available until all its outputs have been evaluated.
The FBD network is not complete until all the outputs of its functions and function blocks have been evaluated.
3.4.2 Sequential Function Chart (SFC)
Sequential function chart (SFC) is a graphical language for programmable logic controllers (PLCs). It is one of the five languages defined by IEC 61131-3 standard. It can be used to program processes that can be split into steps.
As shown in Figure 3.18, the sequential function chart (SFC) network consists of Steps (rectangular boxes: S1 to S4), Transitions (bars with identifiers: T1) and Links. Steps are associated with actions, Transitions are logic conditions, and Links connect Steps and Transitions. A Step is either active or inactive. When a Step is active, the associated actions are executed until the Step becomes inactive. The status of active or inactive is decided by Transition. The Transition is programmed by Transition condition which is a Boolean expression. When the Transition becomes true, the Step immediately before it becomes inactive and the one immediately after it becomes active. Therefore, the processes with a step by step state behavior are suitable for programming with SFC.
3.5 Programming Algorithms for Modules
The purpose of the programming is to implement the functions described in Chapter 2. Section 3.3 discussed the programming architecture of this project. Modules of the programming architecture are implemented by programming. Under the structure, as shown in Figure 3.19, modules of STOP_SYSTEM and SEQUENCE are step by step with sequence in nature and, thus, are programmed using SFC language. For the STOP_SYSTEM, when the operator wants to stop the system, the system is reset to original status, i.e. all valves to normal status: open for NO (normal open) valves and closed for Normal Close (NC) valves; all the heaters, and pumps are stop; and all the tanks are empty. The operation of these devices is sequential. The main purpose of the SEQUENCE is to fill up the pipes and tanks. The filling procedure is step by step. Refer to Figure 2.4 in Section 2.3 for the logic procedure and Section 2.3 for more function details. The Pressurizer is first filled up and then the HX Tanks. The Upper Tank is the last one to fill up; therefore, they are programmed using SFC language. Detailed programming is shown in appendix D.
Other modules are programmed using FBD. AI, AO, DI, and DO modules are the interfaces between signals from and to local devices and programming algorithm. The SAFETY module is used to implement the safety functions of SDS1, SDS2, and ECC described in section 2.4 (referring Figure 2.5 to 2.8 in section 2.4 for their logic diagrams).
Figure 3.19 Programming architecture of NPCTF
3.6 Human Machine Interface (HMI) Configuration: Graphics and
Faceplates
The Human Machine Interface (HMI), as indicated in Figure 3.20, is created mainly to monitor and control the process in order to implement the functions introduced in Chapter 2: process control, sequence control, safety shutdown, and operation modes. It is similar with the P&ID diagram of NPCTF of Figure 2.2 in Chapter 2.
“STOP SYSTEM” in Figure 3.20, the button becomes brown and the system is also stopped.
Figure 3.20 HMI of NPCTF
Safety
Sequence
Operation modes Faceplate
Figure 3.21 Typical faceplate
Figure 3.22 Current trend of controller parameters
Detail
Figure 3.23 Controller tuning parameters
3.7 Summary
Chapter 4
Process Controller Design in DeltaV DCS
As described in Chapter 2, process control is part of the functions designed and evaluated in this research. This chapter describes the design of controller for process control. There are 11 process control loops which are given in Appendix B. Focus is given to the SG Tank level control to illustrate the detail analysis and design process. Other loops are tuned based on experience.
4.1 Development of Control Strategies
For process control described in Chapter 2, the feedback control system shown in Figure 4.1 is designed to control the process variables (PVs). The process variables, such as Heater outlet temperature (T2), are measured and sent to the controller. The controller compares the measured variable with the value set by operator (SP) and calculates the action (M) needed to change the process in order to make the process variable equal to the value designed by the operator.
Figure 4.1 Process control diagram
For controller algorithm in DCS system, such as DeltaV system, the control strategies could be advanced control strategies. The NPCTF in this research is tested with PID controllers which are widely used in variable industries.
Controller Process SP
PV M
E
4.1.1 Proportional-integral-derivative (PID) algorithm
Error (E):
Error (E) is defined as the deviation from set-point [35]. For different DCS systems, the definition of error may be different. In DelatV system, E is defined as [28]:
E = SP – PV (4.1) where
SP is an input variable that sets the desired value of the controlled variable manually, automatically, or by means of a program in the same units as the controlled variable.
PV is the process variable to be controlled, such as water temperature, pressure, level, etc. Proportional Control (P):
Proportional action keeps the output of the controller in proportion to the error:
is the controller gain. E is the error between set-point and process variable. M is the
output of the controller. The term C is necessary since it is hard to be the case that zero error coincides with zero controller output.
In order to obtain the value of the controller output, it also needs to know C. Therefore, another form of controller output is often used. Assume current error is En, and previous
error is En-1, then we have:
c
Subtracting (4.3) by (4.4) gives:
Using this version to calculate the controller output, it needs to calculate the current and previous errors between set-point and process variable.
Integral Control (I):
Integral control eliminates the offset of the process variable from the set-point. It keeps changing the controller output as long as the error exists:
(4.6) is integral time. Integrate both sides, and the following can be obtained.
(4.7) If the scan interval is , the discrete form of the equation becomes:
(4.8) Derivative Control (D):
Very few industrial controllers use derivative action because of noise [35]. The principle behind derivative action is if the error changes quickly, it can become large in the future. Derivative action tries to prevent this change by changing the output in proportion to the change rate of error E:
(4.9)
is the derivative time which can be adjusted. The discrete form of the above equation is:
c
I
dM K
E
dt
c I K M Edt
s T s c n I TM K E
(4.10) Previous scan interval is:
(4.11) Subtracting (4.10) by (4.11)
(4.12) For PI control:
Conventional analog form is:
(4.13) Discrete form is:
(4.14) For PID control:
Conventional analog form is:
(4.15) Discrete form is:
(4.16)
4.1.2 Control loops with two actuators
In an NPCTF system, there are a couple of loops which process variables are adjusted by two valves – one mainly to increase the process variable and another to decrease the PV.
1
n n
n c D
s E E M K T 1 2 1 n n
n c D
s E E M K T 1 2
( 2 )
c D
n n n
s
K
M E E E
T
1
( ) s
c n n n
I
T
M K E E E
1 c I
M K E Edt
1 c D I dEM K E Edt
dt
1 1 2
( ) s D( 2 )
c n n n n n n
I s
T
M K E E E E E E
For example, valves CV-13 and CV-16 are used to control the water inventory pressure P1, as shown in Figure 4.2. While CV-16 is mainly used to increase the pressure P1 and CV-13 is used to decrease pressure P1, CV-16 can be closed to decrease the pressure P1 and CV-13 can be closed to increase the pressure P1. The question is that, if the pressure P1 is increased, should it increase CV-16 or decrease CV-13? In order to solve this conflict, the opening of one of the valves is fixed and another valve controls the process variable. The two actuator loops and the fixed valves are shown in Table 4.1.
Figure 4.2 Diagram of water inventory control process
CV-16 CV-13
![Figure 1.3 Typical DCS system structure [18]](https://thumb-us.123doks.com/thumbv2/123dok_us/7764243.1275835/25.612.203.416.96.297/figure-typical-dcs-system-structure.webp)
![Figure 2.2 P&ID Diagram for NPCTF [25]](https://thumb-us.123doks.com/thumbv2/123dok_us/7764243.1275835/33.842.126.736.107.519/figure-p-id-diagram-npctf.webp)
![Figure 3.4 AO card wiring [28]](https://thumb-us.123doks.com/thumbv2/123dok_us/7764243.1275835/52.612.172.477.432.646/figure-ao-card-wiring.webp)