A Method for the Measurement of Mercury in Human
Whole Blood
Alicia E. Stube, Helene H. Freiser, Charles R. Santerre*
Department of Nutrition Science, Purdue University, West Lafayette, Indiana, USA E-mail:*[email protected]
Received July 26, 2011; revised September 1, 2011; accepted September 12, 2011
Abstract
A method for measuring total mercury in human whole blood using Thermal Decomposition-Amalgamation/ Atomic Absorption Spectrophotometry (TDA/AAS) was developed and applied to a study of women that were fish consumers. This method has a limit of detection of 0.33 μg/L. The blood mercury concentrations measured ranged from 0.74 μg/L to 14.80 μg/L, with a mean of 3.36 μg/L. Accuracy was within 15% of the expected value at the lower concentrations and within 10% at higher concentrations. Some 560 analysis were completed in about three weeks and the mean error in precision was 1.8% when measured in duplicate. It was concluded that this method is viable for use in clinical settings, with the benefit of small sample volumes and minimal sample preparation.
Keywords:Mercury, TDA/AAS, Human Blood
1. Introduction
Mercury (Hg) status can be assessed by hair or blood biomarkers [1]. Humans who consume certain types of fish may have higher mercury concentrations in their system [2]. Methyl mercury is readily absorbed from the gut into the bloodstream, where it binds to red blood cells [3]. Previous analytical methods for measuring blood mercury tested only red blood cells; however whole blood methods are now gaining ground [4]. Use of whole blood reduces sample preparation time and elimi-nates uncertainty relating to cell number. Centrifugation and separation of red blood cells also present an oppor-tunity for analyte loss and increases the overall uncer-tainty in measurement. Reducing the time and steps in-volved in sample preparation facilitates measurement of mercury in clinical settings.
The traditional methods for measuring mercury are cold-vapor atomic absorption spectroscopy (CVAAS) and inductively-coupled plasma mass spectrometry (ICP-MS) [5,6]. These methods are accepted as reliable and sensitive; however, throughput of samples is slow, with high equipment and reagent costs. The samples are exposed to concentrated acids and extended heating, which increase analyte loss [7]. Thermal Decomposition- Amalgamation/Atomic Absorption Spectrophotometry (TDA/AAS) is an emerging technique for rapidly testing
large numbers of samples [8]. Samples are introduced directly to the instrument and analyzed in minutes with-out the need for extensive preparation [9]. This high throughput method allows large number of samples to be analyzed accurately and rapidly with less analyte loss than the conventional methods listed above. TDA/AAS also contributes to the movement towards green chemis-try, requiring no preparatory reagents or hazardous che- micals. This technology has already been utilized for analysis of avian blood samples with high mercury con-centrations [4]; however, because of the low concentra-tion of mercury in human blood there is currently no re- liable TDA/AAS method. This paper proposes a method for TDA/AAS analysis of whole blood that would be usable for clinical applications with subjects within typi-cal human blood mercury concentrations.
2. Materials and Methods
2.1. Instrumentation and Chemicals
(Accustan-dard, New Haven, CT) of 0.1 μg/ml mercury in 5% nitric acid was used to calibrate the instrument and act as a running standard. SRM 966 (NIST, Gaithersburg, MD), Toxic Elements in Bovine Blood, level 1, was used as Standard Reference Material (SRM). A single human blood sample from an individual low in mercury was used to establish a baseline and for spiking. For verifica-tion, four samples of blood from 70 subjects were util-ized, for a total of 280 samples. Blood was drawn into EDTA K3 tubes (Greiner BioOne, Monroe, NC). These
samples were stored frozen at –80˚C and then thawed and subjected to vortex mixing for at least 30 seconds immediately prior to analysis.
Approval for human subject research was obtained from the Purdue University Institutional Review Board, Research Project Number 0709005855. All subjects sign- ed a consent form detailing the research procedures and any possible risks that might be incurred as a result of participation.
2.2. Calibration
Cells 0 and 1 of the DMA 80.3 were calibrated using di- fferent volumes of the standard mercury solution in quar- tz boats (i.e. at 0.05, 0.1, 0.2, 0.3, 0.5, 1, 2, 3, 5, 7 ng of
mercury) for Cell 0. That range was extended to 10 ng of mercury for Cell 1. Cell 2 was not calibrated as its meas-urement range was well above the expected mercury levels in human blood. The linearity of the calibration curve was evaluated using this dataset and a best fit model was established using the DMA 80.3’s internal software. An S-curve was used to fit the data, resulting in a correlation equation of
3 2
0.0003 0.0015* 0.0734 0.0013
A Hg Hg
Hg
(1)
and a coefficient of correlation, R2, of 1.00. An injection
of 20 μL of 100 µg/L standard was used to confirm the calibration and was measured within 2% of the expected value. The limit of detection with this calibration was 0.33 µg/L for a 150 μL blood sample with 0.0495 ng mercury. Below 0.33 µg/L, measurements became im-precise due to background noise and residual mercury on the boats.
The calibration was confirmed daily at the start of each run using a 20 μL injection of standard solution containing 2 ng mercury. If the verification sample was off by more than 5%, a second 2 ng of mercury sample was run to establish a calibration factor to be applied to all of that day’s measurements. If the verification was off by more than 10%, a new calibration curve was estab-lished. The standard solution was used in conjunction with a 150 μL injection of SRM 966 level 1 to ensure
interday repeatability.
2.3. Instrument Parameters
Various parameters were tested using human blood, until a method which provided acceptable recovery and preci-sion was found. These parameters included changes to sample volume and drying/decomposition conditions. EPA method 7473 was used as a starting point, as it had previously been validated as an effective and reliable method to measure mercury in fish tissues [10]. A me- thod provided by the manufacturer was also considered, but found unsuitable for whole blood analysis. With lar-ger number of samples, this method resulted in residue accumulation in the catalyst tube and cells, wearing down the mercury vapor lamp and ultimately resulting in greater uncertainty between duplicate samples.
The optimal process conditions were found to be a sample size of 150 μL, drying at 120˚C for 2 min 20 sec, 1 min ramp to 650˚C, and finally decomposition at 650˚C for 3 min 30 sec. This set of conditions was cho-sen based on precision and reproducibility over a number of sampling days, as well as completeness of combustion. Sample volumes greater than 150 μL tended to boil over in the oven and overwhelm the catalyst tube with an ac-cumulation of ash. However, at smaller volumes, there was not enough absolute mercury present in the sample for reliable analysis.
Development of the drying/decomposition ramp was also important to avoid boiling the sample out of the boats too quickly. Too high an initial drying temperature would result in boats bubbling over and loss of volume. In these cases, a blackened crust was observed on the top and sides of the boat. The ramp was used to slowly heat the dried samples, avoiding volume loss. The decompo-sition temperature recommended by the EPA method for mercury analysis in wastewater [8] was too low to prop-erly combust the complex matrix of whole blood and would leave blackened residue in the boats after heating. Raising the temperature to 650˚C on the DMA 80.3 re-sulted in complete combustion.
The remaining instrument parameters for sample ana- lysis included a purge time of 30 sec, the amalgam time was set to 12 sec and the recording time measured 30 sec. Before a quartz boat could be used again after a blood analysis, it needed to be cleaned by going through one cycle at a drying temperature of 300˚C for 1min and de-composition at 650˚C for 3 min.
2.4. Precision and Accuracy Study
feasibility of the method. Once a method with less than 10% spread between triplicate samples was identified, spiked samples of the low mercury blood were used as to calculate precision and accuracy. Quartz boats were util-ized for blood samples and standards; a blank in the form of an empty nickel boat was placed at the beginning and end of every sample run, as well as between each indi-vidual sample to ensure any residual mercury from the previous sample was burned off.
The baseline low mercury human blood sample, 150 μL for each concentration, was spiked with fixed amounts of standard mercury solution at 2.2, 5, 10, 20 and 30 μL. The series of standards was analyzed five times. For each concentration, a predicted mercury concentration was also calculated, taking into account the approximate mer- cury content of the baseline blood. Measurements were compared to calculated concentrations, and the percent error was used as an estimate of accuracy. For precision calculations, the mean and relative standard deviation for the five samples was determined.
2.5. Verification Study
Human blood samples were used to check the reference range and confirm that the method was useful for analysis of a large number of human blood samples. Before and after each day’s run of human blood samples, a 150 μL sample of SRM 966 was analyzed, and the results were used to formulate a control chart. Quality control limits were set at two standard deviations from the mean. Runs where the SRM value fell outside the three standard de-viation control limits were removed and the samples done that day re-analyzed after a recalibration. The samples for the verification study were done in duplicate. If more than 10% error was observed between duplicate samples, the samples were reanalyzed. Data from the control chart were tracked to observe between day precision.
3. Results and Discussion
3.1. Assessment of Method
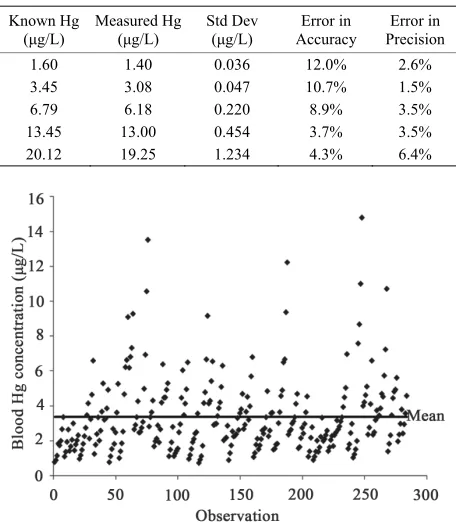
[image:3.595.310.538.433.694.2]Accuracy and precision were measured using spiked b- lood samples. Baseline blood was taken from a non-fish eater and estimated to contain 0.122 μg/L mercury after five sample runs. This blood was used as a baseline to represent the low anchor of the range of expected human blood mercury concentrations. Aliquots of the baseline blood were spiked at five concentrations using a standard mercury solution; the mean, standard deviation, and cal-culated errors in precision and accuracy are shown in
Table 1.
At each concentration, the measured DMA 80.3 values were slightly lower than the expected blood mercury levels. Accuracy was within 15% of the expected value at the lower concentrations and within 10% at higher concentrations. When 2.2 μL of standard solution were added (expected concentration 1.6 μg/L), 87.5% of the mercury was recovered and measured by the instrument. When the spiked amount was raised to 30 μL, 95.6% of the mercury was recovered. Loss of mercury may also be attributable to the volatility of the standard mercury solu-tion; some of the spiked mercury may have been lost before the sample could be introduced into the instru-ment [7].
Error in precision was very low across all of the spiked blood samples, consistently below 5%. This did not appear to relate to concentration, as values were si- milar at both high and low concentrations. Overall the blood method showed excellent recovery in spiked sam-ples as well as intra-day precision.
3.2. Method Validation via Analysis of Human Blood Samples
A total of 280 different blood samples from 70 different female subjects were used to evaluate the method’s fea-sibility in clinical applications. These measurements are shown in Figure 1.
Table 1. Precision and accuracy of spiked blood samples.
Known Hg (μg/L)
Measured Hg (μg/L)
Std Dev (μg/L)
Error in Accuracy
Error in Precision
1.60 1.40 0.036 12.0% 2.6%
3.45 3.08 0.047 10.7% 1.5%
6.79 6.18 0.220 8.9% 3.5%
[image:3.595.307.540.436.695.2]13.45 13.00 0.454 3.7% 3.5% 20.12 19.25 1.234 4.3% 6.4%
These samples were run in duplicate and intra-sample precision was measured. Blood mercury concentrations ranged from 0.74 μg/L to 14.80 μg/L, with a mean of 3.36 μg/L and the 50th percentile at 2.76 μg/L. All sam-ples were above the detection limit and all had errors in precision of less than 10%; the mean error was 1.8% when measured in duplicate.
The current EPA reference dose (0.1 μg/kg body wei- ght-day) has been shown to provide a concentration in human blood of 5.8 μg/L [11]. Recurring levels above this value is believed to cause harm, in particular to the developing fetus. Most of the blood samples collected in this study registered lower than that threshold, as evident from Figure 1, but some fish-eating subjects had
unusu-ally high values. For those individuals quick corrective actions might be needed, highlighting the advantage of the described method.
Each sample required about 10 minutes for analysis; when analyzed in duplicate, about twenty-four minutes was spent on the analysis of each sample. In total, the time required to measure mercury concentration in these 280 samples of blood (560 analyses) was about three weeks if samples were prepared and loaded during the 40 hour work week. If samples are prepared and loaded during nights and weekends as well, sample throughput can be increased further. Preparing the samples and fill-ing the auto-sampler tray required less than an hour so most of the time spend for each lot consisted of unat-tended data collection. By comparison, it can take up to a day of preparation work to analyze samples by CVAAS or ICP-MS.
4. Conclusions
The method described here is a viable way to measure total mercury concentration in whole blood. Mercury in human blood can be measured reliably and accurately in less than ten minutes per sample. This method can be useful for large clinical studies with high volumes of samples to analyze. Since only a 150 μL sample volume is required, it may also not be necessary to draw venous blood to measure an individual’s blood mercury levels. A fingerstick with a deep puncture blade can draw up to 1 mL of blood, sufficient for analysis via this method. Fin-gersticks are faster and less invasive than venous blood draws. Collection of fingerstick samples makes meas-urement of blood mercury more accessible and practical for situations outside of the clinical setting. The ability to utilize small sample volumes combined with a rapid turn-around time makes measuring blood levels just as viable as hair concentrations for efficient assessment of mercury exposure. Use of this method for analysis of total mercury in human whole blood provides a green alternative that is
simple, reliable and time efficient.
5. Acknowledgements
Financial support for this study was obtained from the US Department of Agriculture, National Institute of Food and Agriculture (No. 07-51110-03804). Collection of blood samples was done by Doug Maish, EMT-P, Purdue University.
6. References
[1] T. W. Clarkson and L. Magos, “The Toxicology of Mer-cury and Its Chemical Compounds,” Critical Reviews in Toxicology, Vol. 36, No. 8, 2006, pp. 609-662.
doi:10.1080/10408440600845619
[2] E. Oken, J. S. Radesky, R. O. Wright, D. C. Bellinger, C. J. Amarasiriwardena, K. P. Kleinman, H. Hu and M. W. Gillman, “Maternal Fish Intake during Pregnancy, Blood Mercury Levels, and Child Cognition at Age 3 Years in a US Cohort,” American Journal of Epidemiology, Vol. 167, No. 10, 2008, pp. 1171-1191.
doi:10.1093/aje/kwn034
[3] L. W. Chang, “Toxicology of Metals,” Lewis Publishers, Boca Raton, 1996, p. 1052.
[4] J. T. Ackerman, C. A. Eagles-Smith, J. Y. Takekawa, J. D. Bluso and T. L. Adelsbach,” Mercury Concentrations in Blood and Feathers of Prebreeding Foster’s Terns in Relation to Space Use of San Francisco Bay, California, Habitats,” Environmental Toxicology and Chemistry, Vol. 27, No. 4, 2008, pp. 897-908. doi:10.1897/07-230.1
[5] APHA. 3112, “Metals by Cold-Vapor Atomic Absorption Spectrometry,” In: M. A. H. Franson, Ed., Standard Methods for the Examination of Water and Wastewater, Ame- rican Public Health Association, Washington D. C., Vol. A, 1998, pp. (3-22) - (3-24).
[6] APHA. 3120, “Inductively Coupled Plasma (ICP) Me- thod,” In: M. A. H. Franson, Ed., American Public Health Association, Washington D.C., Vol. B, 1998, pp. (3-38) - (3-52).
[7] D. D. Afonso, Z. Arsian and A. J. Bednar, “Assessment of Matrix-Dependent Analyte Stability and Volatility during Open-Vessel Sample Dissolution for Arsenic, Ca- dium, Mercury and Selenium,” Microchimica Acta, Vol. 167, No. 1-2, 2009, pp. 53-59.
doi:10.1007/s00604-009-0218-3
[8] EPA, “Method 7473: Mercury in Solids and Solutions by Thermal Decomposition, Amalgamation, and Atomic Adsorption Spectroscopy,” Agency UEP, 1998.
[10] J. A. Lasrado, C. R. Santerre, S. M. Shim and J. R. Stahl, “Analysis of Mercury in Sportfish Tissue by Thermal Decomposition, Amalgamation/Atomic Absorption Spec-trophotometry,” Journal of Food Protection, Vol. 68, 20 05, pp. 879-881.
[11] L. Trasande, P. J. Landrigan and C. Schechter, “Public Health and Economic Consequences of Methyl Mercury Toxicity to the developing Brain,” Environmental Health Perspectives, Vol. 113, 2005, pp. 590-596.