AN ANALYTIC STUDY ON THE IMPLEMENTATION OF PEOPLE ANALYTICS
IN A SMALL SCALE RETAIL ORGANIZATION
ARTICLE INFO ABSTRACT
People analytics is a relatively new aspect of Business Analytics and this paper deals with the implementation of people analytics in a small
small-scale Retail organization,
Employee Churn, End of Month Sales bulk up which are dealt with using a People analytics approach as Employees are the pillar of any organization. The aspects of data extraction using surve
Organizational network analysis, data preparation to remove outliers are discussed. The methods on how essential data was collected in the organization and the graphical aspects of the People Analytics study are achieved using Descriptive analyt
Prescriptive analytics post which inferences were made and shared with business. Positive changes were observed post the implementation of the People analytics fix in the work pattern of the employe
paper brings to light the capabilities of People analytics together with the power of increasing data availability and emphasizes on why every organization sho
People Analytics capability to improve and smoothen its functionality.
Copyright©2017, Nijanth Anand. This is an open access article distributed under the Creative Commons Att distribution, and reproduction in any medium, provided the original work is properly cited.
INTRODUCTION
People analytics which deals with helping organizations take better decisions on both staffing and managing current employees is crucial as it can help either way in both the development/decline of the company. People analytics constitutes multiple factors ranging from Collaboration, Performance Evaluation, Staffing and Attrition. The target organization in the study is a Retail organization which has its own Sales, Logistics and Finance teams and supplies retail goods to retailers. The organization has a w
19employees (deemed a Small-scale organization) and is facing multiple issues with the main issue being Very High Office timings and attrition of employees. The paper covers the various aspects of People analytics done with the limited data available in the organization. The analytic study involves a complete study of the working hours of employees from the Biometric Attendance system including the time they start work and when they leave for home with History data load of 3 months data. A survey was conducted with the employees to find interdependence, causation and collaboration between the employees. The performance of the employees was tracked on a regular basis for a period of 1 month on a day to day basis to
*Corresponding author: Nijanth Anand,
NTT Data Services, India.
ISSN: 0975-833X
Article History:
Received 28th July, 2017
Received in revised form 16th August, 2017
Accepted 08th September, 2017 Published online 31st October, 2017
Available online at http://www.journal
Citation: Nijanth Anand, 2017. “An analytic study on the implementation of people analytics in a small scale retail organization
Current Research, 9, (10), 59512-59517.
Key words: Business Analytics, Data Preparation, Data Exploration, Descriptive Analytics, Prescriptive Analytics, Predictive Analytics.
RESEARCH ARTICLE
AN ANALYTIC STUDY ON THE IMPLEMENTATION OF PEOPLE ANALYTICS
IN A SMALL SCALE RETAIL ORGANIZATION
*Nijanth Anand
NTT Data Services, India
ABSTRACT
People analytics is a relatively new aspect of Business Analytics and this paper deals with the implementation of people analytics in a small-scale retail organization over a period of 4 months. The scale Retail organization, the subject of the study faces issues such as High Working hours, Employee Churn, End of Month Sales bulk up which are dealt with using a People analytics approach as Employees are the pillar of any organization. The aspects of data extraction using surve
Organizational network analysis, data preparation to remove outliers are discussed. The methods on how essential data was collected in the organization and the graphical aspects of the People Analytics study are achieved using Descriptive analytics. Descriptive analytics was followed by Predictive and Prescriptive analytics post which inferences were made and shared with business. Positive changes were observed post the implementation of the People analytics fix in the work pattern of the employees, organizational efficiency apart from resolution of different issues in the organization. The paper brings to light the capabilities of People analytics together with the power of increasing data availability and emphasizes on why every organization should emphasize developing an in People Analytics capability to improve and smoothen its functionality.
is an open access article distributed under the Creative Commons Attribution License, which distribution, and reproduction in any medium, provided the original work is properly cited.
People analytics which deals with helping organizations take better decisions on both staffing and managing current employees is crucial as it can help either way in both the development/decline of the company. People analytics ranging from Collaboration, Performance Evaluation, Staffing and Attrition. The target organization in the study is a Retail organization which has its own Sales, Logistics and Finance teams and supplies retail goods to retailers. The organization has a workforce of scale organization) and is facing multiple issues with the main issue being Very High Office timings and attrition of employees. The paper covers the various aspects of People analytics done with the limited data ilable in the organization. The analytic study involves a complete study of the working hours of employees from the Biometric Attendance system including the time they start work and when they leave for home with History data load of 3 y was conducted with the employees to find interdependence, causation and collaboration between the employees. The performance of the employees was tracked on a regular basis for a period of 1 month on a day to day basis to
get more insights on the persistence and skills of the Employees. Post data exploration and all stages of data preparation, People Analytics was
insights from the data available. Data preparation was done to deal with outliers, missing values in records, anomaly detection and to generate meaningful columns and remove old ones. Heavy dependence on one of the employees wa using the Interdependence survey conducted on the Employees and the Working Hours log also showed that the Employee was generally the last one to leave office. Similarly, the working hour logs showed the Logistics team members arrived much earlier than the sales team members and spending relatively high work hours in office. Sales figures weren’t balanced throughout the month and instead were more inclined towards the end of the month result of which there was a heavy dip in Sales figures during the
and Employee work hours were less during the initial days of the month. Predictive and Prescriptive analytics was done and the Solutions were shared with business and implemented after meetings with employees on the new imp
overloaded employees were mapped with employees having similar expertise and underutilized to reduce the work load on overloaded employees. Attrition was also combatted by taking similar course of actions based on the predictions and prescriptive analytics done. There was a considerable improvement in performance of the organization and work International Journal of Current Research
Vol. 9, Issue, 10, pp.59512-59517, October, 2017 Available online at http://www.journalcra.com
An analytic study on the implementation of people analytics in a small scale retail organization
z
AN ANALYTIC STUDY ON THE IMPLEMENTATION OF PEOPLE ANALYTICS
People analytics is a relatively new aspect of Business Analytics and this paper deals with the scale retail organization over a period of 4 months. The the subject of the study faces issues such as High Working hours, Employee Churn, End of Month Sales bulk up which are dealt with using a People analytics approach as Employees are the pillar of any organization. The aspects of data extraction using surveys to find Organizational network analysis, data preparation to remove outliers are discussed. The methods on how essential data was collected in the organization and the graphical aspects of the People Analytics ics. Descriptive analytics was followed by Predictive and Prescriptive analytics post which inferences were made and shared with business. Positive changes were observed post the implementation of the People analytics fix in the work pattern of the es, organizational efficiency apart from resolution of different issues in the organization. The paper brings to light the capabilities of People analytics together with the power of increasing data uld emphasize developing an in-built People Analytics capability to improve and smoothen its functionality.
ribution License, which permits unrestricted use,
get more insights on the persistence and skills of the Employees. Post data exploration and all stages of data preparation, People Analytics was done to get more actionable insights from the data available. Data preparation was done to deal with outliers, missing values in records, anomaly detection and to generate meaningful columns and remove old ones. Heavy dependence on one of the employees was found using the Interdependence survey conducted on the Employees and the Working Hours log also showed that the Employee was generally the last one to leave office. Similarly, the working hour logs showed the Logistics team members arrived than the sales team members and spending relatively high work hours in office. Sales figures weren’t balanced throughout the month and instead were more inclined towards the end of the month result of which there was a heavy initial weeks of the next month and Employee work hours were less during the initial days of the month. Predictive and Prescriptive analytics was done and the Solutions were shared with business and implemented after meetings with employees on the new implications. The overloaded employees were mapped with employees having similar expertise and underutilized to reduce the work load on overloaded employees. Attrition was also combatted by taking similar course of actions based on the predictions and ptive analytics done. There was a considerable improvement in performance of the organization and work
INTERNATIONAL JOURNAL OF CURRENT RESEARCH
hours post the implementation of the Prescriptions. The paper discusses the above aspects and stages of People analytics in detail. (Bodie et al., 2016)
Data Exploration
The core component of People Analytics is the availability of Meaningful data.The volume and quality of Meaningful Data available is directly proportional to the level of Analytics that can be performed. Meaningful data refers to data that is specific and generated in close relation to the questions/issues to be addressed using the Analytic study. So Data was specifically gathered in the organization apart from the existing Sales and Operation figures using multiple methods as specified below.
The working hour’s data from the Biometric attendance system was tabulated as a CSV file with Historic data limited to the last 3 months.
A survey was conducted to find levels of cross dependence in employees were each employee had to rate his/her dependency/frequency of contact on the particular employee on a scale of 1 to 10 and similarly the other employees rate of dependency/frequency of contact on him/her. Were 1 meant almost nil dependency between them in their functionalities in the organization and 10 meant there was complete dependency and he/she had to refer/check with her for almost all her functionalities in the organization. So with the above data we could draw a Dependency Table which showed the level of dependencies between the employees.
The level of attrition was calculated over the course of the last 1 year from the operations Data available in the Organization. The attrition rate was then calculated segment wise based on Sales team/ Logistics Team/ Finance Team. The attrition rate was also tabulated based on the age and gender of the employees from existing records.
Performance evaluation of each employee on a Week over week basis was done in a calculated manner to study their efforts on day-to-day activities and the functioning of the organization to their individual abilities without noise (eg. A senior sales executive may achieve ten times the target of a Junior sales executive. The concept here is not to regard it as a factor of performance evaluation and instead study the potential/area of the market the senior sales executive works on and compare with his figures to evaluate his performance. Also factors such as the good performance of an employee in a pretty tough and competitive market need to be taken note). So, a similar performance evaluation was done and the employees were rated on a scale of 1 to 10 post consultation with the Senior Territory Sales Executive and the owner of the organization post deep discussions and study on each team members functionality. (Rosvall et al., 2008)
There was specific requirement for Logistics data. The number of outlets/retailers to be reached out by the Logistics team, the distance in km along with the estimated time for each days supply route had to be tabulated based on day of the week.
The available sales figures were tabulated in a graphical form in a WOW (Week on Week) formatoverall and employee wise.
Staffing details which were documented were collected over a course of the 3 months of the study to find a fix to the high attrition issue.
Post the above Data extraction the next step of Data Exploration, data integration was done to map Employee records between multiple tables generated as per requirement. Data assessment was next done to identify if it the available data was meaningful and could help get insights. Summary statistics was generated to find the quality of data, Outliers, Missing value in records, range of records. Graphical analysis was achieved using Data visualization to make it easier to understand pattern and distribution in data. Anomaly detection was done to detect the wrongs using the summary statistics generated (eg) Max time having values greater than 23:59PM.
Data preperation
Data Preparation was later done on the above extracted data to make it usable and consistent so that it is ready for use as inaccurate data decreases business efficiency. New columns of data weregenerated with the existing records to provide better and easier functionality. Data transformation was done to normalize high variation and get same range. Outliers and missing records are the most common issue and are to be dealt with apart from creation of additional variables, qualitative treatment for which Data cleaning and Data transformation was done. Outliers were identified and were concluded if outliers or not with Business and Business fix was implemented after consultation with Business. High sales figures for a specific employee in a week a possible outlier were actually correct and confirmed with Business. In the survey generated data, entries greater than the specified scale of 1-10 were marked down to 10 and negative entries, entries lesser than 1 were marked up to 1 to make it normalized.
Anomaly detection was done and the records were replaced or deleted with business confirmation based on the anomaly. Missing records were identified and replaced with the Average value generated for the rest of the records if the count of missing data for a record was less. In case the impact of missing data/ number of missing columns was large with Primary key records (Employee no/Name) missing then the records were deleted. Data reduction was done to drop correlated variables as unwanted data helped save time. (E.g.) If additional correlated variable Z created had the functionality of a+b+c, then the records a, b, c were dropped in the Fact table generated post data preparation keeping the staging table intact.
People analytics
Descriptive analytics
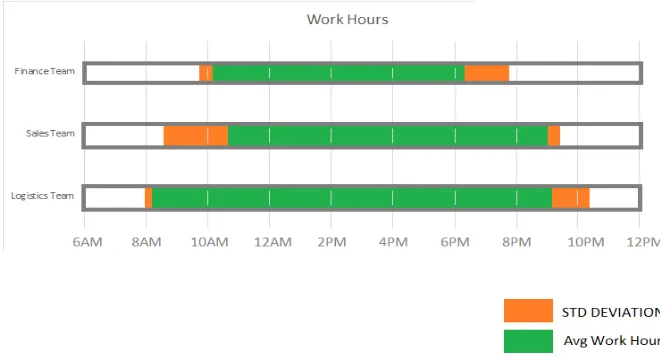
Descriptive analytics refers to using data aggregation or summarizing raw data to make it interpretable and meaningful. It’s usage on historic data involves mathematic operations Average, Mean, Median, Minimum, Maximum and statistics depending on the complexity. Data visualizations are generated from the tabulated data available and new graphical visualizations are generated using advanced reporting tools. (Wolfgang et.al, Organizational Social Network Analysis) One of the core aspects of descriptive analytics is that the visualizations generated from the tables need to be in line with the issues the People Analytic study is addressing or has to help generate solutions to the issue. As discussed in the abstract finding a fix to the three major issues high working hours, high employee churn in logistics department and end of month sales bulk up using people analytics are the main objectives of the descriptive analytic study. The first issue is that of high working hours and in relation to it we generate the department wise categorized summary graph of working hours IST based on the data available from the Biometric attendance data. The employee interdependence (ie) Collaboration between employees is visualized as anOrganizational Network Analysis (ONA) diagram from the survey table data as both inward and outward.
The above chart was generated from the Working hour table. The missing data records (ie) holidays were removed during Data preparation to get meaningful data. The ONA diagram was generated manually due to the high employee count which makes it complex to simulate. A simulated ONA diagram of Inward dependencies of two specific employees with a relatively smaller sample population has been shown below to get an idea on the ONA analysis. The thickness of the line indicates the level of inward collaboration to the specified Employee (1 or 5). If there is no inward line between them then there is no collaboration between the employees on a professional front.
[image:3.595.129.459.350.529.2]Attrition was another issue faced by the organization as it had faced heavy attrition in the last 1 year of its operation. The attrition rate was calculated based on Department the employee belonged to get better insights from the available data. The other available data such as the average age of the employee before leaving the organization, specified reason for attrition were also mined to get better insights.
Fig. 1. Work Hour Chart generated Department wise
Fig 3(a) Employee Attrition Chart diagram
Fig 3(b) Employee Churn Age wise diagram
Perfomance evaluation data available from the week on week documented employee perfomance without noise based on inputs from business and perfomance trends was visualised as a table with focus specifically on employeees showcasing steady decline in perfomance on a week on week basis.
Fig. 4.
78% 11%
11%
EMPLOYEE ATTRITION CHART
Logistics Sales Finance
33%
45% 11%
0% 11%
EMPLOYEE CHURN AGE WISE
20-25 25-30 30-35 35-40
0 2 4 6 8 10
EMPLOYEE PERFORMANCE
EVALUATION
10 22 9 7
Attrition Chart diagram
Employee Churn Age wise diagram
Perfomance evaluation data available from the week on week documented employee perfomance without noise based on inputs from business and perfomance trends was visualised as focus specifically on employeees showcasing steady decline in perfomance on a week on week basis.
Logistic data was tabulated in the form of daily route map to get figures on Logistics team distance covered in a particular day and to get the average estimated time to cover the specified route so that better insights could be generated from the available data. The below plot was generated by plotting average distance covered and the average time taken to complete the supply chain for the particular day of the week.
Fig
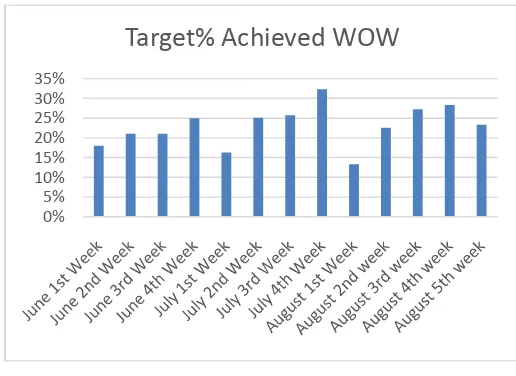
The sales figures were tabulated on a week over week basis with the available sales figures. There was a clear indication of increased sales figures during the last week of the month as seen below.
Fig
Predictive analytics
Predictive analytics involves the use of data to predict likely outcomes in the future based on historical data available. Predictive analytics has multiple functionalities of which improving operations curtains to People analytics helping organizations to function more efficiently. We have graphical images generated from Descriptive analytics in correlation with the issues the organization is facing, so using Predictive analytics we gain actionable insights from the Descriptive Analytics data available. The first issue is the high working hours in the organization in spite of fixed hours. The In and Out-Time from the Biometric attendance system are used to leverage on the employees working hours. The employees have an off between 2:00PM to 4:30PM IST o
basis for lunch and rest during the day on a daily basis. The
EMPLOYEE ATTRITION CHART
Finance
33%
EMPLOYEE CHURN AGE WISE
40 > 40
EMPLOYEE PERFORMANCE
7 16
0 5
Saturday Friday Thursday Wednesday Tuesday Monday
WEEKLY SALES MAP
Average Time(Hours)
0% 5% 10% 15% 20% 25% 30% 35%
Target% Achieved WOW
Logistic data was tabulated in the form of daily route map to get figures on Logistics team distance covered in a particular day and to get the average estimated time to cover the specified route so that better insights could be generated from e data. The below plot was generated by plotting average distance covered and the average time taken to complete the supply chain for the particular day of the week.
Fig. 5.
The sales figures were tabulated on a week over week basis with the available sales figures. There was a clear indication of increased sales figures during the last week of the month as
Fig. 6.
Predictive analytics involves the use of data to predict likely outcomes in the future based on historical data available. Predictive analytics has multiple functionalities of which improving operations curtains to People analytics helping function more efficiently. We have graphical images generated from Descriptive analytics in correlation with the issues the organization is facing, so using Predictive analytics we gain actionable insights from the Descriptive e first issue is the high working hours in the organization in spite of fixed hours. The In-time Time from the Biometric attendance system are used to leverage on the employees working hours. The employees have an off between 2:00PM to 4:30PM IST on an everyday basis for lunch and rest during the day on a daily basis. The
10 15 20
WEEKLY SALES MAP
Distance covered(km)
[image:4.595.54.418.41.523.2] [image:4.595.305.563.404.592.2]prediction made from the Descriptive study is that the Logistics team begins its operation very early on average around 8:15AM IST whereas the sales team starts almost 2 hours later at 10:30AM IST with the finance team starting work around 10AM. Based on the ONA analysis diagram, the heavy collaboration and dependency between the functioning of the Logistics and the Sales team was found and with the heavy difference in start times of both the Logistics team and Sales team there is clearly a drop in efficiency with the Sales team starting 2 hours later than the Logistics team. Also, there was high level of inward collaboration with Employee 5 as you can see from Fig 2(a) of the ONA analysis and the employee in Fig 2(b) had relatively lesser collaboration with employees from the Inward dependency ONA analysis. Bolder lines indicating more collaboration with the employee in Fig 2(a) compared to the employee in Fig 2(b) and no inward connections between few of the employees in Fig 2(b) confirmed the same. Employee 5 a Sales employee was found to be a crucial resource and generally the last one to leave office during closing hours and arrived late around 10:36AM average on a daily basis. The performance evaluation also showed the employee having moderate performance evaluation in spite of him being the best performing employee by word of mouth as there was heavy noise associated with his work (ie) he had to focus more on collaborating with multiple other employees in helping them complete their tasks. There was not significant decline in Performance evaluation of the employee but if the load wasn’t removed of the employee there would be decrease in efficiency of the employee which would affect the organization as he was one of the most crucial employees based on the percentage of sales figures he managed overall. Employee churn was a noticeable issue in the organization and from the Descriptive analytics it was found that churn was higher in the Logistics team Fig 3(a). An analytic study of operations in the Logistics team on a day to day basis (Fig 5) showed that the employees had to cover a distance of 15km average on a daily basis and the routes on few of the days especially Mondays, Wednesdays had heavy traffic or were congested routes as per Google Maps and hence the average speed covered was less on those particular routes. It is always essential to have less operational cost in Supply chain but less operational cost at the cost of attrition is not a healthy sign for an organization so required course of action is to be taken. The majority of the churn was found to be in the age category between 25-30 Fig 3(b) and it was found that there were plenty of available opportunities around for employees in the age group, result of which there was heavy churn.Staffing is crucial to every organization as on average half of the new fires fail to adapt to the organization, and employee attrition after career development is loss of resource to any organization. The performance evaluation table in (Fig 4) on underperforming employees can help identify attrition in employees and necessary action can be taken.
The other issue was increased sales during month endsresult of which efficiency in the organization was higher in the month end compared to the start of the month from (Fig 6). As clearly visible from the sales trend since the month end sales was high in the market resulting in a slump in sales figures in the beginning of the next month. A study on the work hours of Sales team during the last week of the month showed a 21% increase in working hours compared to the usual 8 hours the team spent at work. These un-continuous sales figures are not a healthy signal for any organization and hence need operational style changes in the employees to combat it. The organization
is able to achieve sales targets hence the issue is only with the breakage of sales week wise which is dependent on the employees as seen from the effort hours of Sales employees towards the end of the month.
Prescriptive analytics
The last stage is prescriptive analytics which deals with finding a fix to the issues dealt with in the Descriptive and the Predictive analytics stages. Its goal is to find the best possible solution or fix to the issue and may also provide one or more recommendations to business. The efficiency of Prescriptive analytics depends on the quality of data available and the effect of the Descriptive and Predictive Analytics. Below discussed are the recommendations from Prescriptive analytics for the specified issues in the organization. The high working hours issue can be resolved by primarily improvising the working hours of the logistics team for which the fix would involve Sales team starting earlier to ensure the organization closes early or re-scheduling the Logistic teams check-in timings with a one and a half hour postponement in daily routine to ensure hassle free collaboration between the sales and the operations team. Also increased dependency on Employee 5 is causing delay in operations as the particular employee is loaded with multi departmental tasks. Employee 8 who has spent a considerable amount of time in the organization and relatively underutilized can be mapped with the overloaded Employee 5 to improve efficiency of employees and the organization. Also cross divisional ties can be increased by increasing Team activities in Organization to improvise inter-departmental interaction which will help save time and increase efficiency by reducing work hours. Employee churn was the other major issue and age group 25-30 had very high attrition rates so during staffing extra effort needs to be spent on checking the candidates persistence and interview questions need to be more specific to check on the goals of the employee to find the duration of commitment he/she is looking for.
Also the churn rates were high in the logistics team so two options would be to reduce the work load on the team by hiring more employees or increase Internal mobility by moving performing members to other departments like sales to improvise Employee retention as attrition results in hiring and training costs, loss of critical domain knowledge and impacts customer relationship. So attrition can be reduced significantly using the above methods. Also from the list of underperforming employees generated in (Fig 4), Business needs to look more into the needs of the employees and consider why the employees are underperforming to their employees if their facing external issues or if their needs are not met as low Performance evaluation eventually results in Attrition. Sales bulk up in month ends was another key issue and it requires people analytics as if not for people analytics it would reflect on market conditions. Employees working high hours during the month end was the root cause of the issue and to find a fix, the Organization needs to take a dip in sales target for a month to reduce the hike in sales during the last weeks of the month to nullify the effect in the beginning of the next month. Sales employees need to be briefed about the process and it would be advisable to give incentives to employees who achieve targets on a Week over week basis. Employees working on a Week over Week approach to achieve targets need to be recognized and need to be mapped better to have a better positive impact. (Sujeet et al., Human Resource Predictive Analytics)
RESULTS AND FUTURE WORK
The predictive analytics results were shared with business for implementation and the results were observed over the next 2-3 weeks. The week over week Sales was at par with the Sales target split up and office hours had decreased significantly and the organization was closed early. Also talks were held with specified employees in a bid to decrease attrition and none of the employees had left during the month end. Growing volumes of data with the power of big data and easier to use software’s will make people analytics more feasible. With Live stream data processing around, real time data availability and the ability to process unstructured data makes People analytics all the more exciting. People analytics decisions made using Machine learning and deep learning can be smarter and accurate and help improve organizations and unleash the capabilities of People analytics with the power of data.
Conclusion
People are the most important asset of any organization and effective people analytics is an organizational challenge. The paper has dealt with the implementation of people analytics in small scale retail organization which had positive effects on the organization. With the natural increase in availability of data and the effects of People analytics every organization needs to work on building a people analytics capability. Also return on Investments can be high for People analytics if the Analyst and the quality of data available are good. So every organization should shift to a data first approach to enhance its analytic capabilities. (Rutger Johannink, The future of HR Analytics)
REFERENCES
Bodie, Matthew T. and Cherry, Miriam A. and McCormick, Marcia L. and Tang, Jintong, People analytics which deals
with helping organizations take better decisions on both staffing and managing current employees and is crucial as it can help either way in both the development/decline of the company, 2016.
Bodie, Matthew T. and Cherry, Miriam A. and McCormick, Marcia L. and Tang, Jintong March 1, 2016. The Law and Policy of People Analytics
Rosvall, M. and Bergstrom, C. T. 2008. Mapping change in large networks. Performance evaluation of each employee on a Week over week basis was done in a calculated manner to study their efforts on day-to-day activities and the functioning of the organization to their individual abilities without noise
Rutger Johannink, The future of HR Analytics: A Delphi method study, People are the most important asset of any organization and effective people analytics is an organizational challenge
Sujeet N. Mishra, Dev Raghvendra Lama, Yogesh Pal Human Resource Predictive Analytics (HRPA) For HR Management in Organizations, Predictive analytics involves the use of data to predict likely outcomes in the future based on historical data available
Wharton School of Business, University of Pennsylvania https://www.coursera.org/learn/wharton-people-analytics, A survey was conducted to find levels of cross dependence in employees were each employee had to rate his/her dependency/frequency of contact on the particular employee on a scale of 1 to 10 and similarly the other employees rate of dependency/frequency of contact on him/her.
Wolfgang Schlauch 1, Darko Obradovic 2 and Andreas Dengel 1,2, Organizational Social Network Analysis – Case study in a research facility, The employee interdependence (ie) Collaboration between employees is visualized as anOrganizational Network Analysis (ONA) diagram from the survey table data as both inward and outward