Transepithelial Cl− uptake across amphibian skin occurs through a highly specific, voltage-sensitive pathway which is evidently not localized to the Na+-transporting principal cells (for a review, see Katz and Nagel, 1994). As alternative routes, cellular transport across mitochondria-rich cells (MRCs) (Larsen and Rasmussen, 1985) or paracellular passage through specific sites in the tight junctions (TJs) (Nagel, 1989) have been suggested. Verification of either localization is not possible from macroscopic experiments, because the techniques used must be able to associate morphological structures with transport parameters. Hitherto, three methods have fulfilled this requirement: intravital morphometry (IVM); electron probe microanalysis (EMA) and the use of a voltage-sensitive vibrating probe (VP). Using IVM, volume changes of MRCs have been detected after activation of a transepithelial Cl−flux (Larsen et al. 1987). Since the time courses of changes in volume and Cl− conductance were closely related, these findings are considered to be evidence for conductive transport of Cl−via MRCs. The opposite view has been supported by investigations using EMA. With Br− replacing Cl− in the apical solution, the uptake of this marker ion was analysed under conditions of voltage-activated anion conductance in toad or frog skin. Although a fraction of the MRCs showed a finite uptake of Br−, the magnitude of marker uptake appeared to be insufficient to account for the activated transepithelial anion flow (Dörge et al. 1988; Nagel and Dörge, 1990). The data could not be confirmed in a recent
EMA study (Rick, 1994), which demonstrated rapid uptake of Br− in a sizeable proportion of MRCs and would be consistent with a transcellular route for voltage-activated Cl− movement. Nevertheless, all analyses using EMA indicate that the MRCs are a very heterogeneous population. A systematic analysis of a larger number of MRCs in individual tissues and under different experimental conditions therefore appears warranted. The vibrating voltage probe (Jaffe and Nuccitelli, 1974) could be suitable for such determinations. Unlike the other techniques, which derive information on Cl− fluxes indirectly from changes in volume or ion content, the VP can measure Cl− fluxes directly as the local electrical current density in the extracellular solution above a current source. Using this method, current peaks were localized above MRCs in frog and toad skin under voltage-activated conditions (Foskett and Ussing, 1986; Katz and Scheffey, 1986). Although these observations tend to corroborate the hypothesis of Cl−flux across MRCs, the significance of these data from a limited number of determinations is uncertain, since the conductance was highly variable among individual MRCs in both studies. Furthermore, local current activity could not be related to Cl−fluxes, because the transepithelial current density was not reported.
Recent improvements to the VP have made it possible to scan large areas of tissue under precise optical control and to obtain maps of local current density in relation to the corresponding morphological structures. In such analyses, carried out in conjunction with recordings of the
Printed in Great Britain © The Company of Biologists Limited 1998 JEB1608
A model simulation of the electrical field distribution for the voltage-activated Cl− current across amphibian skin has been carried out for two potential pathways, i.e. transcellularly, through the mitochondria-rich cells (MRCs), or paracellularly, across the tight junctions (TJs) between the outermost living cell layer. The calculations are based on the mean density of MRCs and the typical dimensions of stratum granulosum cells of amphibian skin. It is demonstrated that current flow across MRCs would be detectable by scanning with the vibrating voltage probe in the extracellular space above the epithelium, whereas
accurate representation of current flow through the TJs cannot be obtained using a probe of the present design. The experimental data indicate that field patterns corresponding to an MRC origin for the Cl−current are never observed. It is concluded that the voltage-activated Cl− conductance is localized to ion-selective structures in the paracellular pathway which may be regulated by the TJs.
Key words: model calculation, mitochondria-rich cell, amphibian, skin, Cl−conductance, toad, Bufo viridis.
Summary
Introduction
LOCALIZING TRANSEPITHELIAL CONDUCTIVE PATHWAYS USING A VIBRATING
VOLTAGE PROBE
PETRA SOMIESKI ANDWOLFRAM NAGEL*
Department of Physiology, University of Munich, Pettenkoferstraße 12, D-80336 Munich, Germany
*Author for correspondence (e-mail: [email protected])
transepithelial clamp current, an elevated current density was observed in the vicinity of fewer than 10 % of the microscopically identified MRCs (Nagel et al. 1998). On average, current peaks accounted for less than 20 % of the macroscopic clamp current, whereas more than 80 % of the current was not associated with MRCs but appeared to be homogeneously distributed over the tissue. This distribution could be a consequence of limited spatial resolution due to the finite distance between the tip of the vibrating probe and the tissue surface. To define the requirements for detecting the real origin of local current above the epithelial surface, a computer simulation of the field distribution was made for the passage of Cl− current along the two possible routes: the MRC pathway or the paracellular pathway. It will be shown that these two routes are associated with entirely different profiles of current distribution. A comparison of these profiles with experimental observations made using the VP allowed identification of the actual pathway for voltage-activated Cl− -transport.
Materials and methods Theoretical simulations
The VP measures voltage drops in the extracellular space above the epithelial surface. To estimate the resolution of the VP, the magnitude and local distribution of these electrical gradients are simulated in mathematical model analyses. The calculations are made according to the dimensions of the two possible pathways for voltage-activated Cl− current across amphibian skin: a transcellular route via MRCs (MRC model) or a paracellular pathway through TJs (TJ model). Furthermore, the influence of a current source of high local activity on this field distribution is assessed for both heights.
The analysis is based on the distribution of the electrical potential of individual point sources due to current flow between the sources and a distant uniform current sink. The potential distribution PPS for a single source is given
by:
where I is the total current from the source and ρdenotes and the resistivity of the extracellular solution. The parameters x and y reflect the axes in the plane of the source, and z is the height above the source. Differentiation of equation 1 with respect to z and multiplication by (−1) gives the distribution of the electrical field, EPS, in the z-direction:
The field distribution for multiple current sources as given by the above models is developed from summation of the
electrical potential of each source, differentiation with respect to z of the resulting potential and multiplication by (−1).
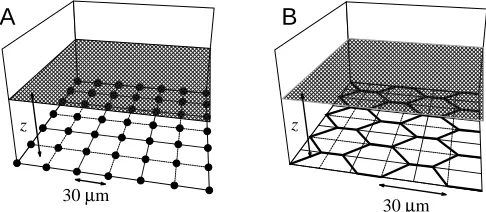
In the MRC model, Cl− movement is restricted to a transcellular pathway through the MRCs, assuming identical current flow across all cells (Fig. 1A). Principal cells and tight junctions are considered as a perfectly insulating plane in which MRCs are distributed as point sources in a regular two-dimensional grid with 30µm distance (d) between individual sources. This spacing gives a density of 1.3×10⁵MRCs cm−2, a value comparable with the density of
MRCs in toad skin (Willumsen and Larsen, 1986; Katz and Gabbay, 1995; Nagel et al. 1998). The apical pole of an MRC has a mean diameter of 5µm and is thus theoretically not properly represented by a point source. For this reason, the field distribution was also modelled assuming that MRCs are disc-like sources with a diameter of 5µm and a homogeneously distributed conductivity. Since the resulting field distribution 10µm above the surface was indistinguishable from that for point sources, the assumption of point sources was regarded as justified. The distribution of the electrical field in the z direction EzMRC(x,y,z) for this case is given by:
where d is distance of the sources and N is number of sources in the x/y direction. i and k represent the positions of the sources in the x and y directions, respectively.
In the TJ model, the paracellular circumference of all principal cells is considered to be the site of Cl−conductance under activated conditions (Fig. 1B). According to the dimensions of principal cells estimated from silver-stained amphibian skins (Budtz et al. 1995; Whitear, 1975; Katz et al. 1985; P. Somieski and W. Nagel, unpublished data), the pathway is simulated by regular hexagons with a border length (d) of 15µm. The MRCs are ignored. Equal conductance is assumed for point sources at a narrow spacing along the
(3) EzMRC(x,y,z) =
Iρ
2π
冱
N
i=1
冱
Nk=1
+ z
(id−0.5d ± x)2+ (kd−0.5d ± y)2+ z2
冪
× 3
(2) EPS(x,y,z) =
+ z Iρ
2π ×
冪
(x2+ y2+ z2)3 .(1) PPS(x,y,z) = Iρ 1
2π ×
冪
x2+ y2+ z2,
30 µm
z
30 µm
z
[image:2.609.314.557.74.180.2]A
B
2491
Vibrating probe analysis of Cl
−current
where d is border length of each hexagon; t, a, c and s, n, e represent the positions of the line-source segments (building the honeycomb structure) in the x and y directions, respectively and b is the variable of integration.
The influence of a conductive site of high local current is modelled by the insertion of a point source with a 70-fold higher current density than that of one MRC or the border of one hexagon. This source is placed at a distance allowing its influence on the field distribution to be observed over at least five sources of the regular array.
The calculations are performed for a grid with 40×40 point sources for the MRC model or with 140 hexagons in the x- and y-directions for the TJ model. These sizes result in a constant level of current in the centre of an area of 150µm×150µm and avoid the decay of current at the edges. Since the vibrating probe was usually scanned with a stepping width of 2µm, the field distribution is also calculated with a spacing of 2µm. Theoretical calculations are normalized for comparison with experimental data.
Experimental procedures
A two-dimensional vibrating probe system based on the design of Scheffey (1988) (SVM-200, Applicable Electronics, Sandwich, MA, USA) was used to measure the current distribution above the tissue after voltage-clamping the epithelium. The vibration in two dimensions enabled a calculation of local current vectors, which show the current density and the angle of current flow between the tissue and the current sink. To correlate field density with histological structures, the signal of the axis perpendicular to the tissue surface (z-axis) was used. The other axes served for validation of undisturbed recordings and for quantification of the total current in each tissue area. Techniques for the preparation of vibrating electrodes and tissue analysis have been described elsewhere (Nagel et al. 1998). In the present study, platinum–iridium electrodes with parylen insulation and a nominal tip diameter of 1µm (Micro Probe, Gaithersburg, MA,
USA) were used. These electrodes, which actually had tip diameters of 4–6µm, were electroplated with platinum and then had effective tip diameters of between 8 and 10µm. The electrodes were vibrated with amplitudes of 2–3µm instead of the usual amplitude of 10µm to permit advancement of the tip closer to the tissue. This increased the inherent noise of the system, but the scatter of recorded data was reduced by making floating averages of adjacent determinations and by subsequent acquisition of two scans at identical locations. Observations were accepted only when the patterns were identical in the two consecutive scans. Electrodes were calibrated in the experimental chamber, and the accuracy of current determination by the probe was checked frequently. This was achieved by comparing the probe current with the transepithelial clamp current while the probe was positioned 200µm above the tissue. At this position, current distribution is homogeneous. The local distribution of current density was recorded by automatically scanning selected tissue areas with the VP at the closest possible distance (less than 16µm) between the tip of the electrode and the active surface of the epithelium. The stepping size of these scans was 1–2µm. An upright microscope with a 63× water-immersion differential interference contrast (DIC) objective (Axioskop FS, Zeiss, Oberkochen, Germany) and illumination with narrow-bandwidth light (510±5 nm) was used to ensure a high optical resolution; video images were collected via a low-light CCD camera (Burle TC355) and stored in the computer. The vibrating probe and chamber were mounted on a motorised three-dimensional micro-stepping manipulator system (CMC-4, Applicable Electronics, Sandwich, MA, USA). A commercial software package (ASET, Science Wares, East Falmouth, MA. USA) was used to control the scanning and for data acquisition,
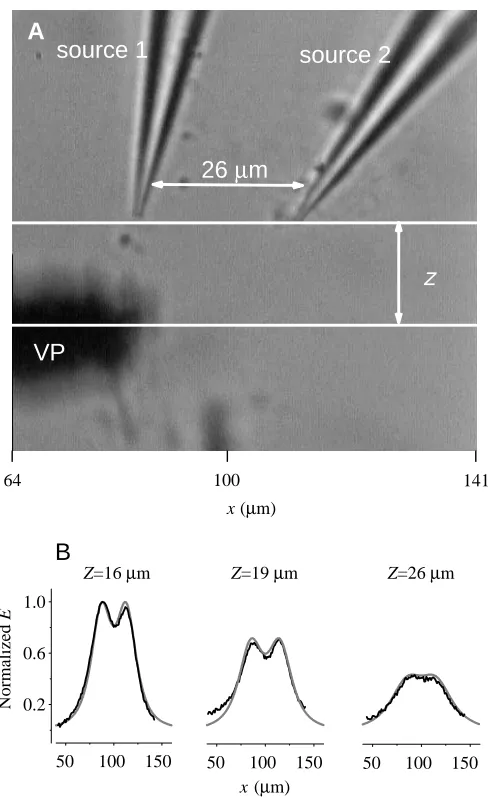
To verify the accuracy and the spatial resolution of the probe, the electrical field at different heights (Z) was recorded above two current point sources (glass electrodes), positioned 26µm apart (Fig. 2A). The normalized results of line scans are (4) ETJz (x,y,z) =
冱
7
t=−7
冱
4s=−4
+ z
冪
b 2
x−d(3s ± 1) ± + y− √–3 dt ± + z2
2 b 2 2 3 ⌠ ⌡ d 1000 d 1000 d −
冱
7 a=−8冱
4
n=−4
+ z
冪
[x−b−3nd]2+ y− √3–d + a + z2
1 2 2 3 ⌠ ⌡ d 1000 + d 2 − d 1000 −d 2 +
冱
3 c=−4冱
7
e=−7
+ z
冪
x−3d c + −1 b + [y− √3–ed]2+ z2shown for three different heights (16, 19 and 26µm; Fig. 2B) above the centre of these sources. Experimental observations are represented by solid lines and compare favourably with the calculated electrical fields of these sources (dotted lines). Interestingly, the relatively large diameter of the VP (22µm including the vibration) had little influence on the accuracy of the measurement.
Animals and solutions
The investigations complied with German state and federal regulations governing animal experimentation. Isolated abdominal skin from Bufo viridis (imported from Israel with permission from the Natural Reserve Authorities of Israel and the German Federal Office for Conservation/Bundesamt für Naturschutz) was prepared as described by Nagel et al. (1998). Ringer’s solution had the following composition (in mmol l−1):
Na+, 110; K+, 2.5; Ca2+, 1; Mg2+, 1; Cl−, 114; Hepes, 3.5; the
pH was 7.5 after equilibration with air.
Results The MRC model
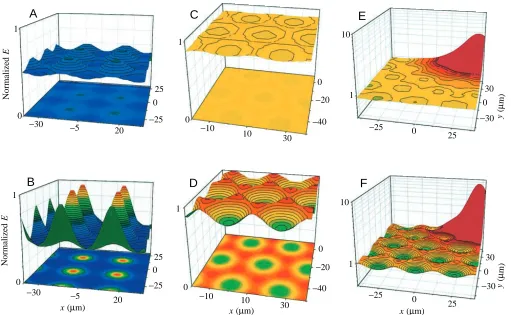
The distribution of the electrical field above point sources at a spacing of 30µm is shown in Fig. 3A,B for two heights above the plane of the actual tissue surface. To facilitate comparisons between the two conditions, field densities are normalised to the magnitude of the peaks at the smaller height. As shown in Fig. 3A at a distance of 16µm, the variation in local field density between peak maxima and valley minima is approximately 25 %. Closer to the surface (10µm, Fig. 3B), differences between the maxima and minima of the field density increase to 62 %. The half-width of the peaks does not noticeably increase with height Z because it is determined by the field minima, which also increased with Z.
The TJ model
In contrast to model calculations using point sources, honeycomb-like structures with linear source structures yields a totally different pattern for the electrical field. In addition, the variation in the field density at corresponding heights above the surface is considerably smaller than with the point source model. Fig. 3C shows that the field variation was less than 5 % at a height of 16µm above the tissue. Approaching the source plane more closely (10µm, Fig. 3D) increased the variation to 21 % and revealed the structure of the conductive sites. It should be noted that the field density shows additional variation between linear junctional segments and at the junctions of three elements (cells). At 10µm above the surface, the field density at these corners was 4 % greater than over the linear parts.
The TJ model with a large conductive site
The influence of a single large current source of unspecified origin on the field distribution in the TJ model is shown in Fig. 3E,F. The relationship between peak current and local current over a honeycomb-like structure was adapted from previous observations from our laboratory (Nagel et al. 1998). At a height of 16µm, the single peak is detectable on top of the honeycomb structure, which shows less than 5 % variation in field density, as in Fig. 3C. Owing to the lateral influence of the point source, the pattern of the honeycomb is overlayed and is obscured for a diameter of approximately 50µm around the source. Closer to the plane of current sources, as shown in Fig. 3F, the influence of a large current peak on the pattern of the honeycomb is considerably reduced in diameter, extending no further than approximately two cell diameters.
Experimental observations
The size of the platinum-plated Pt/Ir electrodes allowed the tip to be positioned 13–15µm above the actual surface of the tissue (including the thickness of the stratum corneum). With a vibration amplitude of 2–3µm, the inherent system noise was approximately ±3 % of the actual value of the local current 50 100 150
0.2 0.6 1.0
50 100 150 50 100 150
Z=16 µm Z=19 µm Z=26 µm
z
26
µ
m
VP
source 1
source 2
x (µm)
Normalized
E
64 100 141
x (µm)
A
B
[image:4.609.47.291.70.469.2]2493
Vibrating probe analysis of Cl
−current
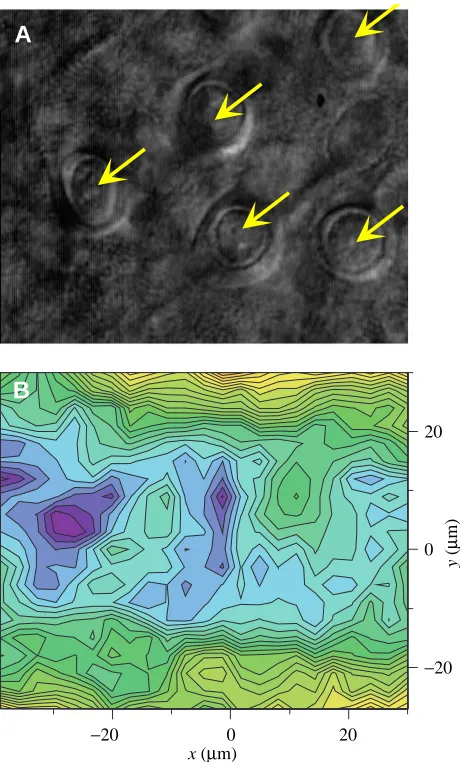
density. With this accuracy, the probe should be able to detect the real distribution of the electrical field originating from point sources with the spacing of MRCs. Using scan parameters for high optical and spatial VP resolution, small areas were scanned in six different tissue samples. Fig. 4 shows a typical result. Five MRCs are clearly visible in the tissue area. The VP scan 14µm above the actual surface of the epithelium did not show any point of elevated current density that could be associated with the location of an MRC. In contrast, the current density was rather lower than average above most of the MRCs. Similar observations, which are in disagreement with the MRC model, were made in all cases, irrespective of whether the density of MRCs in the scanned fields was high or low.
Discussion
For ion transport across amphibian skin, four morphologically different pathways, directed towards the apical surface, must be considered: (i) principal cells, (ii) MRCs, (iii) glands, and (iv) paracellular routes via TJs between cells in the apical cell layer. Glands, which generate an outward flow of Cl− after stimulation with β-adrenoceptor agonists (Thompson and Mills, 1981), are usually absent in isolated epithelial preparations and, if present, are, together
with the remaining glandular ducts, easily visible in the video images. Since principal cells can also be excluded (Katz and Nagel, 1994), only two possible routes remain for transepithelial conductive Cl− movement: MRCs and the paracellular spaces around the outermost living cell layer. Paracellular current is often associated with ion flow through leak sites in otherwise tightly sealed TJs, for which ion specificity is considered to be poor. The tightness of the paracellular route in amphibian skin has been deduced from the observation that Cl−fluxes across amphibian skin are very low in the absence of apical Cl−(Bruus et al. 1976), suggesting that the voltage-activated Cl−current occurs transcellularly via MRCs (Larsen and Rasmussen, 1985; Larsen et al. 1987). More recent work has shown that TJs are highly regulated structures that may possess a far more specific permeability than initially envisaged (for reviews, see Anderson and Van Itallie, 1995; Denker and Nigam, 1998). At present, paracellular permeability is considered in terms of preferential selectivity for cations or anions in leaky epithelia, but it must be established whether TJs in tighter epithelia exhibit a higher degree of ion specificity. Furthermore, the intracellular events leading to opening or closure of TJs are not completely understood, and it appears possible that they include voltage-sensitive reactions which reduce the sealing of TJs and expose
A
B
C
D
E
F
1
1 10
0
0
25 0 30
0
0
1
Normalized
E
−30 −25 −10 −25 −30
−20
−40
−5 20
1
0
1
0 0
0
−20 25
Normalized
E
−30 −5 −25 −40
20
x (µm) x (µm) x (µm)
−10 10
30
10 0
y( µm)
30 25
10
30
0 1
−25 −
30 0
y( µm)
[image:5.609.56.567.72.387.2]25
the ion-selective conductive pore in the paracellular cleft, thus activating the Cl−conductance.
Our present experimental data from area scans with the VP cannot verify this hypothesis. As shown by the field distribution according to the TJ model, the variations inherent in the pattern of the current density distribution cannot at present be resolved by the VP. Because of the dimensions of the available probes and the presence of a cornified layer above the outermost living cell layer, the VP cannot be brought closer than 13µm to the actual surface of the tissue. At this height, the field variation is less than 10 %. Compared with the scatter of the VP data, which amounts to ±3 %, it is evident that the detection of the field distribution due to current flow through TJs between the principal cells would be questionable. Nevertheless, the calculations show that a slightly closer approach of the VP to the tissue surface could
resolve the putative pattern that would have to be postulated in the absence of other pathways. Although the cornified layer cannot be removed enzymatically, moulting of the tissue may occasionally allow closer access to the actual apical surface and simultaneously remove the possible shielding effects of a resistive layer.
A different situation exists with regard to the passage of Cl− current through the MRCs. The field simulation according to the MRC model shows that the local current distribution would be easily detected with the VP scanning at a height of 16µm above the tissue. At this height, the field variation is more than 20 % and thus considerably larger than the detection limit of the VP. At the presently possible height of 13µm above the epithelium, the variation increases to 40 % between peak and valley. Experimentally, the local current density varied by less than 15 % and, most importantly, the variations were not coincident with the sites of MRCs. Accordingly, the MRCs cannot be the pathway for voltage-activated Cl− fluxes. This conclusion is not invalidated by previous observations that local peaks with high Cl−current density could be detected in the vicinity of MRCs (Foskett and Ussing, 1986; Katz and Scheffey, 1986; Nagel et al. 1998). The origin of these peaks, which account for approximately 15 % of the transepithelial Cl−current, is not understood at present.
In conclusion, mitochondria-rich cells are not the site of voltage-activated Cl− conductance across toad skin. It is postulated that current flow occurs across ion-selective structures in the paracellular pathway which may be regulated by the tight junctions.
We are grateful to Dr John Davis for careful improvement to the manuscript and to Dr Florian Kolb for valuable suggestions during the course of the work. This study was supported by grants from the Deutsche Forschungsgemeinschaft.
References
ANDERSON, J. M. ANDVANITALLIE, C. M. (1995). Tight junctions and the molecular basis for regulation of paracellular permeability. Am.
J. Physiol. 269, G467–G475.
BRUUS, K., KRISTENSEN, P. ANDLARSEN, E. H. (1976). Pathways for
chloride and sodium transport across toad skin. Acta physiol. scand. 97, 31–47.
BUDTZ, P. E., CHRISTOFFERSEN, C., JOHANSEN, J. S., SPIES, I. AND
WILLUMSEN, N. J. (1995). Tissue kinetics, ion transport and
recruitment of mitochondria-rich cells in the skin of the toad (Bufo
bufo) in response to exposure to distilled water. Cell Tissue Res. 280, 65–75.
DENKER, B. M. ANDNIGAM, S. K. (1998). Molecular structure and
assembly of tight junctions. Am. J. Physiol. 274, F1–F9.
DÖRGE, A., RICK, R., BECK, F. X. ANDNAGEL, W. (1988). Uptake of
Br in mitochondria-rich and principal cells of toad skin epithelium.
Pflügers Arch. 412, 305–313.
FOSKETT, J. K. ANDUSSING, H. H. (1986). Localization of chloride conductance to mitochondria-rich cells in frog skin epithelium. J.
Membr. Biol. 91, 251–258.
−20 0 20
−20 0 20
x (µm)
y (
µ
m)
A
[image:6.609.53.283.70.451.2]B
2495
Vibrating probe analysis of Cl
−current
JAFFE, L. F. ANDNUCCITELLI, R. (1974). An ultrasensitive vibrating probe for measuring steady extracellular currents. J. Cell Biol. 63, 614–628.
KATZ, U. AND GABBAY, S. (1995). Dynamics and density of
mitochondria-rich cells in toad skin epithelium. Biol. Cell 85, 185–190.
KATZ, U. ANDNAGEL, W. (1994). Biophysics of ion transport across amphibian skin. In Amphibian Biology, vol. II, The Integument (ed. H. Heatwole and G. T. Barthalmus), pp. 100–121. Chipping Norton: Surrey Beatty and Sons.
KATZ, U. ANDSCHEFFEY, C. (1986). The voltage-dependent chloride current conductance of toad skin is localized to mitochondria-rich cells. Biochim. biophys. Acta 861, 480–482.
KATZ, U., VANDRIESSCHE, W. ANDSCHEFFEY, C. (1985). The role of
mitochondria-rich cells in the chloride current conductance across toad skins. Biol. Cell 55, 245–250.
LARSEN, E. H. ANDRASMUSSEN, B. E. (1985). A mathematical model of amphibian skin epithelium with two types of transporting cellular units. Pflügers Arch. 405, S50–S58.
LARSEN, E. H., USSING, H. H. AND SPRING, K. R. (1987). Ion
transport by mitochondria-rich cells in toad skin. J. Membr. Biol. 99, 25–40.
NAGEL, W. (1989). Chloride conductance of amphibian skin. Localization to paracellular pathways. Miner. Electrol. Metabol. 15, 163–170.
NAGEL, W. ANDDÖRGE, A. (1990). Analysis of anion conductance in
frog skin. Pflügers Arch. 416, 53–61.
NAGEL, W., SOMIESKI, P. ANDSHIPLEY, A. M. (1998).
Mitochondria-rich cells and voltage-activated chloride current in toad skin epithelium. J. Membr. Biol. 161, 131–140.
RICK, R. (1994). Short-term bromide uptake in skins of Rana pipiens.
J. Membr. Biol. 138, 171–179.
SCHEFFEY, C. (1988). Two approaches to construction of vibrating probes for electrical current measurement in solution. Rev. scient.
Instrum. 59, 787–792.
THOMPSON, I. G. AND MILLS, J. W. (1981). Isoproterenol-induced
current changes in glands of frog skin. Am. J. Physiol. 244, C250–C257.
WHITEAR, M. (1975). Flask cells and epidermal dynamics in frog skin.
J. Zool., Lond. 175, 107–149.