Master Thesis
Threat Detection Systems
Author:
Frank van Vliet
s0002720
Graduation committee:
dr. D. Bolzoni
prof. dr. P.H. Hartel
dr. F. Kargl
Contents
Contents i
Abstract 1
1 Introduction 3
1.1 Scenario 1: risk management . . . 5
1.2 Scenario 2: network security monitoring . . . 6
1.3 Problem definition . . . 7
1.4 Overview . . . 8
2 Risk management 9 2.1 Standards . . . 11
2.2 Literature . . . 14
2.3 TDS in Risk Management . . . 16
3 Network Security 19 3.1 Standards . . . 19
3.2 Literature . . . 20
3.3 TDS in Network Security . . . 22
4 Threat Detection System 25 4.1 Architecture . . . 26
4.2 Intrusion Detection System . . . 28
4.3 Threat classifier . . . 34
4.4 Threat profiler . . . 42
5 Benchmark and results 51 5.1 Testing methodology . . . 52
5.2 Real network experiment . . . 53
5.3 Hacker experiment . . . 60
5.4 Discussion . . . 68
A Attack and Penetration test documentation 77
A.1 Description . . . 77
A.2 Result . . . 77
A.3 Vulnerability Score . . . 78
A.4 Solution . . . 80
B Snort configuration 81
C Checklist comparison 85
D First version of the signatures for the Basic Web
Application Scan Checklist 89
E First version of the signatures for the Advanced Web
Application Scan Checklist 93
F Final version of the signatures for the basic web
ap-plication scan checklist 97
G Final version of the signatures for the advanced web
application scan checklist 101
General References 105
Web References 109
Abstract
Chapter
1
Introduction
“If you think technology can solve your security problems, then you don’t understand the problems and you don’t
under-stand the technology” —Bruce Schneier
Traditional Intrusion Detection Systems focus on detecting attack instances on a computer network. The work presented in this thesis is different, since the attack instances are used to construct a profile of the actual attacker. An attacker is named a “threat” and can be a human being or an au-tonomous computer program. The system is therefore named a Threat Detection System (TDS) and will improve the security of a computer net-work.
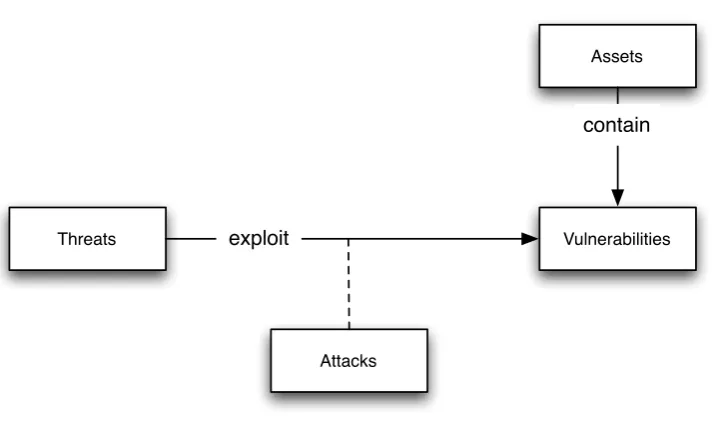
Security is often defined as a combination of confidentiality, integrity, and availability of assets [36]. In the old world of paper and snail-mail, security meant that assets (for example some piece of information) must be kept secret, we must be able to trust the integrity of that piece of information, and the asset should be available to legitimate users when they need it. In the new world based largely on the Internet, security is still important for the same reasons.
Assets
Vulnerabilities Threats
Attacks
exploit
[image:8.595.121.479.110.324.2]contain
Figure 1.1: Definition of threat, exploit, attack, vulnerability and asset
A computer system is secure when threats cannot exploit the vulnerabilities of that system. There are two approaches towards secure computer systems [2]: The first approach consists of removing the vulnerabilities of the system or adding defenses that makes the exploitation of them harder. The time and skill required for a threat to compromise the system increases, and the threat will (hopefully) stop attacking voluntarily. It is impossible to locate and eliminate all vulnerabilities of a system, therefore using only this first approach is not the best way to secure the system [2]. The second approach consists of the detection of threats while they are attacking the system and stopping them before they are successful in compromising it, for example by removing their access to the system and involving the police. A combination of the two approaches is best, since reacting to threats takes time that can be obtained by eliminating the vulnerabilities [2].
The motivation for this master thesis can be illustrated with two scenarios where a security expert is implementing the two described approaches to computer security and is having problems performing her task effectively. These problems, and the solution to these problems, are the basis for the problem description of this thesis. The first scenario features a security expert who helps a client by identifying vulnerabilities of their network, so they can be eliminated. In the second scenario, the security expert is tasked with securing a network by monitoring all network communications to find threats. The expert faces different problems in each scenario, but can benefit from the same solution that will be described in section 1.3.
1.1
Scenario 1: risk management
In the first scenario, a security expert assesses the security of a website (a web shop selling products) for a client by performing an attack and penetration test. This test consists of both automated and manual testing and results in a list of vulnerabilities which require the attention of the client.
For this scenario, only one vulnerability is discussed: a SQL injection vul-nerability. The vulnerability allows threats to manipulate the queries which are executed on the database of the website, enabling the threat to read all the information in the database. Since the database contains all client and order information, this attack would compromise the confidentiality of this information. The full documentation of this vulnerability, as reported by the security company Pine Digital Security, is included in Appendix A. Each vulnerability poses a risk to the client, who has to decide whether to accept the risk or mitigate it by solving the problem, implementing controls or using insurance. This is the essence of risk management [31]. In the world of commerce, such decisions are ideally based on money; if the risk is expressed in an expected loss dollar-figure, it can be compared to the cost of solving the problem and other mitigation solutions. To calculate the expected loss, the likelihood (what is the chance of the risk happening) is multiplied by the impact (what is the cost if the risk happens) [31]. However, both the likelihood and the impact are hard to quantify.
Determining the impact of the risk (a dollar amount of loss) is a question for the financing department of the client and should not be the responsibility of the security expert. The likelihood however, is something that is asked of a security expert to calculate. Currently, calculating the likelihood is not possible as there are no clear data or metrics on this [31]. Hence, the likelihood is often defined using categories of “high”, “medium” and “low” [34], resulting in an approximation of each risk. In this scenario, the likelihood is categorized as “high”, since the commonly used NIST standard defines this as: “The threat-source is highly motivated and sufficiently capable, and controls to prevent the vulnerability from being exercised are ineffective” [34]. This definition is inaccurate, since it is not taking into account any quantitative information, for example, whether threats are trying to compromise the website at all.
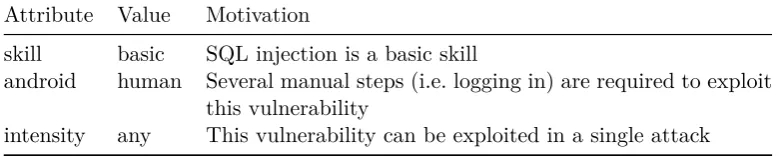
threat that is able to exploit this vulnerability. This profile could include properties like the skill level, the intensity of the attacks, and so forth. Security experts can have a consensus on how these threat profiles are cre-ated for each vulnerability, so this is not guesswork. In this scenario, the threat-profile associated with the SQL injection vulnerability could contain the information as presented in Table 1.1.
Table 1.1: Threat-profile for the SQL Injection vulnerability
Attribute Value Motivation
skill basic SQL injection is a basic skill
android human Several manual steps (i.e. logging in) are required to exploit this vulnerability
intensity any This vulnerability can be exploited in a single attack
Second, a history of threats active on the system is referenced to ascertain how often a threat capable of exploiting the vulnerability is active on the network. In this example, it could be determined that there are (for exam-ple) five threats in the past week capable of exploiting this vulnerability. This does not provide an exact likelihood of the risk, but provides a quan-titative basis for companies to prioritize risks that go beyond the “high”, “medium” and “low” categories used by current standards.
1.2
Scenario 2: network security
monitoring
In the second scenario, the security expert is tasked with monitoring a net-work of computers for threats. The security expert has two options. First, she could try to read all traffic passing through the network and act when she identifies packets that belong to an attack. It is infeasible to read all packets on any active network. It is possible to sample the packets into flows or streams and use that information to identify suspicious behaviors [32], but this does not provide the same level of details for analysis. The second option of the security expert is to automate the reading of all net-work traffic using an Intrusion Detection System (IDS). These systems (try to) automatically detect intrusions and inform the security expert about them.
In both cases, the expert is wasting much of her time looking at information that is probably not interesting. Many attacks on the network consist of automated (worm) attacks and script kiddie attacks using a downloadable
tool to exploit well-known security problems [56]. These attacks have no effect on the security of a network when security patches are timely installed on each system. A large team of analysts is required to evaluate all attacks on a network.
To help the security expert focus only on the important information, it would be helpful if the information were somehow classified. The expert would then start by looking at the most important events, zoom in on them and review the events that are related. She would spend no time researching uninteresting worm-attacks and could focus on the few real attacks the network is facing.
To make a better distinction between important attacks and uninteresting ones, one should not only classify the attack, but also the threat performing the attack. There are several types of threats, ranging from professional hackers with many resources to hobbyists who are hacking in their spare time to computer worms without any intelligence. If the network is patched and most of the vulnerabilities are eliminated, the security expert could create a profile of threats that would still be able to compromise the security of the network. If a system would allow the security expert to focus on the threats that match such a threat profile, the expert can monitor the network effectively.
1.3
Problem definition
Both scenarios have illustrated the need for information about threats on a network and their profiles. This master thesis will therefore work on the following problem definition:
Design a system to detect and profile threats on a computer net-work to improve risk management and netnet-work security moni-toring.
The problem definition contains the following sub questions:
1. How can a system detecting and profiling threats improve risk man-agement?
2. How can a system detecting and profiling threats improve network security monitoring?
4. How to design a system that is capable of profiling threats?
The methodology for designing such a system consists of the following steps:
1. Research risk management to verify if the likelihood prediction of a vulnerability is a problem and if current research is capable of solving this problem.
2. Research network security monitoring to verify if network security monitoring can be improved by adding the concepts of threats and threat profiles and if current research is already presenting solutions for this.
3. Design the architecture of a system that is capable of solving the problems as defined in the previous two steps. The architecture will consist of at least two components, one for the detection of threats and one for profiling them.
4. Implement a system that meets the problem definition using the de-fined architecture. The choices made in the design of the system must be documented and where possible, are configurable depending on the specific needs of a security expert performing the risk man-agement or network security monitoring. The system will include an example set of algorithms to profile specific properties of threats. These algorithms are accompanied with guidance on how to interpret the results of these algorithms and how security experts can use them for risk assessment and network security monitoring.
5. Test the system in a real network with real threats following a prede-fined testing methodology. This test verifies if risk management and network security monitoring benefit from the system.
1.4
Overview
This thesis begins with a discussion on risk management (chapter 2) and Network Security (chapter 3), providing the context of the presented re-search. Then, the architecture (section 4.1) and implementation (chapter 4) of the system are presented. These chapters describe how and why the sys-tem is created. To verify the syssys-tem works and the problem stasys-tement can be answered affirmatively, the system is tested in chapter 5 including the test methodology and the actual results of the tests. This is followed by a conclusion and recommendations for future research in chapter 6.
Chapter
2
Risk management
This chapter first describes the general methods for risk management that could be used for computer security, followed by a description of a standard for risk management that is used in the professional world. These descrip-tions provide a context and identify problems in risk management as it is currently used. Then, the current state of the art in academic research on these problems is described, followed by an answer to the question “How can a system improve risk management?”.
The most basic form of risk management can be derived from the ruling of Judge Learning Hand:
Since there are occasions when every vessel will break from her moorings, and since, if she does, she becomes a menace to those about her; the owner’s duty, as in other similar situations, to provide against resulting injuries is a function of three variables: (1) The probability that she will break away; (2) the gravity of the resulting injury, if she does; (3) the burden of adequate precautions. Possibly it serves to bring this notion into relief to state it in algebraic terms: if the probability be called P; the injury, L; and the burden, B; liability depends upon whether B is less than L multiplied by P: i.e., whether B < PL.[22]
In this basic form, the estimated loss is calculated and compared to the cost of solving the problem. When the solution is cheaper than the expected loss, the solution is implemented, else the risk is accepted.
The tradition methods for risk management used a similar formula to calcu-late the Annualized Loss Expectancy (ALE) (Equation 2.1). This formula considers the impact of each harmful outcome ({I1, ..., In}) and the
of this method is that it suffers from a lack of actual data to estimate values for impact and likelihood [31]. In the mid-1980s, a framework for computer security risk management emerged from this model. To calcu-late the risk, each combination of the assets, security concerns, threats, and vulnerabilities must be evaluated. This is a task of infeasible proportions [31].
ALE =
n
∑
i=1
(IiFi) (2.1)
Based on this Annualized Loss Expectancy (ALE) method of risk man-agement, different methods were developed to manage risks [26]. The first method is the Integrated Business Risk Management model. This model al-lows security risks to be managed like other business risks [31]. These risks are identified and then managed using financial (contracts and insurance) or strategic (avoidance, control, cooperation, imitation, and flexibility) [26] management. A problem with this method is that it simplifies the security risks, because they are handled the same way as other business risks and therefore focus on bottom-line business impact instead of the computer security interactions [31].
The second method consists of the valuation-driven methodologies. These methodologies simply ignore the likelihood and only focus on the value of each asset. This greatly simplifies the risk management, but results in either over-securing or under-securing since these methods have no notion of the likelihood of each problem [31].
The third method consists of the scenario analysis approaches. These ap-proaches consist of the analysis of possible scenario’s by which computer security is compromised [31]. An example of this is the execution of an attack and penetration test, where the system is compromised on purpose to detect the vulnerabilities and their associated scenario’s. Since there is no guarantee that all scenario’s are found, this leads to a false sense of security [31].
The final method consists of using best practices. These practices are ofter the industry standard of doing things as well as possible. They consist of design and implementation requirements that are already tailored to the possible threats and vulnerabilities of this industry. A problem with this method is the uncoupling of best practices from the actual risks involved, where best practices are implemented because they are best practices with-out regard to the actual risks involved. [31].
Currently, performing a perfectly accurate risk management for computer security is still impossible; the traditional method, based on the Annual-ized Loss Expectancy, requires an assessment of infeasible proportions and
newer methods that require less work fail to accurately capture all impor-tant aspects of risk management [31]. Furthermore, all methods suffer from a lack of actual data to estimate values for impact and likelihood [31]. If the methods could use actual data to estimate impact or likelihood, then risk management could be improved [31]. To identify how the lack of actual data is currently affecting risk management as it is used in the professional world, the following section will describe a commonly used standard for risk management in information technology systems.
2.1
Standards
In the professional world, where risk management is used in real situations, a few standards are used. First, there is the Risk Management Guide for Information Technologies Systems [34] by the National Institute of Stan-dards and Technology. This guide contains a process for risk assessment and for risk management. Second, there is a standard by the International Organization for Standard named “ISO27005: Information security risk management”. For this research, the NIST standard is used as it is open and specifically focusses on risks.
In 2002, the National Institute of Standards and Technology (NIST) re-leased the Risk Management Guide for Information Technology Systems [34]. This guide implements risk management in two steps. First, a risk assessment is executed by identifying systems, threats, vulnerabilities, ex-isting controls, likelihood, impact, and finally determining the risk and recommending further controls. Secondly, a risk mitigation process is ex-ecuted to accept, avoid, limit, plan for, solve or transfer each risk. This method for risk management could be an implementation of the Integrated Business Risk Management model earlier discussed, as the standard states:
Because the elimination of all risk is usually impractical or close to impossible, it is the responsibility of senior management and functional and business managers to use the least-cost approach and implement the most suitable controls to decrease mission risk to an acceptable level, with minimal adverse impact on the organization’s resources and mission.[34]
Note that this model uses only qualitative values (“high”, “medium” or “low”). Risk assessment by the NIST standard consists of nine steps, which are summarized as following:
missions, and the persons who support and use it. This also includes the data that are stored within the system and their requirements on availability, integrity, and sensitivity.
Step 2: Threat Identification List the possible threats (named threat-sources in this standard) of the system (hackers, criminals, terrorists, spies, employees). For each threat, the motivation (challenge, de-struction, monetary gain, revenge, competitive advantage) and the possible actions (hacking, social engineering, bribing, bombing) are identified.
Step 3: Vulnerability Identification Identify all vulnerabilities in the system. These vulnerabilities can be gathered using automated scans, penetration testing and auditing. Each vulnerability should be matched to the actions of threats.
Step 4: Control Analysis Identify all controls implemented in the sys-tem or organization to minimize or eliminate the likelihood or impact of vulnerabilities. Possible controls are access control, intrusion de-tection systems and encryption.
Step 5: Likelihood Determination Estimate the likelihood of exploita-tion for each vulnerability. This is based on the motivaexploita-tion and ca-pability of the threats and the existence and effectiveness of the im-plemented controls. The likelihood is a qualitative value with three options:
• High, the threat is highly motivated and sufficiently capable and controls to prevent the exploitation of this vulnerability do not exist or are ineffective.
• Medium, the threat is motivated and capable, but controls are implemented to hinder successful exploitation of the vulnerabil-ity.
• Low, the threat lacks motivation or capability, or controls are implemented to prevent or significantly hinder the vulnerability from being exploited.
Step 6: Impact Analysis Estimate the impact of successful exploitation for each vulnerability. Like the likelihood determination, the value for impact analysis is also qualitative with three options:
• High, exploitation of this vulnerability results in high costs or significantly violates, harms, or hinders an organization’s mis-sions, reputation or interest.
• Medium, exploitation of this vulnerability leads to considerable costs or violates, harms, or hinders the organization’s missions, reputation or interest. A medium value is also attributed to vulnerabilities whose exploitation leads to human injury.
• Low, the exploitation of this vulnerability leads to some costs or noticeably affects the organization’s mission, reputation or interest.
Step 7: Risk Determination Determine the risk for each vulnerability. The risk is calculated based on the product of the likelihood value (high = 1.0, medium = 0.5, low = 0.1) and the impact value (high = 100, medium = 50, low = 10) = Risk. The product of these values is then transformed to a qualitative value using the following scale: 1<= low <= 10; 10 < medium <= 50; 50 < high <= 100. The inaccurate and arbitrary definition of risk as defined is the step is the motivation for this thesis.
Step 8: Control Recommendations List possible controls and alter-native solutions. During the risk assessment process, the possible solutions and controls are already introduced. For example, a vul-nerability in a web site could be solved by changing the code or solved by implementing an application level firewall to prevent this vulnera-bility from being exploited. Each proposed control or alternative so-lution should consider their effectiveness (is it solving the problem), legislation and regulation, organizational policy, operational impact and safety and reliability.
Step 9: Results Documentation Document the results. This docu-mentation could describe the risk assessment approach (participants, techniques used to gather information and a description of the qual-itative values used), the system characterization (output of Step 1), the threat statement (output of Step 2) and finally a list of vulnera-bilities and their gathered information.
One problem of the risk assessment is the lack of actual data to estimate the likelihood and impact [31], as described in the previous section. For the likelihood, this standard uses a qualitative value (“high”, “medium” or “low”) is based on abstract concept such as motivation and capability of threats.
has identified hackers on the Internet as a possible threat which can per-form hacking actions (those qualifications are directly copied from [34]). To perform step three, an attack and penetration test is executed by Pine Digital Security [58], a Dutch company that specializes in security test-ing. The documentation about the SQL Injection vulnerability is included in Appendix A. Then, step four, identifies controls that can minimize or eliminate the likelihood or impact of this vulnerability, which in this exam-ple are not existent. The fifth step is the determination of the likelihood. Based on this standard, a value of “high” must be given since the threat is motivated and capable, and no controls are implemented to prevent the threat from exploiting the SQL Injection vulnerability. Then, step six, estimates the impact of this vulnerability to be “high”, because the confi-dentiality of the customer database including the credit card information can be compromised completely. If this information is published online, it would significantly harm the organizations mission to sell products on-line. The likelihood and impact are multiplied in step seven to determine the risk of this vulnerability to be “high”. The documentation included in Appendix A also describes the recommended solution that is part of step eight. Finally, in step nine, the previous steps are documented and the vulnerability is reported as being a “high” risk.
In this example, steps two (threat identification), five (likelihood estima-tion), six (impact estimation) and seven (risk determination) are vague and fail to accurately describe the vulnerability. This problem was already described in the previous section and is attributed to a lack of actual data [31].
If a system is designed to provide historical information on the number of active threats on a computer network, the threat identification, and likelihood estimation could be improved. This system will not solve the impact estimation or risk determination problems, and will not be able to exactly state what the chance is for a vulnerability to be exploited. But, it is possible to define a profile based on motivation and capabilities and know how many threats met this profile during a specific time, thereby improving the likelihood estimation.
2.2
Literature
In the academic world, the lack of quantitative data is a known problem and different systems are proposed to obtain this. However, these systems have their own set of problems, since their applicability to the real world is often limited.
In 2004, Gehani and Kedem proposed the first system to automatically
calculate the risk of a system and respond accordingly [13]. This system calculates the risk based on events from an Intrusion Detection System and manages this risk by altering the exposure of the system; each request for access is granted based on the current risk level of that system. Although the system is designed to autonomously respond to risks, which is infeasible in real world setting, the system does automatically calculate the likelihood component of each risk in a quantitative manner. However, the likelihood is calculated by testing whether the attack matches completely or only partial to some specification. This could improve the likelihood calculation of known attacks, but not for new vulnerabilities for which the attacks cannot be enumerated.
In 2008, He et al proposed a system using game theory [16]. This system also identifies the lack of qualitative data and computes this using a game theoretical model. According to this model, the likelihood component of a risk is based on the cost and benefits for both attackers and defenders. An equilibrium is calculated and assumed to be the likelihood component. However, two major assumptions are made by this model, which are not in line with real world situations. First, attackers are assumed to be equal; there is no difference in likelihood for one threat to another. This is obvi-ously not in line with the real world, since some vulnerabilities can only be exploited by attackers with a certain level of skill. Second, an attack will always succeed when no defensive measurements are implemented. This is not in line with the real world since the success depends on motivation, skill set and environmental elements such as authentication.
2.3
TDS in Risk Management
Currently, Risk management lacks adequate data to quantitatively deter-mine the likelihood of a risk and therefore improve from having actual data on the threats on a network and their profiles. When designing the Threat Detection System (TDS), it is important to ensure that it can provide this information on a real network.
For each vulnerability, the security expert assessing it must be able to se-lect applicable threat profiles; the types of threats that are able to exploit the vulnerability. The system should then return the number of threats meeting these profiles that were detected during a specified time. If, for example, the risk of a vulnerability is assessed that requires advanced skills, for example, an XML External Entity Attack, the system should only re-turn the number of threats that have the capability of performing such advanced attacks. Instead of using vague concepts such as motivation and capability, the exact number of threats capable of exploiting the vulnera-bility is presented.
The profile of a threat consists of several properties. The security expert should define the threat profiles by selecting the properties that are required to exploit the vulnerability. For this research, the properties to estimate the likelihood value as defined in the NIST standard [34] are chosen. However, because other security experts can disagree on the properties they would like to use; the system must be designed to accept properties that are defined and programmed by other security experts.
The following list describes the properties that are selected for this re-search. These provide the security expert with a three properties, and implementing them illustrates the working of the TDS.
Skill class A threat has several skills that are used to exploit vulnerabili-ties (the NIST standard calls them capabilivulnerabili-ties). While it is tempting to be able to select the exact skill that is required to exploit a vul-nerability, this assumes an ability of the TDS to detect all possible skills of a threat. Because the system will be used on real networks, it will be impossible to configure the TDS to detect all possible skills. When using skill classes where threats possessing one skill are likely to possess the other skills in the same class, the TDS can be config-ured to detect a portion of the skills within the class to still provide useful data. This is a tradeoff between completeness and accuracy and must be configurable in the TDS to be changed by the security expert executing the risk assessment.
Android class Some vulnerabilities require the threat to be an actual human to exploit it, for example, when the threat first must register
and then log in with her new credentials. This is not possible for automated tools, scanning the Internet for vulnerabilities to exploit.
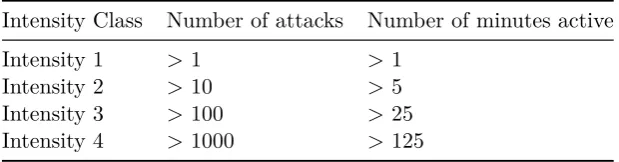
Intensity class The intensity of the attacks by a threat can be relevant information as it is closely related to motivation. There is a difference in threats that try some attacks for a few minutes and threats that actively spend months attacking a system or network.
It is important to note that for all three properties, the TDS must consider a possible hierarchy of classes. A threat performing a skill in an advanced skill class will also possess the skills in the basic skill class. Likewise, a threat capable of performing manual attacks is also able to download a tool and perform automated attacks.
Chapter
3
Network Security
The security of a computer network is based on three components: confi-dentiality, integrity, and availability. These components apply to the assets (data or systems) within the network [36]. To protect those assets, there are two approaches that are commonly implemented [2].
The first approach to network security is analog to building a large wall around a city; the bigger and higher the wall is; the harder it is for threats to get inside the city. It is universally accepted that there is no such thing as perfect security, which means that a threat with sufficient capabilities and resources is always able to climb over the wall.
The second approach to network security consists of monitoring the net-work for threats. Using firewalls, those threats can be stopped before they compromise the network.
The best network security is achieved using a combination of the two, making it hard for a threat to compromise the network and allowing the network security staff to stop them before they succeed. This combination could be modeled in Risk Management practices by defining the process of stopping the threats as controls that decrease the likelihood a threat can exploit a vulnerability [34].
3.1
Standards
in the Certified Secure Checklists [61], [62], [63] and [64], and in various system security handbooks [54], [48]). Often, an attack and penetration test is performed to reveal vulnerabilities which are subsequently resolved (possible using a risk management approach as described in the previous chapter). The security that is achieved by this approach is defined by the motivation of the threats; the network is secure if threats stop their attacks voluntarily: because they get bored, it takes too much effort, or another network is easier to compromise and therefore is more attractive. This means that the security of a network depends on the threats stopping their actions.
The second approach to network security is the active stopping of threats. Using some form of detection (either manual, automated or a combination), threats that attack the network can be detected and preventative measures can be taken to stop them. Richard Bejtlich, author of the book “The Tao of Network Security Monitoring: Beyond Intrusion Detection” [2], is one of the leading experts on network security monitoring in the professional world. His ideas on network security are invaluable for security profes-sionals working with real networks that have to be defended against real threats. According to Bejtlich, an important part of building a defensible network (next to limiting the intruder’s freedom, offering only a minimum number of services, and ensuring the network can be kept current) is the ability to watch the network. This should be anticipated during the design of a network and allows for the ability to audit all critical parts of the net-work. Watching a network results in indications and warnings. Indications are actions that are observable or discernible and confirm or deny enemy capabilities and intentions [2]. These indications are what Intrusion Detec-tion Systems call alerts. These indicaDetec-tions are interpreted by analysts who generate warnings when indications are serious. It is important to note that the collection of information can be automated ([59], [42], [50], [47]), but the analysis always requires real people [2]. The escalation of an indi-cation to a warning should be decided by a human, capable of analyzing the context of the indication.
3.2
Literature
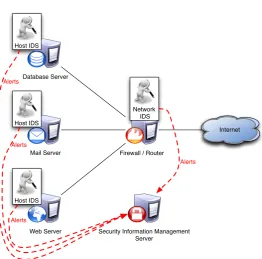
Many different types of Intrusion Detection Systems are developed to aid network security monitoring. These systems automatically detect attacks and report them in so called alerts either directly to the security experts tasked with monitoring the network, or via a Security Information Man-agement server that aggregates the alerts (illustrated in Figure 3.1). There are different distinctions in Intrusion Detection Systems [1]. First,
Internet
Firewall / Router Database Server
Mail Server
Web Server Host IDS
Host IDS
Host IDS
Network IDS
Security Information Management Server
Alerts Alerts
Alerts
[image:25.595.165.428.103.362.2]Alerts
Figure 3.1: An example deployment of IDS in combination with SIM
there are host based and network based systems; the Host based Intru-sion Detection Systems are installed on the computer they are monitoring, analyzing the log files and changes to the system and Network based Intru-sion Detection Systems are installed on a network and analyze the network traffic for attacks. Second, there are two approaches in how attacks are detected: anomaly based and signature based.
In Anomaly based Intrusion Detection Systems [21], [24], [38], [40], a profile of supposed good traffic is created and new network traffic is matched to this profile of good traffic to find anomalies. This system requires a training phase to create the profile of good traffic. This is a problem since the security expert must train the system with known-good network traffic, which is infeasible in real networks; the expert would need to capture weeks of network traffic and then manually remove all attacks to create this known-good traffic and when the network changes, for example by adding a server, the known-good traffic is no longer representative for the network and has to be created again. Also, anomaly-based IDS cannot distinguish between the different type of attacks; they can only state that the traffic is different from normal traffic [17]. These problems are the topic of ongoing research [6], [4], [5], [7], [32].
This approach (similar to anti-virus) employs a set of attack signatures and matches them against network traffic. All traffic matching a signature is considered to be an attack and is reported as such. This type of IDS can only detect attacks for which a signature is created, which means that it cannot detect new attacks [1].
A problem of IDS generally is that it generates a large stream of alerts that is too much to process manually. A solution to this problem is the use of Security Information Management (SIM) systems, which combine the results of multiple IDSs [12, 51]. Such systems allow the security expert to view the alerts of multiple Intrusion Detection Systems (as illustrated in Figure 3.1). Using SIM, several techniques can be implemented to reduce the number of alerts and therefore the workload of the security experts monitoring the network [29].
The first type of reduction in number of alerts consists of correlating alerts that are similar using different data mining techniques and distance func-tions [8], [20], [37], [33]. When multiple Intrusion Detection Systems are used, one attack can trigger multiple alerts (one from each IDS) and us-ing these correlation systems, these alerts are clustered in one high-level alert describing the complete attack. Also, with many worms and bot-nets active on the Internet, many identical attacks are launched from many dif-ferent systems. These correlation systems can cluster these alerts of these attacks in one high-level alert containing all those identical attacks. The second type of reduction in number of alerts consists of using attack scenarios, also called attack plans [3], [9], [10], [35]. Threats perform at-tacks based on an attack plan, which consists of different states until some target is reached [3]. This reduction combines multiple attacks in one alert describing the complete sequence of attacks.
The third reduction in number of alerts is achieved by using attack trees [27], [28]. By creating an attack tree containing the attacks and how the correlate, it is possible to see whether high-level goals are reached.
3.3
TDS in Network Security
The staff monitoring the network for threats could greatly benefit from a system that can automatically detect problems. Current systems (Snort [59], Bro [42], ModSecurity [47] and OSSEC [50]) are only capable of de-tecting known attacks which lead to a long list of attacks that have no real impact on the network. The staff needs to go through an endless list of attacks which don’t even contain the interesting events.
The TDS could help the monitoring staff by presenting a list of threats and their skill and intensity(as described in TDS in Risk Management (section 2.3)). Since most threats have no chance of compromising the network (because they lack the required skill class or intention class), the staff can focus only on threats that have an actual chance of compromising the network.
Chapter
4
Threat Detection System
This chapter describes the architecture and implementation of the Threat Detection System (TDS). The requirements for the system are defined in the previous two chapters and are the following:
1. Detect threats on a real computer network.
2. Determine the profile of these threats using threat properties that can be configured or defined by security experts.
3. Implement a skill, android, and intensity property as examples. 4. Allow a security expert to specify a threat profile and timeframe and
return the matching threats.
Based on these requirements for the prototype TDS, the following decisions are made:
1. The TDS is plug-and-play. There is no time, and money required to adapt the system for a specific network. This allows the system to be used directly in a new network.
2. The TDS connects passively to the network, for example using a SPAN port on a switch or router. Therefore, the system does not influence the integrity and availability of the network in any way. An alternative would be the installation of sensors or each computer (to allow host based intrusion detection), but then the system will not be plug-and-play.
4. The TDS supports HTTP. Nowadays, most attacks (60% of the at-tacks observed on the Internet [44]) are performed on websites and limiting the scope of the prototype to this protocol demonstrates the working of the TDS without the implementation of every possible protocol.
First, the architecture of a system that is capable of implementing these requirements is described in section 4.1, followed by the implementation of the separate components in section 4.2 to section 4.4. For each compo-nent, the choices that are made are documented. section 4.4 also provides guidance for security experts on using the implemented threat properties.
4.1
Architecture
This section describes the architecture of the Threat Detection System (TDS). It describes the ideas behind the system and describes the function of each component. The actual implementation of these components can be replaced to adapt the system to different environments.
The most important concept behind the Threat Detection System is the shift from detecting attacks to detecting the actual attackers (threats) and their properties (such as skill). Detecting threats is accomplished using the output of one or more Intrusion Detection Systems (each detecting attacks) and clustering the attacks in groups of attacks that belong to a single threat. The result of this process is a list of threats and their attacks. The Intrusion Detection Systems are not required to detect 100% of the attacks, since one attack for each threat is theoretically sufficient to detect that threat. Then, for each threat, a set of properties like skill is determined based on the attacks they performed or some external knowledge database. The accuracy of the properties determined for each threat depends on the amount of attacks detected of this threat; more detected attacks of a threat increase the accuracy of the properties determined for this threat.
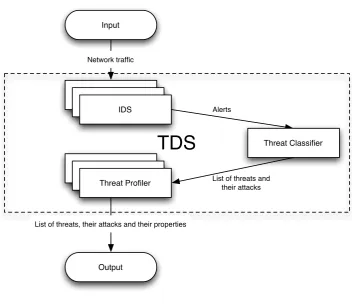
The TDS therefore consists of three components which are illustrated in Figure 4.1: one or more Intrusion Detection Systems (IDS), a threat clas-sifier and one or more threat profilers. This architecture allows one com-ponent, for example, the implementation of the IDS, to be replaced by a different IDS or use multiple IDS concurrently. It is also possible to scale the system by installing many IDS components on separate systems that all report to one thread classifier.
The responsibilities for each component are defined as following:
Alerts
List of threats and their attacks
Threat Classifier IDS
Threat Profiler Input
Output
List of threats, their attacks and their properties
TDS
Network traffic
IDS IDS
[image:31.595.120.473.111.417.2]Threat Profiler Threat Profiler
Figure 4.1: Components of the TDS
Intrusion Detection System The Intrusion Detection System (IDS) is responsible for detecting attacks in the network traffic. Different types of IDS could be used, but they must be able to detect actual threats on actual networks. To allow the threat profiler to determine the skill of a threat, the IDS must be able to identify the attack method used for each attack. The architecture of the system does not require an 100% detection rate from the IDS, since a few attacks of each threat already allow the threat to be detected and profiled. When more attacks of the threat are detected, the accuracy of the threat profile increases.
Threat profiler The threat profiler is responsible for determining a spe-cific property of a threat, such as the skill. To perform its function, a threat profiler receives a list of threats and their attacks from the threat classifier component. It is important to note that only concrete properties can be determined. Abstract properties like “intent” and “motivation” seem logical properties to profile, but cannot be reliably assessed and should not be used. Subjective properties that depend on some interpretation, like skill, can be used when they can be re-liably assessed given a specific interpretation, but the interpretation must be configurable since other users of the system could disagree with the interpretation and want to change it.
The architecture of the Threat Detection System provides a novel way of intrusion detection: a shift from detecting attacks to detecting threats and their properties. The architecture allows the system to be adapted to different environments and to use third party components when available.
4.2
Intrusion Detection System
The Intrusion Detection System is the component that detects the attacks on a network. Each attack is represented by an alert that is sent to the threat classifier for further processing. This section describes the choices for the used software and configuration of this software. Furthermore, a new set of signatures to detect generic attack types is presented.
Software
There are many Intrusion Detection Systems available such as Snort [59], Bro [42], Modsecurity [47] and OSSEC [50]. A selection was made using the following requirements:
• The IDS must directly work on any network as this is a requirement of the TDS. The system can be placed in any network and should just work, without a training period to adapt to the network. This means that the IDS cannot require training or a special configuration to work on a network and that anomaly-based IDS are not an option.
• The IDS must be able to passively monitor IPv4 network traffic; more specifically, it must be able to monitor the traffic from a live interface. This means that host based IDS and systems that are part of the server software are not an option.
• The IDS must be able to reassemble IP fragments, TCP streams and decode HTTP traffic. Each layer in the OSI model has it’s own encoding and fragmentation techniques and those must be handled by the IDS as all signatures in the IDS depend on the unambiguity of the network traffic. This is a vulnerable part of any signature based IDS, since the reassembling and decoding is specific for each operating system, software product, network layout, and temporal information like the ordering of packets and the time between them. All signature based IDS can be evaded by exploiting this weakness, but the IDS for this TDS does not need to be perfect. Unlike a traditional IDS, where every undetected attack is a problem, the TDS can still perform as long as some attacks of the threat are detected, but is less accurate.
• The IDS must use signatures that match the attack method in stead of exact attacks (or exploits). Real threats to networks create their own attacks and are also be able to exploit custom software. This means that signatures only matching known vulnerabilities in specific applications or only match specific exploits are unacceptable.
Currently, none of the third party IDS products available meet all the re-quirements. Snort [59] and Bro [42] can satisfy all except one requirement; they fail to use generic attack signatures and therefore only detect known exploits [57]. ModSecurity [47] is a product that is able to detect generic attack signatures, but is host based and does not meet the passive monitor requirement. Since Snort is the generally preferred IDS [46], it is chosen as the third party IDS product to be used in this TDS. A custom set of signatures is created to fulfill the requirement on generic attack method signatures.
Configuration
The configuration of the Snort IDS consists of single configuration file that is included in Appendix B. This configuration is basically instructing Snort to listen traffic on TCP port 80 (HTTP). It will verify the IP and TCP checksum of incoming packets and will handle fragmentation in both IP and TCP. More information about the configuration is included in comments in Appendix B.
Signatures
specific vulnerabilities in specific software [57]. These signatures work only adequately when protecting against computer worms performing one spe-cific attack on a known vulnerability in a commonly used software product. Since most of the websites consist of custom software, using the signatures accompanying Snort is not useful and a new set of signatures is created for use in this Threat Detection System.
The attacks performed by real threats can be described using generic at-tack methods, such as SQL Injection and Cross Site Scripting. To develop a set of signatures that match these generic attack methods, a complete overview of these attack methods is required. There are some lists avail-able describing the attack methods and three resources are particularly interesting: the OWASP top 10 [55], the CWE/SANS Top 25 Most Dan-gerous Software Errors [43] and the Certified Secure Web Application Scan Checklists [64], [62].
The OWASP top 10 is a list of the 10 most critical security risks in web applications [55], grouped in rather generic categories as “Injection Flaws” or “Broken Authentication and Session Management”. The CWE/SANS Top 25 Most Dangerous Software Errors [43] is a list of the 25 most dan-gerous problems found in software in generic. Both lists are not useable since they list only a subset of attack methods.
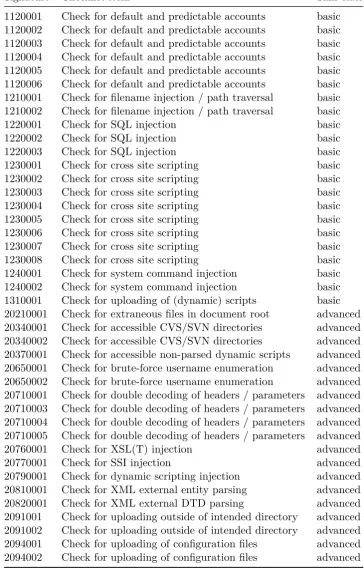
The Certified Secure Web Applications Scan Checklists list all possible attacks that can be performed by beginning threats (the basic scan checklist [64]) and advanced threats (the advanced scan checklist [62]). Although it is not possible for these checklists to be 100% complete, they provide much better coverage of the attack methods than the OWASP Top 10 and the CWE/SANS Top 25. A comparison between the three is provided in Appendix C, which illustrates the coverage of the basic and advanced checklist when compared to the OWASP Top 10 and the CWE/SANS Top 25.
For many items in the Certified Secure Web Application Scan Checklists, one or more signatures are created with an annotation to the specified checklist item they match. However, for some checklist items, it was not possible to create signatures that would not be triggered accidentally by legitimate users of the systems. An example of this is the checklist item “Check for identifier based authorization” (basic scan checklist item 1.3). The documentation states [60]:
Identifier based authentication is using an identifier (the id=5 parameter in a url) to allow access to an object. If you are for example authorized to view the following url:
• http://server/userinfo.php?id=23421
Then you can change the url to something different and view the user information of someone else:
• http://server/userinfo.php?id=23422
Creating a signature to match this behavior, would require the IDS to report any changes of a number in the URL. Normal browsing behavior can easily match this behavior, and such a checklist item is therefore not implemented in the signatures.
A first version of the list of signatures for the basic and advanced check-lists is included in Appendix D and Appendix E. These appendixes include comments about the checklist items for which no way was found to match only the attack and no legitimate network traffic. The developed set of signatures covers 35% of the attack methods as defined by the checklists. Although this appears to be a low percentage of the known attack methods, they cover most of the common attack methods such as SQL Injection and Cross Site Scripting (ranked 1 and 2 in both the OWASP Top 10 and the CWE/SANS Top 25). In terms of performance, threats could evade this system using only attacks that are not implemented in signatures. How-ever, this means that they cannot use many popular attack methods, sig-nificantly hindering their possibilities. Future research should investigate the implementation of more checklist items in the signature set, to provide better coverage, and increase the performance of the system (allowing the system to detect more threats).
Signature tuning
The performance of the Intrusion Detection System component is impor-tant for the performance of the complete Threat Detection System. A common criterion of IDS is the false positive rate, indicating the number of detected attacks that are not attacks. In the TDS, a false positive in the IDS can introduce a threat which is not a threat at all, which is a false positive in the TDS.
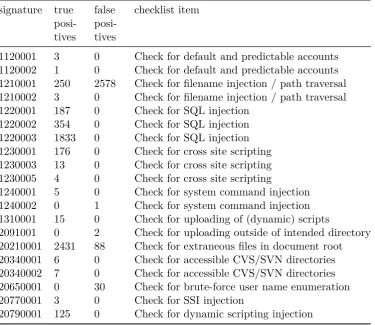
presented of IDS signature and their true positives and false positives. This table clearly shows that one rule is the cause of most the false positives.
Table 4.1: Preliminary Test: Signatures, True Positives and False Positives
signature true posi-tives false posi-tives checklist item
1120001 3 0 Check for default and predictable accounts 1120002 1 0 Check for default and predictable accounts 1210001 250 2578 Check for filename injection / path traversal 1210002 3 0 Check for filename injection / path traversal 1220001 187 0 Check for SQL injection
1220002 354 0 Check for SQL injection 1220003 1833 0 Check for SQL injection 1230001 176 0 Check for cross site scripting 1230003 13 0 Check for cross site scripting 1230005 4 0 Check for cross site scripting
1240001 5 0 Check for system command injection 1240002 0 1 Check for system command injection 1310001 15 0 Check for uploading of (dynamic) scripts
2091001 0 2 Check for uploading outside of intended directory 20210001 2431 88 Check for extraneous files in document root 20340001 6 0 Check for accessible CVS/SVN directories 20340002 7 0 Check for accessible CVS/SVN directories 20650001 0 30 Check for brute-force user name enumeration 20770001 3 0 Check for SSI injection
20790001 125 0 Check for dynamic scripting injection
Of the 2699 false positives, 2578 false positives are generated by just one signature (1210001), matching path traversal attacks where the threat is allowed op open files and uses ../ to open files different directories on the system. It is possible to just delete this signature matching path traversal. However, the signature also matched 250 true positives which would no longer be detected by the IDS. When the contents of the false positives in reviewed, 2555 of the false positives are created by just one IP address that keeps sending requests as illustrated in Listing 4.1. Another user copy-pasted the URL found on the Google result page. This URL contained three dots since it was abbreviated as illustrated in Listing 4.2. Other false positives for this signature are listed in Listing 4.3.
GET / anonymized HTTP/ 1 . 1
Accept : t e x t / p l a i n , t e x t / html ,∗/∗; q =0.3 TE : t r a i l e r s
Host : anonymized
R e f e r e r : . . / . . /
User−Agent : M o z i l l a / 4 . 0 ( e k n i p / 1 . 6 0 ) C o n n e c t i o n : TE
Listing 4.1: 1 of the 2555 similar false positives by one IP address. The host was indexing large parts of a website and used ../ in the Referer header field. This field is used to communicate to the web server which page was visited previously to this page and allows websites to know which other websites link to them. Using ../ in this field is highly unlikely, but the host in this case did not try to attack the network.
GET / anonymized / . . . / anonymized . html
Listing 4.2: A user copied an abbreviated URL from Google instead of clicking it. The abbreviation introduced the ... in the URL
GET / n l / . . / . . / . . / . . / anonymized HTTP/ 1 . 1 GET / anonymized / . . / anonymized . g i f HTTP/ 1 . 1
Listing 4.3: Two other false positives for signature 1210001, matching path injection. In this case, the browser is erroneously sending the ../ content, thereby triggering the signature
The false positives for the signature 1240002 were triggered by a user up-loading a video file that happened to contain the signature for system command injection. Another false positive was for signature id 2091001, where a user uploaded a file with the name “webcam-t01 kleiner..jpg” which triggered the signature that looks for uploading outside the directory (it matched “..”). This signature is improved to match “../” and “.." instead of just “..”.
The false positives generated for signature id 20210001 were matched be-cause users were legitimately visiting sites containing /admin, /website and /test. The signature matches when a user scans for extraneous files in the document root and triggers when more than 10 such requests are made within 60 seconds. The three hosts that triggering the true positives were each using more than 100 requests within 60 seconds. Therefore, signa-ture will be improved by raising the limit to trigger this signasigna-ture to 100 requests within 60 seconds.
Finally, the false positive generated for signature id 20650001 was matched because a user forgot his or her password 30 times. Here, the signature will not be changed since this warrants further investigation.
4.3
Threat classifier
The threat classifier receives a list of attacks on the network and groups them based on the threat. This results in a list of all threats and for each threat a list of their attacks.
There are many different ways of classifying a set of attacks, but this prob-lem has two special properties. First, there is no training set available as part of the requirements of the system. Without a training set, the algo-rithm must use unsupervised classification. Second, the result should be a grouping of the attacks instead of a model that can classify new attacks in the correct group. Based on these properties, the classification requires a clustering algorithm:
Clustering is the unsupervised classification of patterns (obser-vations, data items, or feature vectors) into groups (clusters)[18].
Other classification algorithms either try to detect if a pattern is part of a group (for example Bayesian classification or minimum error rate clas-sification) or the algorithms require a training set (discriminant analysis) [11]. Such algorithms cannot be used as classifier in this research.
The clustering algorithm typically consists of the following steps [19]:
1. pattern representation, describing the pattern (attack in this case) into features,
2. definition of a distance function between to patterns, 3. clustering or grouping,
4. data abstraction (if needed), and 5. assessment of output (if needed).
The following sections will each discuss one step of the clustering algorithm and how it relates to the classification problem of this research.
Pattern representation
Pattern representation is the step in the clustering algorithm that selects the patterns to use and the features of these patterns to use [18]. This step could also decide the number of clusters to use, but for this project this number is unknown and is not decided (the number of threats is unknown).
The patterns to use are already decided by the Intrusion Detection System part of this research; of all the possible network communications, only the actual attacks are selected and presented to the classifier as patterns. This also allows for the idea that the complete research could be modeled as a clustering algorithm; the IDS and Threat profiler are part of the clustering algorithm.
For each pattern (attack), there are many different features that can be selected. Each feature can be of the following types [14]:
1. Quantitative features: e.g.
a) Continuous values (e.g., weight);
b) Discrete values (e.g., the number of computers); c) interval values (e.g., the duration of an event). 2. Qualitative features;
a) nominal or unordered (e.g., color); b) ordinal (e.g., military rank).
There are however, no theoretical guidelines how to choose the features to use, and most algorithms conveniently assume that the best features are just available for the clustering step [18]. To itemize a list of possible features to extract from the patterns, a detailed look on the patterns is required. Each pattern (attack) consists of one or more IP headers, one or more TCP headers, one HTTP request, one time stamp, one IDS signature and the matching data. This results in the following list of possible features:
Generic pattern information The pattern generated by the TDS con-tains some information about the attack
Timestamp The IDS will add a timestamp to each attack, denoting the date, and time with microsecond resolution the attack was detected.
Signature ID The signature id denotes which signature matched on the packet and triggered the alert.
Matching data The matching data are the part of the network traf-fic that matched the signature.
Version Normal communications over the Internet use IP version 4. In the future, IP version 6 will also be used, but this is outside the scope of this research.
Header length The IP header length field is calculated from the packet to contains the length of the IP header.
Differentiated Services [49] The IP differentiated Services field used to be the Typo of Service field but is replaced in 1998. Now, it is used to classify network traffic so network operators can give certain classes (for example VOIP) priority over others.
Total length The IP total length field is calculated from the packet to contains the total length of the IP packet.
IP identification The IP identification field is a random value for each IP packet.
Reserved flag The IP reserved flag field is always set to zero.
Don’t fragment flag The IP don’t fragment flag is used to denote that the packet should not be fragmented.
More fragments flag When a packet is fragmented, the IP more fragments flag denotes that more fragments are following.
Fragment offset When a packet is fragmented, the IP fragment offset field denotes the offset of this fragment in the complete packet.
Time to live Routers use the IP time to live field to prevent loops. Each router forwarding the packet will decrease this field by one. When this field reaches zero, the packet is discarded.
Protocol The IP protocol field denotes the protocol encapsulated in the IP packet. In this research, the value of this field is always six (TCP)
Header checksum The IP header checksum field is calculated from the IP header to detect corruption.
Source address The IP source address denotes the sender of the packet. This information is also provided by the IDS for each pattern.
Destination address The IP destination address denotes the re-cipient of the packet. This information is also provided by the IDS for each pattern.
IP options The IP options field is used to include various options like time stamp and MTU information.
IP data In this research, the IP data will always be a TCP packet.
TCP [53] A TCP packet is used for a TCP connection.
Source port The TCP source port denotes the port used by the sender.
Destination port The TCP destination port denotes the port used by the receiver.
Sequence number The TCP sequence number is a random value for each TCP connection.
Acknowledgement number The TCP acknowledgement number is a random value for each TCP connection.
Data offset The TCP data offset field denotes the offset of the TCP data in the packet.
Explicit Congestion Notification flags [65] The TCP explicit con-gestion notification flags are used to signal network concon-gestion.
Control bits The TCP control bits (URG, ACK, PSH, RST, SYN, FIN) are used to control the TCP connection (setup, data trans-mission, and teardown).
Window The TCP window field is used to denote the size of the receiver window. This field is used to inform the recipient how many data can be transmitted before an acknowledgement is required.
Checksum The TCP checksum field is calculated from the packet and is used to detect corruption.
Urgent pointer The TCP urgent pointed denotes data that are considered urgent.
TCP data In this research, the TCP data will always be a HTTP request
HTTP request [41, 45] The HTTP request is a request from a web browser to a web service.
Method The HTTP method field denotes the action performed on the service. Most often, this is either GET or POST.
URI The HTTP Uniform Resource Identifier denotes the resource to access on the service.
Version The HTTP version field denotes the HTTP version used. This is normally 1.1 but values of 1.0 are also used.
Headers The HTTP headers contain additional information about the request like the browser version, the HTTP cookies and the referring web page.
Body The HTTP body is only used for HTTP methods that upload data to the service. This could be a file, or the content of a form submitted using the POST method.
Of these possible features, most features are calculated based on the packet or the connection and should not be used to identify the attacker. These features could be used to identify attacks, but this is the responsibility of the IDS component and not of the classifier. This leaves only the following features to possibly use for the classifier:
• Generic pattern information
– Timestamp
– Signature ID
– Matching data
• IP
– Source address
– Destination address
– IP Options
– IP data
• TCP
– Source port
– Destination port
– TCP options
– TCP data
• HTTP request
– Method
– URI
– Version
– Headers
– Body
For this research, the source IP address is used based on the assumption that threats do not change IP address during their attacks and that IP addresses are not used by multiple threats. This assumption does not hold in every case, but will provide a good starting point for this research. Future research could extend the threat classifier to use multiple features and thereby improve the accuracy of the classifier.
Clustering or Grouping
When the features of patterns are selected, the actual clustering or grouping of patterns is performed. There are many different clustering algorithms, each with their own properties. For this research, the following require-ments and limitations are posed on the clustering algorithm:
1. The number of clusters (threats) is unknown;
2. One feature (the source IP address) is present for each pattern (at-tack).
3. Each pattern (attack) must be grouped into one cluster (the threat). Future research could allow for attacks to belong to multiple threats; each with a certain confidence value indicating a confidence of this attack belonging to this threat.
123.123.0.0/16
123.123.0.0/17 123.123.64.0/17 123.123.128.0/17 123.123.192.0/17
[image:44.595.115.484.110.254.2]123.123.0.0/18 123.123.0.128/18
Figure 4.2: Hierarchical clustering algorithm
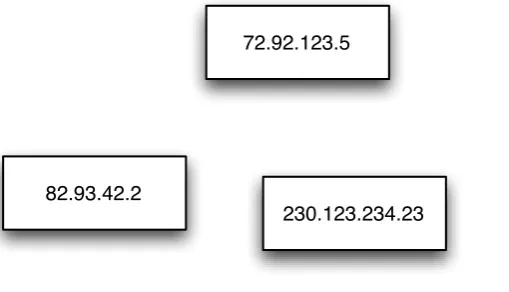
230.123.234.23
132.23.82.213
82.93.42.2
72.92.123.5
Figure 4.3: Partitional clustering algorithm
Clustering algorithms are split in hierarchical and partitional algorithms. The hierarchical algorithms organize the patterns into a tree (a nested series of partitions [18]) as illustrated in Figure 4.2, where the partitional algorithms create a partition without nesting as illustrated in Figure 4.3. For this research, each cluster represents the attacks of one threat. Since the assumption is that each threat uses one IP address, the clustering algorithm is very simple: all threats from one IP address belong to the same cluster.
Evaluation of assumption
An important assumption in this research is that threats use one IP address. This section discusses the validity of this assumption.
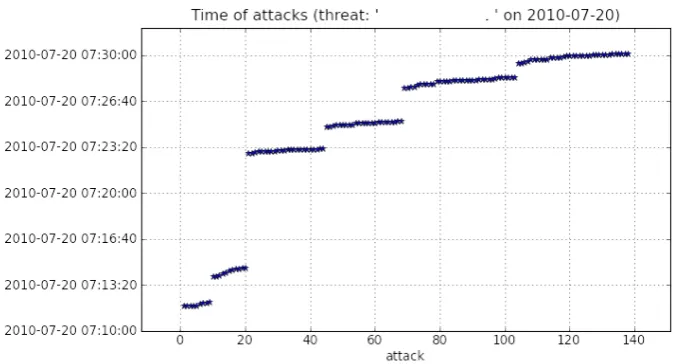
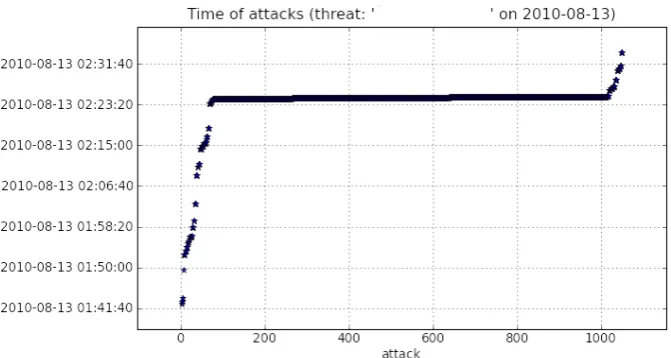
[image:44.595.118.373.318.464.2]Literature states that threats can use a different IP address for each step of their attack [2]. However, practical experience in this field tells that this is not the case for real hackers, but only for automated worms. Hackers will use a system they earlier compromised as source of their attack, but are unlikely change systems (and therefore IP address) during the attack. To evaluate this assumption, a distinction is made between targeted and un-targeted attacks. Targeted attacks involve a threat that is focussing on a specific network. Such a threat is either executing attacks from his own system or operating a set of computers to camouflage the attack. For un-targeted attacks, a worm or virus is circulating the Internet infecting systems at random. Each compromised system then starts attacking other systems. A special case of this is the botnet, where compromised systems become part of a network that is controlled by a person or group of persons. For the un-targeted attacks by worms, virii and botnets, it could be rea-soned that their attacks should be clustered together; this would lead to one threat for each worm, virus, or botnet attacking the network. How-ever, it could also be reasoned that the computers are compromised and should be counted as separate threats; they are each trying to compromise the network. If the TDS would combine the attacks of one worm, virus, or botnet in one threat instead of separate threats for each infected computer, it would change the scenario where, for example, 100 threats perform 5 at-tacks each, to a scenario where 1 threat performs 500 atat-tacks. This changes the characteristics of the threat to a targeted attack (one threat, many at-tacks) instead of an un-targeted one (many threats, few atat-tacks). For this thesis, the choice is therefore made to count each compromised computer performing attacks on the network as separate threats.
For targeted attacks, the assumption is that threats will not camouflage their attacks by using multiple systems. When threats do use multiple systems, they are detected as multiple threats performing a few attacks each. It is possible for a threat to use one IP address to perform a few complicated attacks, and several other IP addresses to perform many easy attacks