University of Warwick institutional repository: http://go.warwick.ac.uk/wrap
A Thesis Submitted for the Degree of PhD at the University of Warwick
http://go.warwick.ac.uk/wrap/1067
This thesis is made available online and is protected by original copyright. Please scroll down to view the document itself.
Development and Use of Avian
Pneumovirus Reverse Genetics Systems
Nicole Lynn Edworthy
A thesis submitted for the qualification of Ph.D. at the
Department of Biological Sciences, University of Warwick,
I
Table of Contents
TABLE OF CONTENTS I
LIST OF FIGURES VI
LIST OF TABLES X
LIST OF ABBREVIATIONS XII
ACKNOWLEDGEMENTS XIV
DECLARATIONS XV
ABSTRACT XVI
CHAPTER 1: INTRODUCTION 1
1.1 Introduction 2
1.1.1 Pneumovirus taxonomy and virion structure 2
1.1.2 APV incidence and distribution 4
1.2 Virus pathogenesis 6
1.2.1 Disease: turkey rhinotracheitis, swollen head syndrome, and 6 co-infection
1.2.2 Tissue tropism 7
1.2.3 Vaccines 8
1.3.Pneumovirinaegenome organization and protein products 10
1.3.1Pneumovirinaegenomes 10
1.3.1Pneumovirinaegenes and proteins 12
1.3.2.1 N protein 12
1.3.2.2 P protein 15
1.3.2.3 L protein 17
1.3.2.4 M2-1 and M2-2 proteins 17
1.3.2.5 F protein 22
1.3.2.6 G protein 24
1.3.2.7 SH protein 26
1.3.2.8 M protein 28
1.3.2.9 NS1 and NS2 proteins 28
1.4 Virus transcription and replication 30
1.4.1 Virus transcription 30
1.4.3 Virus replication 37
1.4.4 Replication regulatory sequences 37
1.5 Reverse genetics systems 40
1.6 Aims 46
CHAPTER 2: MATERIALS AND METHODS 47
2.1 Solutions and buffers 48
2.2. Media 49
2.3 Mammalian tissue culture- maintenance of cell lines 50
2.3.1 Vero, BSC-1, and HEp-2 cells 50
2.3.2 BSR-T7 cells 50
2.4 Bacterial cultures 50
2.4.1 Growth ofE. coli 50
2.4.2 Frozen competent bacteria 51
2.5 Standard cloning procedures 51
2.5.1 Reverse transcription-PCR 51
2.5.2 PCR 51
2.5.3 DNA purification 53
2.5.3.1 Gel extraction 53
2.5.3.2 Phenol/chloroform extraction 53
2.5.3.3 Ethanol precipitation 53
2.5.3.4 PCR product fragment purification 53
2.5.4 Agarose gel electrophoresis 54
2.5.5 Urea acrylamide gel electrophoresis 54
2.5.6 Enzyme digestions 54
2.5.7 Ligations 55
2.5.8 Transformation of bacteria 55
2.5.9 Small scale DNA preparations 55
2.5.9.1 Mini-preparations of DNA 55
2.5.9.2 Alkaline lysis 55
2.5.10 Large scale DNA preparations 55
2.6 Introduction of site-specific mutations into plasmid DNA 56
III 2.6.3 Pre-sequencing purification of DNA from quick screened colonies 57
2.7 Sequencing reactions with Big-Dye 58
2.8 Rescue systems 58
2.8.1 Helper virus rescue system 58
2.8.2 Plasmid helper rescue system 59
2.8.3 Full length genome rescue system 59
2.9 Preparation of cell lysates for CAT and luciferase assay 60
2.10 CAT assay 60
2.11 Luciferase assay 61
2.12 RNA Quantification 61
2.12.1 Northern blot 61
2.13 Growth and harvesting of virus stocks 62
2.13.1 Growth of non-recombinant virus stocks 62
2.13.2 Growth of recombinant virus stocks 63
2.14 Determination of virus titre by GFP expression assay 63
2.15 Nuclotide and protein sequence alignments 64
2.16 mRNA and protein simultaneous harvest 64
2.17 RNA probes 65
2.18 RNA standards 65
2.19 Imaging methods 66
CHAPTER 3: DEVELOPMENT AND OPTIMIZATION OF THE 67
APV PLASMID RESCUE SYSTEM
3.1 Introduction 68
3.2 Development of the plasmid rescue system for APV 70
3.2.1 Cloning of the APV N gene helper plasmid 71
3.2.2 Cloning of the APV P gene helper plasmid 72
3.2.3 Cloning of the APV M2-2 ORF helper plasmid 73
3.3 Establishment and optimisation of the APV plasmid rescue system 73 3.3.1 Optimization of the amount of N10, P9, and pCITE L plasmid 76
3.3.2 Effect of varying the amount of pM2-1 and pM2-2 plasmid 78 on reporter gene expression
3.4 Discussion 81
3.4.2 M2-1 and M2-2 in the APV plasmid rescue system 82
CHAPTER 4: EFFECT OF MUTATION OF THE GS AND GE 84
SIGNALS ON MRNA AND PROTEIN EXPRESSION IN THE APV PLASMID RESCUE SYSTEM
4.1 Introduction 85
4.2 Comparison of mRNA and protein expression levels from GS 86 sequence mutants
4.3 Activity of transcriptional signal mutations in the APV plasmid 91 rescue system
4.3.1 Gene junction mutations 91
4.3.1.1 Generation of IR mutant 1 93
4.3.1.2 Generation of IR mutant 2 97
4.3.1.3 Generation of IR mutant 3 99
4.3.1.4 Generation of IR mutant 4 101
4.3.2 Determination of effect of mutation of the pCATLUC 106 minigenome gene junction
4.3.3 Generation of dual GS sequence point mutations 108
4.3.4 Effect of dual GS sequence point mutation 110
4.4 Conclusions 111
CHAPTER 5: HETEROLOGOUS AND CHIMERIC PROTEIN 116
FUNCTION IN THE APV PLASMID RESCUE SYSTEM
5.1 Introduction 117
5.2 Effect of APV/PVM and APV/RSV heterologous helper plasmid 122 sets on protein expression in the APV plasmid rescue system
5.3 Effect of APV and hMPV heterologous helper plasmid sets on 124 protein expression in the hMPV plasmid rescue system and APV plasmid rescue system
5.4 Functionality of M2-1 APV/RSV chimeras in the APV plasmid 128
rescue system
V
CHAPTER 6: RESCUE OF APV FROM CDNA 140
6.1 Introduction 141
6.2 Production of GFP-expressing APV 143
6.2.1 Cloning of the eGFP full-length genome 144
6.2.3 Growth and eGFP expression in cell culture of virus CF2ESH 11 152 6.2.4 CF2ESH 11 virus expression of SH, G and eGFP mRNAs 157
6.2.5 CF2ESH 11 virus replication in turkeys 157
6.3 Production of GFP-expressing APV SH gene deleted viruses 162
6.3.1 Further characterization of virus CF2EdSH(dG) 164
6.4 Discussion 173
6.4.1. Detection of eGFPin vitro 173
6.4.2. Detection of eGFPin vivo 173
6.4.3. Viruses with SH deleted genomes 174
CHAPTER 7: CONCLUSIONS 176
7.1 Conclusions 177
7.2 Future work 179
BIBLIOGRAPHY 182
APPENDIX A: PRIMER SEQUENCES 201
APPENDIX B: CONSTUCT SEQUENCES 203
pCAT LUC dicistronic minigenome construct 204
pCF2 cassetted APV genome construct 208
APPENDIX C: CONFOCAL IMAGES
Time-lapse movies are included as DVD presentation and as flick books.
List of Figures
Figure 1.1 Genome Organization of thePneumovirinae. 2
Figure 1.2 Model of thePneumovirinaevirion. 3
Figure 1.3 Paramyxovirus ribonucleoprotein capsid structure. 4
Figure 1.4 Model of Paramyxovirus transcription. 31
Figure 1.5 Model of Paramyxovirus replication. 38
Figure 1.6 Model of the negative sense RNA virus full length 41 rescue system.
Figure 1.7 Schematic of the APV minigenome and dicistronic 43 minigenome constructs.
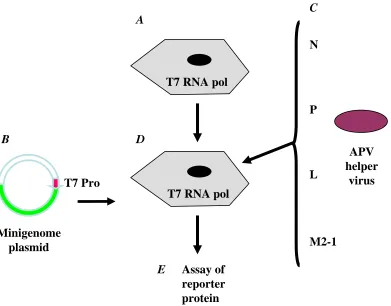
Figure 1.8 Model of the negative sense RNA virus plasmid 44 rescue system.
Figure 1.9 Model of the negative sense RNA helper virus 45 rescue system.
Figure 3.1 Sequence of the APV subgroup A (isolate CVL-14/1) 69 M2-1 and M2-2 ORFs.
Figure 3.2 Cloning of the N10 plasmid. 71
Figure 3.3 Cloning of P9 plasmid. 72
Figure 3.4 Cloning of pM2-2: PCR for M2-2 fragment and 74 restriction digest of M2-2 fragment and vector.
Figure 3.5 Screen of M2-2 plasmid clones for correct inserts. 75
Figure 3.6 Effect of APV N plasmid concentration on CAT protein 77 expression in the APV A PRS.
Figure 3.7 Effect of P plasmid variation on CAT protein expression 77 in the APV PRS.
Figure 3.8 Effect of APV L plasmid concentration on CAT protein 78 expression in the APV A PRS.
VII Figure 3.10 Effect of APV M2-2 plasmid concentration with and 81
without M2-1 plasmid present on CAT protein expression in the APV A PRS.
Figure 4.1 Effect of mutation of the dicistronic minigenome 87 plasmid LUC GS sequence on percentage activity.
Figure 4.2 CAT protein and LUC protein levels of selected GS 89 sequence mutants.
Figure 4.3 CAT protein and LUC protein levels of selected GS 90 sequence mutants.
Figure 4.4 Dicistronic minigenome (mRNA sense) gene junction 92 mutants.
Figure 4.5 Generation of fragments A and B. 94
Figure 4.6 Generation of fragment C. 95
Figure 4.7 Generation of IR mutant 1. 96
Figure 4.8 Agarose gels examining of restriction digestion products 97 for IR mutant 1 cloning.
Figure 4.9 Generation of IR mutant 2. 98
Figure 4.10 Generation of fragment D. 99
Figure 4.11 Generation of IR mutant 3. 100
Figure 4.12 Generation of fragments E and F. 102
Figure 4.13 Generation of fragment G. 103
Figure 4.14 Generation of IR mutant 4*. 104
Figure 4.15 Generation of IR mutant 4. 105
Figure 4.16 Determination of effect of mutation of the pCATLUC 106 minigenome gene junction on CAT and LUC protein expression.
Figure 4.17 P values determined using the Paired T Test for 107 significance between the IR mutants 1 to 4 for CAT and LUC
protein values.
Figure 4.19 Effect of duel GS point mutation on reporter 111 protein expression.
Figure 4.20 Percentage activity of gene junction mutationin vitro 114 andin vivo.
Figure 5.1 Effect of heterologous substitution of RSV plasmids. 123
Figure 5.2 Effect of heterologous substitution of PVM plasmids. 125
Figure 5.3 Effect of heterologous substitution of APV and 126 hMPV N, P or L plasmids.
Figure 5.4 Effect of heterologous substitution of APV and 128 hMPV minigenome or M2-1 plasmids.
Figure 5.5 RSV M2-1 protein deletion mutants. 129
Figure 5.6 Composition of APV/RSV chimeric M2-1 proteins. 130
Figure 5.7 The effect of APV/RSV M2-1 chimeric protein on 132 CAT reporter protein expression in the APV PRS.
Figure 5.8 The effect of APV/RSV M2-1 chimeric protein on 137 CAT and LUC reporter protein expression in the RSV PRS.
Figure 6.1 Full length APV cloned genomes. 144
Figure 6.2 Generation of pCF2 mutants- overview of cloning strategy. 145
Figure 6.3 Generation of eGFP fragment for insertion into the 147 CF2 genome.
Figure 6.4 Generation of genome vector for insertion of the eGFP gene 148 into the CF2 genome.
Figure 6.5 Screening of clones by restriction digestion for 149 substitution of the eGFP gene for the SH gene to create the
CF2EdSH genome.
Figure 6.6 Generation of SH fragment for insertion into the 150 CF2ESH genome.
Figure 6.7 Generation of genome vector for insertion of the SH 151 gene into the CF2EdSH genome.
Figure 6.8 Screening of clones by restriction digestion for 152 insertion of the SH gene to create the CF2ESH genome.
IX Figure 6.10 part I: Time lapse photography of infection of cells with 154
virus CF2ESH 11, 30 to 80min.
Figure 6.10 part II: Time lapse photography of infection of cells with 155 virus CF2ESH 11, 90 to 140min.
Figure 6.10 part III: Time lapse photography of infection of cells with 156 virus CF2ESH 11, 150 to 200min.
Figure 6.11 Northern blot of CF2ESH 11 virus RNA with G, SH or 158 eGFP specific probes.
Figure 6.12 Confocal microscopy of CF2ESH infected turkey sinus 160 3 days p.i.
Figure 6.13 Confocal microscopy of CF2ESH infected turkey sinus 161 5 days p.i.
Figure 6.14 Confocal microscopy of mock infected turkey sinus 161 3 or 5 days p.i.
Figure 6.15 real-time PCR measurements of number of copies of the 163 N gene (shown as log 10 copies per 10mg of tissue).
Figure 6.16 eGFP expression of viruses CF2EdSH 34 and 165
CF2EdSH(dG) 56 in BSC-1 cells.
Figure 6.17part I: Time lapse photography of infection of BSC-1 166 cells with virus CF2EdSH 56, at 0, 10 and 20min.
Figure 6.17part II: Time lapse photography of infection of BSC-1 167 cells with virus CF2EdSH 56, at 30, 40 and 50min.
Figure 6.17 part III: Time lapse photography of infection of BSC-1 168 cells with virus CF2EdSH 56, at 60, 70 and 80min.
Figure 6.18 Northern blot of virus RNA with G, SH or eGFP 170 specific probes.
List of Tables
Table 1.1 Nucleotide homologies of the pneumovirus genomes. 11
Table 1.2 Amino acid and nucleotide lengths of the pneumovirus 13 ORF and proteins.
Table 1.3 Percentage nucleotide homology and amino acid identity 14 of the pneumovirus N ORF and proteins.
Table 1.4 Percentage nucleotide homology and amino acid identity 16 of the pneumovirus P ORF and proteins.
Table 1.5 Percentage nucleotide homology and amino acid identity 18 of the pneumovirus L genes and proteins.
Table 1.6 Nucleotide homologies of the pneumovirus M2 mRNA. 18
Table 1.7 Percentage nucleotide homology and amino acid identity 20 of the pneumovirus M2-1 genes and proteins.
Table 1.8 Percentage nucleotide homology and amino acid identity 21 of the pneumovirus M2-2 genes and proteins.
Table 1.9 Percentage nucleotide homology and amino acid identity 23 of the pneumovirus F genes and proteins.
Table 1.10 Percentage nucleotide homology and amino acid identity 25 of the pneumovirus G genes and proteins.
Table 1.11 Percentage nucleotide homology and amino acid identity 27 of the pneumovirus SH genes and proteins.
Table 1.12 Percentage nucleotide homology and amino acid identity 29 of the pneumovirus M genes and proteins.
Table 1.13 Percentage nucleotide homology and amino acid identity 29 of the pneumovirus NS1 and NS2 genes and proteins.
Table 1.14 Pneumovirus gene start (GS) sequences. 33
Table 1.15 Pneumovirus gene end (GE) sequences. 35
Table 1.16 Pneumovirus intergenic region lengths in nucleotides. 36
XI Table 4.2 Primers and template pairs used for generation of duel 109
GS sequence mutants.
Table 5.1 Amino acid identities of the APV N, P, L and M2-1 protein 118 sequences with the homologous proteins of hMPV, PVM and RSV.
Table 5.2 Pneumovirus consensus gene start and gene end sequences. 121
Table 6.1 S/P ratios of turkeys prior to and three weeks 164 post inoculation with mutant virus CF2ESH 11.
Abbreviations
A adenine
APV avian pneumovirus
bp base pairs
C cytosine
CAT chloramphenicol acetyl transferase
cDNA complementary DNA
CIU cell infecting units
CMV cytomegalovirus
CPE cytopathic effect
C-terminus carboxyl terminus
d.p.i. days post infection
dATP 2' deoxyadenosine 5' triphosphate
dCTP 2' deoxycytidine 5' triphosphate
dGTP 2' deoxyguanosine 5' triphosphate
DIG digoxigenin
DNA deoxyribonucleic acid
dNTPs
equimolar mix of dATP, dCTP, dGTP and dTTP
dTTP 2'deoxythymidine 5' triphosphate
EtOH ethanol
FCS fetal calf serum
G guanine
hMPV human metapneumovirus
hr hour/hours
IRES internal ribosome entry site
kb kilobase
LUC luciferase
min minute/minutes
MOI multiplicity of infection
mRNA messenger RNA
N-terminus amino terminus
o/n over night
ORF open reading frame
p.i. post infection
PRS plamsid rescue system
PVM pneumonia virus of mice
RLU relative light units
RNA ribonucleic acid
RSV respiratory syncytial virus
rt room temperature
XIII
sec second/seconds
SeV Sendai virus
ssDNA single-strand DNA
T thymine
U uracil
Acknowledgements
XV
Declarations
Abstract
Avian pneumovirus (APV) has remained an important pathogen of domestic fowl since its isolation in the 1970s. A reverse genetics system for APV was developed that affords direct manipulation and analysis of the molecular biology, pathogenicity, and tropism of APV. Using a synthetic minigenome system, the M2-1 protein was found to enhance transcription but not be essential for replication and the APV M2-2 protein was shown to inhibit
Chapter 1:
1.1 Introduction
1.1.1 Pneumovirus taxonomy and virion structure
Avian pneumovirus (APV), also known as avian metapneumovirus (Lamb et al., 2000) and previously known as turkey rhinotracheitis virus, is a member of the virus family
Paramyxoviridae, the subfamily Pneumovirinae and the genus Metapneumovirus
(Bermingham et al., 2007; Cavanagh and Barrett, 1988; Collins and Gough, 1988;
Njenga et al., 2003; Pringle, 1995; Pringle, 1996; Pringle, 1998; Yu et al., 1991). Within
the Pneumovirinae subfamily, the viruses of the Pneumovirus genus are the best studied,
especially the human pathogen respiratory syncytial virus (RSV). The viruses of the
Pneumovirinae have an enveloped, non-segmented, negative-sense RNA genomes that
are 13 to 15kb in length. The APV genome encodes eight mRNAs and directs the expression of nine proteins (figure 1.1 and section 1.3) (Collins and Gough, 1988; Ling and Pringle, 1988). APV is classified into the subfamily Pneumovirinae and genus Metapneumovirus based on electron microscopy studies, mRNA profiles, genome
sequences, and the molecular weights of its proteins (Bachi and Howe, 1973; Bhella et al., 2002; Cavanagh and Barrett, 1988; Compans et al., 1967; Joncas et al., 1969).
5' SH
3’ N P M F M2 G L
5'
3’ N M F L
NS1
NS2
P
SH
G M2
Figure 1.1 Genome organization of the Pneumovirinae.
Sub-Family: Pneumovirinae
Genus Pneumovirus:
Human, bovine and ovine respiratory syncytial viruses (RSV, BRSV and ORSV), Pneumonia virus of mice (PVM). PVM lacks the overlap between the M2-1 and L genes.
Genus Metapneumovirus:
3 The virions of the pneumoviruses and metapneumoviruses are spherical but pleomorphic (the appearance of two or more distinctly different forms is common) and approximately 200nm diameter (Collins and Gough, 1988; Gough et al., 1988b; Wyeth et al., 1986).
The virion consists of the ribonucleoprotein (RNP) complex surrounded by the matrix (M) protein and a cell-derived lipid envelope with the attachment glyco- (G) and fusion (F) proteins protruding 13-14nm from the surface (Collins and Gough, 1988) (figure 1.2). A small hydrophobic (SH) glycoprotein has also been isolated, although the exact
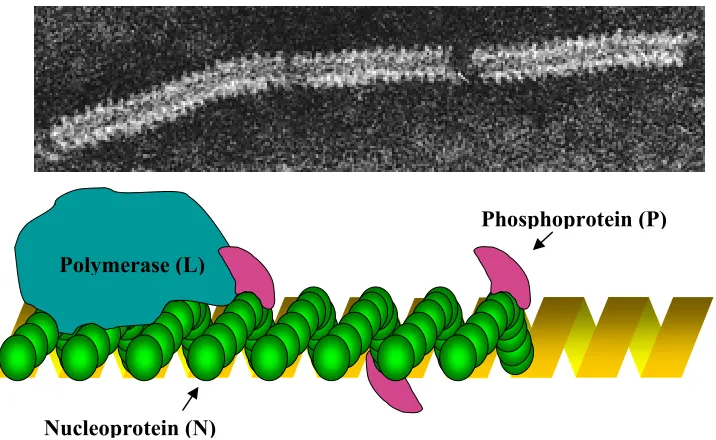
location of the SH protein in the virion is not known. The RNP complex consists of the negative sense RNA genome tightly bound with nucleocapsid (N) protein and associated with phospho- (P) and large polymerase (L) proteins (Huang et al., 1985; Peeples and
Levine, 1979). This complex has been visualized using negative staining and electron microscopy for the Paramyxoviridae and shows a distinctive herring-bone structure
(figure 1.3). The APV nucleocapsid (the N protein associated with the RNA genome) is smaller (12-15nm in diameter) than the 18nm helical nucleocapsid of the
Paramyxovirinae (Alexander, 1991; Collins and Gough, 1988).
Matrix (M)
Attachment (G) Fusion
(F)
RNP Complex
Lipid Membrane
Figure 1.2 Model of the Pneumovirinae virion. The pneumovirus virus virion is
1.1.2 APV incidence and distribution
APV was first observed as an agent causing respiratory disease in turkeys and chickens in South Africa in the 1970s (Buys and Du Preez, 1980; Buys et al., 1989a). The virus was
isolated as the causative agent of respiratory disease in turkeys and as an agent
contributing to swollen head syndrome in chickens (section 1.2) during outbreaks that occurred in France and England (Giraud et al., 1986; McDougall and Cook, 1986;
Wilding et al., 1986). Viral proteins have been detected in turkeys using
immunofluorescence (IF) (Jones et al., 1986; Jones et al., 1988) and immunoperoxidase
(IP) assays (O'Loan and Allan, 1990). APV isolated from turkeys has also been shown to be able to infect chickens, verified by IP, virus isolation, and histology (Jones et al.,
1987; Majo et al., 1995).
[image:22.595.119.477.103.323.2]APV appears to be present in flocks of domestic birds in most areas of the world, with serological evidence of APV infection reported in most of Europe, South Africa, Asia (Lu et al., 1994), Israel (Weisman et al., 1988), Japan (Otsuki et al., 1996), south and central America (Dani et al., 1999), China, Nigeria (Owoade et al., 2006), and the USA
Figure 1.3 Paramyxovirus ribonucleoprotein capsid structure. The electron microcopy image is courtesy of Linda M Stannard (University of Cape Town, http://web.uct.ac.za/depts/mmi/stannard/paramyx.html).
Nucleoprotein (N)
Phosphoprotein (P)
5 (Bennett et al., 2004; Cook et al., 1999; Goyal et al., 2000). Virus has been isolated from
birds in France, Great Britain, Italy (Alexander, 1991), South Africa (Buys and Du Preez, 1980) and Israel (Weisman et al., 1988) (reviewed by Jones (1996)).
APV primarily infects domestic flocks of turkeys and chicken, but may also persist in populations of wild birds. APV causes major economic losses in infected flocks and turkeys as young as one day old are susceptible to infection (Gough et al., 1988a). Once introduced into an area, the spread of APV is rapid with morbidity reaching 100% (Alexander, 1991; Anon., 1985; Cook et al., 1991; Gough et al., 1988a), though how the
virus spreads from farm to farm is unknown. Stuart (1986) suggested APV could be spread via migratory birds as it has been shown to infect wild fowl, although the role of wild birds in the spread of APV to and between domestic populations remains unclear (Bennett et al., 2002; Bennett et al., 2004; Gough et al., 1988a; Gough et al., 2001;
Gough et al., 1994; Lwamba et al., 2002; Turpin et al., 2008). Evidence for APV in wild
birds comes from its ability to cause disease following experimental infection in
pheasants, and guinea fowl (Gough et al., 1988a), the detection of antibodies to APV in guinea fowl (Picault et al., 1987) and the isolation of virus from wild flocks of pheasants (Gough et al., 2001) and wild Canada geese (Bennett et al., 2002). APV RNA has also been found in blue-winged teals (Bennett et al., 2002). There have been no reports of natural or experimental infection outside of avian species (Naylor and Jones, 1993). Four subgroups of APV have been established based initially on the relatedness of the sequence of the G protein and serological cross reactivity. APV subgroups A and B have been found in Europe, Africa, Asia, and the Middle East (Banet-Noach et al., 2005), (Collins et al., 1993; Cook et al., 1993a; Hafez et al., 2000; Juhasz and Easton, 1994; Li et al., 1996; Mase et al., 2003). Subgroup C was initially isolated in Colorado, but has
now been found in the states of Minnesota, North Dakota, South Dakota, Iowa and Wisconsin in the USA as well as in France and Korea (Bennett et al., 2004; Cook et al.,
1999; Dar et al., 2002; Goyal et al., 2000; Seal, 1998). Subgroup D was found in France
1.2 Virus pathogenesis
1.2.1 Disease: turkey rhinotracheitis, swollen head syndrome, and co-infection. APV causes respiratory illness in domestic fowl and was initially characterised as the pathogen causing outbreaks of turkey rhinotracheitis (TRT). APV primarily infects turkeys and chickens, although seroconversion of wild birds with asymptomatic infection has been reported, as described above. In experimentally infected turkeys, APV causes coughing, and ocular and sinus discharge. Associated clinical signs are sneezing, head shaking, egg loss and production of eggs with thinned shells (Anon., 1985; Cook et al.,
1996; Cook et al., 2000; Jones et al., 1988; Lister and Alexander, 1986; O'Brien, 1985;
Sugiyama et al., 2006; Wyeth et al., 1987). In broiler breeders, extreme cases of 98%
drop in egg production have been observed (Naylor and Jones, 1993).
In chickens, APV infection has been linked to swollen head syndrome (SHS)(Aung et al.,
2008; Gough et al., 1994; Jones et al., 1987; Jones et al., 1991; Lister and Alexander,
1986; Lu et al., 1994; Morley and Thomson, 1984; Nakamura et al., 1997; O'Brien, 1985;
Pattison et al., 1989; Picault et al., 1987; Tanaka et al., 1995; Wyeth et al., 1987),
although secondary infection clearly plays a role in the disease. An agent that is now known to be APV was first implicated when the virus was isolated from chickens with SHS (Buys et al., 1989b; Jones et al., 1991; Nakamura et al., 1997; Picault et al., 1987).
While APV antibodies have been found in commercial chicken flocks, antibodies were found in birds with and without SHS or respiratory disease (Cook et al., 1988) and SHS has also been shown to occur in the absence of APV infection (Droual and Woolcock, 1994; Shirai et al., 1993). It seems clear that APV infection alone is not sufficient to
induce, or may not be the sole cause of, SHS. However, as attempts to reproduce SHS experimentally in boiler chicks by 32 days with co-infection of APV and the most commonly found co-isolate in SHS (E. coli) failed, the role of APV in this syndrome
remains unclear (Al-Ankari et al., 2001).
In the field, APV infection is seldom the only pathogen infecting commercial flocks and co- infection can result in up to 90% mortality (Alexander, 1991; Gough et al., 1988b),
7 infection appears to have an immunosuppressive effect in turkeys (Chary et al., 2002a;
Jones et al., 1992; Timms, 1986) such that prior APV infection rendered hemorrhagic
enteritis virus vaccine approximately 50% less effective than vaccination alone (Chary et al., 2002b). This immunosuppression may leave birds open to bacterial infection (Jirjis et al., 2004; Van de Zande et al., 2001), possibly increasing the susceptibility of turkeys to
secondary infection by damaging the ciliated and non-ciliated epithelia cells of the turbinates (Majo et al., 1996). A mechanism of ‘viral priming’ has been proposed, based on the finding that APV infection prior to infection with Ornithobacterium
rhinotracheale was show to cause respiratory disease where bacterial infection alone did
not (Marien et al., 2005). Experimental co-infection of APV and E. coli O78:K80
resulted in increased respiratory symptoms and lesions in chickens (Majo et al., 1997). Co-infection of APV with Bordetella avium and Pasteurella-like organisms showed an
increased range of virus infection to the heart, liver, spleen, kidneys and caecal tonsils for a short time post infection, and increased the number of sites of infection of Pasteurella
-like organisms (Cook et al., 1991). Mycoplasma gallisepicum infection following APV
infection was more invasive and increased levels of mortality were reported, although the severity of illness in dually infected birds was not affected (Naylor et al., 1992). Al-Ankari et al. (2001) found in broiler chicks that co-infection of APV and a mix of pathogenic E. coli strains exacerbatedthe disease presentation in the birds. 1.2.2 Tissue tropism
As with all pneumoviruses, APV is thought to be primarily a respiratory pathogen though the exact tropism of the virus has been shown to be strain and host (chickens or turkeys) dependent (Cook et al., 1993b). APV subgroup A virus was found in the turbinates, sinuses, upper and lower trachea, lungs and air sacs of experimentally infected turkeys periodically up to 10 d.p.i. whereas APV subgroup B was found mainly in the upper respiratory tract (Buys et al., 1989a; Cook et al., 1991; Jones et al., 1988; McDougall and
Cook, 1986; Van de Zande et al., 1999). Indirect immunofluorescence experiments
trachea (Majo et al., 1995).
In chickens, in vitro experiments have shown ciliostasis in tracheal organ cultures and
syncytia formation in chicken embryo cell cultures following of APV infection (Gough et al., 1988a). In experimentally infected chickens, virus was isolated from the respiratory tract (nasal tissue, sinuses, trachea, and lung), although it was found most abundantly in the upper respiratory tract tissues. In these experiments, no virus was isolated from the kidney, liver, duodenum, bursa of Fabricius or caecal tonsils. Using IP, virus was found most consistently in nasal turbinates up to 5 days post infection (d.p.i.) and was found occasionally in sinuses and trachea on days 4 and 5 d.p.i. Histology of the upper respiratory tract tissues showed changes most strikingly in the nasal turbinates and less severely in the sinuses and trachea (Catelli et al., 1998).
The association of APV infection with egg drop syndrome suggested that the virus was capable of infecting the reproductive tract. However, direct experimental evidence is mixed, with Giraud et al. (1986) finding no evidence of transmission of the virus to eggs in turkeys, but several other groups finding APV in the reproductive tract of broiler breeders and laying turkeys (Anon., 1985; Lister and Alexander, 1986; O'Brien, 1985; Wyeth et al., 1987). In chickens, Jones et al. (1988) found APV in the reproductive tract
of laying hens, as well as in the upper respiratory tract, but not in blood or ovaries and APV antigen has been detected by IP in oviduct in laying hens (Cook et al., 2000). Shedding of small amounts of APV from turkeys up to 14 d.p.i. has been reported (Cook et al., 1991), again suggesting that APV is able to infect tissues outside of the respiratory tract.
1.2.3 Vaccines
9 resulting from APV challenge (Cook et al., 1996; Cook et al., 2000). Sugiyama et al.
(2006) showed that the choice of challenge virus was important in establishing efficacy of a vaccine against egg drop and respiratory symptoms. Problems of reversion to virulence were found with a live attenuated APV subgroup A vaccine which was shown to persists in turkeys (Catelli et al., 2006). Additionally, Kapczynski et al. (2008) showed that a simple intranasal vaccination with an inactivated APV did not protect turkeys from APV challenge, indicating that the method of vaccine delivery also needs to be taken into consideration. Encouragingly, initial trials of a cold-adapted strain of APV showed that it protects turkeys for 14 weeks without causing disease (Patnayak and Goyal, 2006;
Patnayak et al., 2002). Additionally, Ganapathy and Jones (2007) showed that chicks
could be protected with an APV subgroup B live attenuated vaccine for up to 49 day after vaccination. Due to the possibility of APV vaccination affecting the outcome of infection with other avian pathogens (section 1.2.1), concerns about the use of APV vaccines remain.
The mechanisms of protection of APV vaccines have been investigated and it is clear that more research is required in this area. Interestingly, it has been shown that poults can be vaccinated even when they have circulating maternal antibodies to APV without decrease in protection (Catelli et al., 1998; Cook et al., 1989). Jones et al. (1992) showed that
even with immunosuppression of antibody production using cyclophosphamide, turkey poults vaccinated with a live attenuated APV strain were protected from challenge 21 days later. For an APV subgroup C vaccine, the absence of antibodies in turkey poults following vaccination still resulted in protection from challenge with APV (Patnayak and Goyal, 2004; Patnayak et al., 2002).
The immunopathogenesis of the virus is not well studied, but it has been shown that APV may mediate the inhibition of T cells (Chary et al., 2002a), trigger the accumulation of CD4+ T cells, and the release of cytokines (Liman and Rautenschlein, 2007).
1.3. Pneumovirinae genome organization and protein products 1.3.1 Pneumovirinae genomes
The APV subgroup A isolate CVL14/1 genome is 13370 base in length, which
comparable to the hMPV isolate 001 genome (13387 bases) but shorter than either the RSV strain S2 (15190 bases) or PVM strain 15 (14887 bases) genomes (for Genbank accession numbers, see section 2.15). As can be seen in figure 1.1, all pneumoviruses encode three proteins that form the RNP complex (the N, P, and L proteins), three
glycoproteins (the G, F and SH proteins), a structural matrix protein (M) and an M2 gene that has two overlapping ORFs. The M2 mRNA produces an anti-termination factor (M2-1) and a protein of unknown function (M2-2).
The APV genome differs from the RSV and PVM genomes in several respects. APV lacks the NS1 and NS2 genes (Randhawa et al., 1997) and the genes of APV differ in
order from RSV and PVM: the F and M2 genes of APV are found between M and SH instead of between G and L as is seen for RSV and PVM. Additionally, PVM has been shown to encode a second P protein (P-2) from the P gene (Barr et al., 1994). For APV,
only the M2 gene and possibly the N gene express more than one protein (Alvarez and Seal, 2005).
A comparison of representative genomes of APV subgroups A, C (full genome sequences for subgroups B and D are not currently available), hMPV, RSV and PVM was carried out (table 1.1, section 2.15). Overall, the representative viruses of the subfamily
Pneumovirinae have between 40 and 66% homology, with the APV subgroup A genome
Table 1.1 Nucleotide homologies of the pneumovirus genomes. The percentage homologies (in green boxes) of the genomes of RSV strain RSS-2, APV subgroup A isolate CVL141, APV subgroup C, hMPV isolate 001 and PVM strain 15 were compared as described in section 2.15. Genomes were not rearranged to account for the differences in gene order of the viruses, possibly leading to artificially low levels of homology between the pneumovirus and the metapneumovirus genomes. The levels of nucleotide homology and amino acid identity for the individual virus genes and proteins are detailed in tables 1.3 through 1.13.
52 40
41 39
RSV
43 45
43 PVM
66 57
hMPV
59 APV
subgroup C
PVM hMPV
APV subgroup
C APV
subgroup A Percentage
homology (%)
1.3.2 Pneumovirinae genes and proteins 1.3.2.1 N protein
The subfamily pneumovirus N proteins are well conserved in length, with APV subgroup A, B and RSV having 391 amino acids, APV subgroup C and hMPV having 394 amino acids, and PVM having 393 amino acids (table 1.2). The levels of homology between the pneumovirus N genes and of amino acid identity between the N proteins were also determined (table 1.3). The levels of nucleotide homology between the APV subgroups A, B and C ranged from 65% to 76%, with the highest levels seen between subgroups A and B (76%). Within the genus Metapneumovirus, the highest levels of homology were
seen between the APV subgroup C and the hMPV N genes (65%). The nucleotide homology levels within the pneumovirus genus and between the pneumovirus and metapneumovirus genera were lower, with the highest level being between the PVM and RSV N proteins (62%). The protein identity levels showed a similar pattern, although here the highest level was seen between APV subgroups A and B (91%). The amino acid identity levels within the Metapneumovirus genus were higher than their nucleotide
homology levels and ranged from 69 to 91%. As before, the level of homology between APV subgroup C and hMPV (88%) was higher than that seen between APV subgroup C or hMPV and any other virus.
The model for the functional processes undertaken by the pneumovirus RNP complex suggests the N protein is an essential structural pneumovirus protein that encapsidates the viral RNA and binds to the P and M2-1 proteins. Experimental evidence for this model is extensive. The bRSV N protein can spontaneously form nucleocapsid structures with RNA even when expressed in the absence of any other viral proteins (Maclellan et al., 2007). Khatter et al. (2000) showed that the bRSV N protein has the ability to
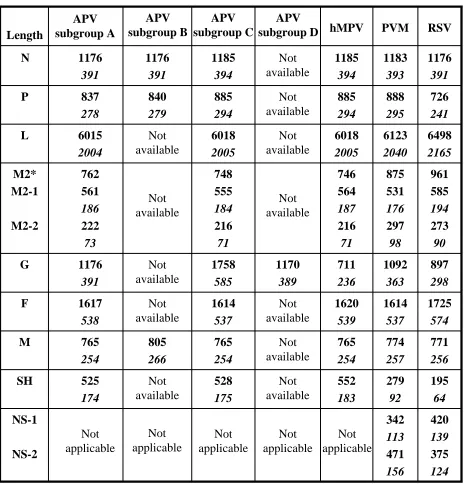
Table 1.2 Amino acid and nucleotide lengths of the pneumovirus ORF and proteins.
Table 1.3 Percentage nucleotide homology and amino acid identity of the
15 bind to itself, as well as the P and M2 proteins (Samal et al., 1993). Little of the N protein sequence appears to be superfluous, as two-hybrid system experiments showed that deletion of any region of the RSV N protein obliterated N protein binding (Garcia-Barreno et al., 1996; Slack and Easton, 1998).
1.3.2.2 P protein
The subfamily pneumovirus P proteins vary in length from the RSV protein of 241 residues to the 295 residue PVM P protein (table 1.2). The APV subgroup C and hMPV P proteins are identical in length (294 residues) whereas the APV subgroup A and B P proteins are shorter, at 278 and 279 residues, respectively. The levels of homology or identity of the P genes and proteins were determined (table 1.4). The highest levels of nucleotide homology were seen between APV subgroups A and B (69%) and between APV subgroup C and hMPV (67 1%). The P protein identity levels were also highest between APV subgroups A and B at 72% and between APV subgroup C and hMPV P proteins (68%). RSV and PVM had no more than 42% nucleotide homology or 27% amino acid identity with any of the metapneumoviruses and only 49% nucleotide homology or 33% amino acid identity between themselves.
The pneumovirus P protein is essential, making up part of the viral polymerase complex. The bRSV P protein has been shown to bind the N and L proteins in
co-immunoprecipitation studies (Khattar et al., 2001). The regions of the RSV P protein that are involved in binding have been found to be two regions in carboxyl-terminus of the P protein for N protein binding by two hybrid studies, co-immunoprecipitation and the formation of inclusion bodies (Garcia-Barreno et al., 1996; Slack and Easton, 1998).
Further RSV two-hybrid system studies showed that the RSV P protein can bind to itself, N protein, and NS1 protein (Hengst and Kiefer, 2000). The P protein also appears to be responsible for host specificity for human and bovine RSV (Buchholz et al., 2000;
Table 1.4 Percentage nucleotide homology and amino acid identity of the
17
1.3.2.3 L protein
The L proteins of the pneumovirus subfamily vary in length from 2004 amino acids for APV subgroups A and C to 2164 amino acids for RSV (table 1.2). The L gene sequences for APV subgroups B and D are not currently available. The levels of nucleotide
homology for the L gene are over 50% for all members of the pneumovirus subfamily (table 1.5), with the highest levels found between hMPV and APV subgroup C at 71%. The APV subgroup A L gene has a 63% nucleotide homology with those of the APV subgroup C and hMPV, but only 55 and 50% homology with those of PVM and RSV, respectively. The levels of identity between the L proteins are similar, with APV subgroup C and hMPV having 80% amino acid identity and APV subgroup A having identical amino acid identity percentages as nucleotide homology percentages to APV subgroup C and hMPV.
The L protein is the large polymerase subunit and has been shown to be the main catalytic unit of the polymerase complex for negative-strand RNA viruses (Grdzelishvili
et al., 2005; Hercyk et al., 1988; Ogino et al., 2005). As discussed above, the L protein
for RSV binds the P protein to make up the viral RNA dependent RNA polymerase. Analysis of the polymerase proteins of five negative sense RNA viruses (Sendai virus, Newcastle disease virus, measles virus, vesicular stomatitis virus and rabies virus) defined six conserved domains (Poch et al., 1990). No direct study of the APV L protein functionality has been carried out.
1.3.2.4 M2-1 and M2-2 proteins
The M2 mRNA of the pneumovirus subfamily is unique, with no homologue in any other system. The organization of the M2 mRNA is unusual in that it contain two overlapping ORF, both of which produce viral proteins. Translation of the M2-2 protein from the M2 mRNA is coupled to translation of the 1 protein as the overlapping region of the M2-1 and M2-2 ORFs has been shown to direct the ribosome back to the start codon of the M2-2 ORF from the M2-1 stop codon (Ahmadian et al., 2000; Gould and Easton, 2005;
Table 1.5 Percentage nucleotide homology and amino acid identity of the
pneumovirus L genes and proteins.The percentage homologies of the nucleotides of the L ORFs (green boxes) and percentage identity of the proteins (grey boxes) of RSV strain RSS-2, APV subgroup A isolate CVL141, APV subgroup B isolate 98103, APV subgroup C, hMPV isolate 001 and PVM strain 15 were compared as described in section 2.15. RSV PVM hMPV APV subgroup C APV subgroup A 54 52 50 50 RSV 49 55 54 55 PVM 43 49 71 63 hMPV 43 48 80 63
APV subgroup C
43 50
63 63
APV subgroup A
50 41 39 39 RSV 38 37 35 PVM 73 63 hMPV 63 APV subgroup C PVM hMPV APV subgroup C APV subgroup A Percentage homology (%)
19 homology for the M2 mRNAs of the pneumovirus subfamily also vary widely, with APV subgroup C and hMPV having the highest levels of homology at 71% and PVM having no more than 38% homology with any of the pneumoviruses (table 1.6).The RSV M2-1 is the largest of the pneumovirus M2-1 proteins at 194 amino acids (table 1.2). The M2-1 proteins of APV subgroups A and C, hMPV and PVM are smaller, but similar in length at 186, 184, 187, and 176 amino acids, respectively. The level of amino acid identity (table 1.7) between the pneumoviruses is low (below 40%) apart from between APV subgroup C and hMPV (84%) and between APV subgroup A and APV subgroup C (70%) or hMPV (72%).
The M2-1 protein is produced from the first ORF of the M2 gene. The RSV M2-1 protein has been shown to be hydrophilic and basic (Collins and Wertz, 1985) and was characterized as the second RSV envelope-associated matrix protein (Huang et al., 1985). The RSV M2-1, L, N, P proteins and genome RNA have been shown to co-localize in cells (Garcia-Barreno et al., 1996; Li et al., 2008), suggesting a potential role for M2-1
protein. The expression of RSV M2-1 protein along with the N, P, L proteins and the genome RNA significantly enhanced viral full-length transcript production, suggesting that the M2-1 protein acts as a transcriptional elongation factor (Collins et al., 1995;
Collins et al., 1996; Fearns and Collins, 1999; Grosfeld et al., 1995; Yu et al., 1995).
The RSV M2-2 protein is 90 amino acid in length, similar to the 93 residue PVM M2-2 protein. In contrast, the M2-2 proteins of APV and hMPV are considerably shorter (71 or 73 amino acids, table 1.2). However, the M2-2 ORFs and proteins of the pneumovirus subfamily lack any significant sequence homology or amino acid identity, apart from hMPV and APV subgroup C that have a 64% nucleotide homology (table 1.8).
52 50
48 47
RSV
39 45
45 42
PVM
36 34
76 66
hMPV
36 34
84 65
APV subgroup
C
39 35
72 70
APV subgroup
A
RSV PVM
hMPV APV
subgroup C APV
[image:38.595.103.501.234.520.2]subgroup A
39 30
29 31
RSV
14 35
32 36
PVM
13 8
64 52
hMPV
16 8
56 49
APV subgroup
C
16 9
26 20
APV subgroup
A
RSV PVM
hMPV APV
subgroup C APV
subgroup A
Table 1.8 Percentage nucleotide homology and amino acid identity of the
pneumovirus M2-2 genes and proteins. The percentage homology of the M2-2 ORFs (green boxes) and percentage identity of the proteins (grey boxes) of RSV strain RSS-2, APV subgroup A isolate CVL141, APV subgroup C, hMPV isolate 001 and PVM strain 15 were compared as described in section 2.15.
growth and can be deleted from RSV to give a virus which is an attenuated in vitro and in vivo (Bermingham and Collins, 1999; Jin et al., 2000b). For hMPV, a deletion of the
M2-2 ORF in a recombinant virus resulted in an increased number of mutations to the genome, up-regulation of transcription, and attenuated growth in hamsters. As in RSV, the hMPV M2-2 protein appears to play a role in regulation of transcription (Schickli et al., 2008).
1.3.2.5 F protein
The F genes of the pneumoviruses are 1614 to 1725 nucleotides in length and have levels of nucleotide homology ranging from 45 to 70% (tables 1.2 and 1.9). As with the other APV genes, the highest levels of homology are seen between the APV subgroup C and the hMPV F genes. The Pneumovirinae F protein is a glycoprotein which is expressed as
a precursor F0 protein that is subsequently cleaved into two protein (F1 and F2). Disulfide
bonds covalently link the F1 and F2 proteins. The RSV F1 component is involved in
fusion of the virus envelope with the host cell membrane (González-Reyes et al., 2001;
Zimmer et al., 2002; Zimmer et al., 2001). Expression of the RSV F protein in
recombinant vesicular stomatitis virus has been shown to be sufficient for cell infection and fusion (Kahn et al., 1999).
The F protein is essential for virus growth and has several functions beyond cell fusion. The F protein may also be responsible for the host specificity human and bovine RSV. Recombinant bRSV viruses lacking the SH and/or G genes were shown to specifically infect bovine cells and similar recombinant RSV mutants to specifically infect human cells (Karron et al., 1997). Also the RSV F protein has been shown to have 15 heparin
binding domains (six in the F2 subunit and nine in the F1 subunit) that may be involved in
binding or infectivity of the virus (Feldman et al., 2000; Schmidt et al., 2004). The RSV
F protein is responsible for inhibition of T cell proliferation (Schlender et al., 2002;
Schlender et al., 2003). In human and bovine RSV, a 27 amino acid peptide that is
released upon cleavage of the F0 protein may play a role in immune evasion (Begona
52 47
45 46
RSV
40 47
45 45
PVM
33 37
70 65
hMPV
34 38
81 68
APV subgroup
C
34 37
67 72
APV subgroup
A
RSV PVM
hMPV APV
subgroup C APV
subgroup A
Table 1.9 Percentage nucleotide homology and amino acid identity of the
pneumovirus F genes and proteins. The percentage homology of the F ORFs (green boxes) and percentage identity of the proteins (grey boxes) of RSV strain RSS-2, APV subgroup A isolate CVL141, APV subgroup C, hMPV isolate 001 and PVM strain 15 were compared as described in section 2.15.
The active domains of the RSV F protein have been probed using deletion mutagenesis. In this way, it has been shown that the F protein can bind to the G protein independently of any SH protein being present and the domain responsible for binding has been
determined to be between amino acids 335 and 574 in the F1 subunit region of the F
protein (Schmidt et al., 2004). No information on the capacity of the APV F protein to interact with the G protein has been reported.
1.3.2.6 G protein
The G protein of the pneumoviruses varies greatly in length, from 236 and 298 residues for hMPV and RSV, respectively, to 585 residues for APV subgroup C. The APV subgroup C G protein is 194 residues and 196 residues longer than the APV subgroup A and subgroup B G proteins and has no more than 12% amino acid identity with any of the pneumoviruses (Govindarajan and Samal, 2004). Generally, for the virus sequences examined, there is a lack of significant nucleotide or amino acid homology between any of the G genes or proteins of the viruses of the pneumovirus subfamily (tables 1.2 and 1.10).
For RSV, the G protein is the viral attachment protein and has been shown to be a type 2 glycoprotein (Levine et al., 1987; Wertz et al., 1985). The search for a cellular receptor
has shown that the RSV G protein can bind to heparin and glycosaminoglycans (GAGs) at a heparin-binding domain (Feldman et al., 2000; Schmidt et al., 2004) and that the
hMPV G protein also binds cellular GAGs (Thammawat et al., 2008). The G gene has been deleted from recombinant RSV, resulting in a significantly attenuation virus (Bermingham and Collins, 1999; Teng et al., 2001). In a primary human epithelial
airway cell culture system, while the RSV F protein is the only required glycoprotein for infection, the G protein was found to be necessary for efficient spread of the virus (Mellow et al., 2004; Zhang et al., 2002).
Table 1.10 Percentage nucleotide homology and amino acid identity of the
pneumovirus G genes and proteins. The percentage homology of the G ORFs (green boxes) and percentage identity of the proteins (grey boxes) of RSV strain RSS-2, APV subgroup A isolate CVL141, APV subgroup C, APV subgroup D isolate Fr/85/2, hMPV isolate 001 and PVM strain 15 were compared as described in section 2.15.
immunomodulator or as a decoy for the immune system (Johnson and Graham, 1999; Johnson et al., 1998). Johnson et al. (2004) showed that the removal G protein did not
reduce vaccine-associated disease, but the removal did decrease vaccine protectivity. For APV, recombinant viruses have been created which lacks the G genes. It was found that APV lacking the G gene grew well in cell culture but was attenuated in turkeys (Ling
et al., 2008; Naylor et al., 2004). Similar results were seen with the hMPV recombinant
virus lacking the G gene (Biacchesi et al., 2005; Biacchesi et al., 2004b). The effects of
SH and G gene deletions on virus growth is further discussed in chapter 6.
1.3.2.7 SH protein
The SH protein of the pneumovirus subfamily, like the G proteins, vary greatly in length from 64 residues for RSV to 183 residues for hMPV (table 1.2) and have no significant nucleotide homology or amino acid identity (table 1.11). The function of the SH protein for the pneumoviruses is not well defined.
The RSV SH protein has been shown to be a type 2 integral membrane protein (Collins and Mottet, 1993; Feldman et al., 2001; Olmsted and Collins, 1989). Recombinant
viruses carrying a deletion in the SH gene have been shown to replicate in vitro and in vivo, though a recombinant RSV lacking the SH gene was attenuated (Bukreyev et al.,
1997). The deletion of the SH and/or G genes from an hMPV cloned virus was also carried out and gave the following results: the G deleted virus was not attenuated in vitro,
but was attenuated in hamsters, the SH deleted virus was not attenuated in vitro or in vivo, and the G/SH deleted virus was slightly attenuated in vitro and attenuated in
hamsters (Biacchesi et al., 2004a; Biacchesi et al., 2004b).
For APV, recombinant viruses has been created which lacks the SH gene or the SH and the G gene. It was found that APV lacking the SH gene showed a syncytial phenotype in cell culture. This virus also had attenuated growth in cell culture and in turkeys (Ling et al., 2008; Naylor et al., 2004). APV recombinant viruses are further discussed in chapter
13 21
20 13
RSV
5 24
22 21
PVM
5 10
46 37
hMPV
5 10
31 37
APV subgroup
C
12 7
17 22
APV subgroup
A
RSV PVM
hMPV APV
subgroup C APV
subgroup A
Table 1.11 Percentage nucleotide homology and amino acid identity of the pneumovirus SH genes and proteins. The percentage homology of the SH ORFs (green boxes) and percentage identity of the proteins (grey boxes) of RSV strain RSS-2, APV subgroup A isolate CVL141, APV subgroup C, hMPV isolate 001 and PVM strain 15 were compared as described in section 2.15.
1.3.2.8 M protein
The M proteins of the pneumovirus subfamily do not vary greatly in length (254 to 266 residues, table 1.2) and the levels of nucleotide homology and amino acid identity for the metapneumoviruses are high (67 to 76% and 72 to 84%, respectively, table 1.12). Little is known about the APV M protein, but for RSV the M protein was shown to be the matrix protein and to associate with the viral envelope (Peeples and Levine, 1979). The RSV M protein was found to associate with the RNP complex and may inhibit
transcription via association with the N-terminal 110 amino acids of the M2-1 protein (Ghildyal et al., 2002; Li et al., 2008). The M protein is also required for production of
infectious virus (Teng and Collins, 1998).
1.3.2.9 NS1 and NS2 proteins
The NS1 and NS2 genes are found only in PVM and RSV and no homologue has been found in the metapneumoviruses. The NS1 genes are 343 and 420 nucleotides for PVM and RSV, respectively, encoding proteins of 113 and 139 amino acids. The NS2 genes are 471 and 375 nucleotides (156 and 124 amino acids) respectively for PVM and RSV (table 1.2) and there is no detectable nucleotide homology or amino acid identity when comparing the NS1 or NS2 genes of RSV and PVM (table 1.13). For RSV, the NS1 protein has been shown to bind the M and P proteins in a two-hybrid system, but no interaction of NS2 with any other viral protein was found (Evans et al., 1996; Hengst and
Kiefer, 2000). The RSV NS1 and NS2 genes can be deleted from cloned virus and result in a virus that is attenuated in chimpanzees (Bermingham and Collins, 1999; Jin et al.,
2000b; Teng and Collins, 1999; Whitehead et al., 1999). Most interestingly, the RSV
NS1 and NS2 proteins have been shown to act together as mediators of resistance to the anti-vial interferon response and as inhibitors of interferon activation (Bossert and Conzelmann, 2002; Bossert et al., 2003; Schlender et al., 2000). As the
Table 1.12 Percentage nucleotide homology and amino acid identity of the
pneumovirus M genes and proteins. The percentage homology of the M ORFs (green boxes) and percentage identity of the proteins (grey boxes) of RSV strain RSS-2 , APV subgroup A isolate CVL141, APV subgroup B, APV subgroup C, hMPV isolate 001 and PVM strain 15 were compared as described in section 2.15.
[image:47.595.87.507.73.441.2]RSV PVM hMPV APV subgroup C APV subgroup B APV subgroup A 53 51 47 50 48 RSV 41 47 48 49 48 PVM 37 37 76 69 68 hMPV 37 37 87 67 70 APV subgroup C 35 37 72 73 71 APV subgroup B 36 37 76 76 84 APV subgroup A 29
Table 1.13 Percentage nucleotide homology and amino acid identity of the pneumovirus NS1 and NS2 genes and proteins. The percentage homology of the NS1 or NS2 ORFs (green boxes) and percentage identity of the proteins (grey boxes) of RSV strain RSS-2 and PVM strain 15 were compared as described in section 2.15.
PVM RSV
1.4 Virus transcription and replication
As with other viruses with RNA genomes, the same viral polymerase complex replicates the vial genome and transcribes the viral mRNAs. There is a lack of clarity as to how the polymerase complex switches from transcription to replication mode. For VSV it was shown that the extent of terminal complementarity, rather than the terminal sequences, determined the levels of replication and transcription. Replication of DI viruses with high complementarity was increased when compared to wildtype VSV (Wertz et al., 1994). For RSV the switch may involve several factors, including genome encapsidation, speed of processivity of the polymerase, and levels of the M2-2 accessory protein
(Banerjee et al., 1977; Cowton et al., 2006; Lippincott et al., 2001).
Purified RSV genome RNA is non-infectious and the minimal infectious unit has been shown to be the genome RNA together with the N, P and L proteins (Marriott and Easton, 1999). The key components in replication and transcription are the signalling sequences in the viral genome (the leader, trailer, gene start and gene end sequences), the N protein encapsidated negative sense RNA genome, the N protein encapsidated positive sense RNA antigenome, and the polymerase complex (consisting of the P and L proteins). The M2-1 and M2-2 proteins are non-essential accessory proteins that may affect
transcription and replication for some viruses.
1.4.1 Virus transcription
A model for APV transcription has been developed based on the well studied RSV, VSV and SeV models (reviewed in (Cowton et al., 2006))(figure 1.4). It has been established that the negative sense RNA viruses carry out sequential transcription of genes with a single point of initiation of transcription, proceeding from the 3’ to 5’ end of the genome (Abraham and Banerjee, 1976; Ball and White, 1976). Transcription by the viral
polymerase complex of the encapsidated RNA genome produces capped, poly-adenylated mRNA transcripts. These mRNAs are produced in a stop-start process, in which the viral polymerase complex starts transcription at the gene start (GS) sequence and transcribes the mRNA until it reaches the gene end (GE) sequence. The mRNA is then
(A)n
Cap
Gene start sequence
Gene end sequence
Figure 1.4 Model of Paramyxovirus transcription. In the model of Paramyxovirus transcription the viral polymerase complex (blue) binds to the 3’ end of the genome, begins transcription of the first gene at the gene start sequence and produces a capped (Cap) mRNA with a polyA tail ((A)n) added at the gene end sequence. The polymerase complex then either scans through the intergenic region and transcribes the next gene, or
disassociates from the genome and starts again at the 3’ end of the genome. In this way, a gradient of mRNA transcripts is produced.
(A)n
Cap
(A)n
Cap
(A)n
Cap
(A)n
Cap
(A)n
Cap
(A)n
Cap
(A)n
Cap
(A)n
Cap
(A)n
Cap
31
The polyadenylation of the mRNA is carried out by the viral polymerase, probably via a mechanism of ‘reiterative transcription’ at a series of U residues (Barr and Wertz, 2001). How and why the polymerase stops the iteration and releases the transcript is unknown. However, termination of the upstream gene must occur before re-initiation of
transcription of the downstream gene.
The re-initiation of transcription of the polymerase complex at downstream gene start sequence is relatively inefficient. Once the polymerase complex fails to re-initiate at the next available gene it disengages from the template and can only re-initiate by binding to the 3’ end of the genome RNA where the process begins again. The result is the
generation of a gradient of transcription where the steepness of the gradient is determined by the efficiency of the re-initiation event. Hence, the genes at the 3’ end of the genome are more frequently transcribed than those at the 5’ end of the genome.
1.4.2 Transcriptional regulatory sequences
When first sequenced, the discrete gene start (GS) and gene end (GE) sequences of parainfluenza virus type 3, a member of the Paramyxoviridae family, were said to
“almost invite foreign gene insertions.” (Brian Murphy, quoted by Schmidt et al.,
(2004)). Indeed, any gene flanked by the GS and GE signals can be transcribed (when present as negative sense RNA that is encapsidated with the viral nucleocapsid protein) by the viral polymerase.
AGGAyAArU GGGGCAAAUA GGGACAArUAAAA GGGACAAGU consensus AGGAUCAAU GGGACAAAAUG GAGACAAAUAACA AGGACCAAU L AGGAUGAGU GGGGCAAAUA GGGACAAGUAGUU GGGACAAGU G AGGACAAAU GGGGCAAAUA GGGAUAAAUGACA GGGACAAGU SH AGGAUAAGU GGGGCAAAUG GGGACAAAUCAUA GGGACAAGU M2 AGGAUAAAU GGGGCAAAUA GGGACAAAUAAAA GGGACAAGU F AGGACAAAU GGGGCAAAUA GGGACAAGUAAAA GGGACAAGU M AGGAUAAAU GGGGCAAAUA GGGACAAGUCAAA GGGACAAGU P AGGAUAAAU GGGGCAAAUA GGGACAAGUGAAA GGGACAAGU N AGGACAAGU GGGGCAAAUA N/A N/A NS2 AGGACAAGU GGGGCAAAUA N/A N/A NS1 PVM RSV hMPV APV GS sequence
Table 1.14 Pneumovirus gene start (GS) sequences. The source of the sequences by Genbank number is detailed in section 2.15. The non-consensus bases are indicated in bold and in blue. ‘r’ indicates a purine at this position and ‘y’ indicates a pyrimidine. All sequences are shown 5’ to 3’ mRNA sense.
For APV, hMPV and RSV, the GS sequences have a series of three G residues at the 5’ end (mRNA sense) and are A/G rich. The first seven bases of the metapneumoviruses APV and hMPV GS consensus sequences match exactly, although the pneumoviruses PVM and RSV GS sequences have no such degree of conservation. Mutational analysis of the APV GS sequence was carried out and it was shown that any mutation was detrimental to transcription, apart from a change of the C at position 5 to a U (Edworthy and Easton, 2005). Kuo et al. (1997) carried out mutational analysis of the RSV GS sequence, showing that mutations at positions 1, 3, 6, 7 and 9 resulted in loss of
expression from the associated gene, whereas mutations to position 5 were well tolerated. Interestingly, the RSV vaccine strain candidate cpts248/404 has been shown to have a mutation at position 9 (U to C, mRNA sense) of the M2 GS sequence and this mutation alone causes virus attenuation in mice (Whitehead et al., 1998). Taken together, this suggests that mutations in GS sequence mutations may attenuate virus in vivo via down
regulation of viral genes.
The GE sequences of the pneumovirus subfamily are less well conserved than the GS sequences (table 1.15), but are functionally important. For example, for RSV, the GS and GE signals of clinical isolates of RSV were compared and, while the GS sequences were conserved, the GE sequences varied. It was speculated changes in the GE sequence of the G gene down-regulated F protein expression (Moudy et al., 2003; Wertz and Moudy,
2004). Indeed, it has been shown that the GE sequence is necessary to terminate mRNA transcription and allow re-initiation at the downstream GS sequence. Loss of the GE sequence results in a high level of through mRNAs being produced and these read-through mRNAs do not produce protein efficiently from the second ORF (Kuo et al., 1996b).
UAGUUAA (n) 1-2 (A) n UAGUUA (n) 2-4 (A ) n AGUU (n) 3-4 (A) n AGU (n) 2-5 (A) n consen su s
UAGUUAA C AAAAAA
UAGUUA UU AAAAA
AGUU AAUU AAAAA
AGU UAAU AAAAA
L
UAGUUA
U
AU AAAAAAA
UAGUUA UUU AAAA
AGUU AAC AAAAAA
A
U
A AU AAAAAAA
G
UAGUUAA UU AAAAA
UAGUUA UAU AAAA
AGUU AUUU AAAAA
A
U
U UAAUU AAAAA
SH
UAGUUAA UG AAAA
UAGU
C
A UU AAAAA
AGUU AGU AAAAA
AGU UAAUU AAAA
M2
UAGUUAA C AAAAAA
UAGUUA AUU AAAAA
AGUU AAUU AAAAA
AGU UAUUU AAAA
F
UAGUUAA AU AAAA
A
AGUUA AU AAAAA
AGUU AUAU AAAAA
AGU CAAU AAAAAA
M
UAGUUAA UU AAAA
G
AGUUA AU AAAAAAA
AGUU UAAU AAAAA
AGU UAUG AAAAAA
P
UA
U
UUAA UU AAAA
G
AGUUA AU AAAAAAA
AGU
A
AUU AAAAAA
AGU AAUU AAAAAA
N UAGUUA U AG AAAAA UAGU A
A UUU AAAA
N/A
N/A
NS2
UAGUUAA UU AAAA
UAGUUA AUAU AAAA
N/A N/A NS1 PVM RSV hMPV APV
GE sequence Table 1.15 Pneumovir
u
s gene end
(GE) seq
u
ences
. The source of the sequences by Genbank
number is deta
iled in se
cti
on 2.15. The
non-consens
u
s bases are indic
at
ed in bold and in blue. ‘r’
indi
ca
tes a puri
n
e at this position and ‘y’
indica
tes a pyri
m
idine. A
ll sequenc
es
are shown 5’
to 3’
m
R
NA sense.
46 45 F-M2 17 53 G-F 612 60 G-L 2 44 SH-G 126 8 SH-G 12 9 M-SH 11 29 M2-SH 11 3 P-M 41 2 F-M2 11 1 N-P 34 2 M-F 4 26 NS1-N 8 1 P-M 8 19 NS1-NS2 2 3 N-P PVM RSV IR length hMPV APV IR length
37 suggesting that there is a great degree of tolerance of sequence variation in these regions of the genome (Kuo et al., 1996a). The intergenic regions of APV, hMPV and PVM are similarly divergent, ranging from 1 to 60 nucleotides for APV, 2 to 189 nucleotides for hMPV, and 2 to 56 nucleotides for PVM (table 1.17).
Looking specifically at the Le sequence and initiation of transcription at the 3’ end of the genome, two models have been proposed. The first, supported by work done on SeV and other paramyxoviruses, suggests that the viral polymerase complex initiates transcription at the 3’ end of the genome, transcribing until the polymerase complex recognizes the first GS sequence and then releasing a short leader RNA before beginning transcription of the first gene. The second model, supported by work done on VSV and other
rhabdoviruses, proposes that the polymerase complex initiates transcription directly at the GS sequence, without producing an mRNA from the leader region. A consistent feature of both models is that there are regions of leader sequence that are required for
transcription and that the polymerase complex binding sequence is contained within the first 11 nucleotides of the leader region (Cowton et al., 2006).
1.4.3 Virus replication
The model for replication of the negative sense RNA virus genome (figure 1.5) utilizes the same viral polymerase complex as is used for viral transcription. However, during replication, when the polymerase binds to the 3’ terminus leader region of the genome, the polymerase commences transcription of the genome immediately and fails to recognize any of the transcription signals. In this way, an ‘antigenome’ copy of the genome is created and immediately encapsidated with N protein (Cowton et al., 2006). This antigenome has been shown to be a necessary intermediate to genome replication, as the template from which new genomes can be copied (reviewed in (Banerjee et al., 1977)).
1.4.4 Replication regulatory sequences