University of Warwick institutional repository: http://go.warwick.ac.uk/wrap This paper is made available online in accordance with
publisher policies. Please scroll down to view the document itself. Please refer to the repository record for this item and our policy information available from the repository home page for further information.
To see the final version of this paper please visit the publisher’s website. Access to the published version may require a subscription.
Author(s): Stewart, Neil; Brown, Gordon D. A.; Chater, Nick Article Title: Absolute Identification by Relative Judgment Year of publication: 2005
Link to published version: http://dx.doi.org/10.1037/0033-295X.112.4.881
Running Head: RELATIVE JUDGMENT MODEL
Absolute Identification by Relative Judgment
Neil Stewart, Gordon D. A. Brown, and Nick Chater University of Warwick, England
Abstract
Absolute Identification by Relative Judgment
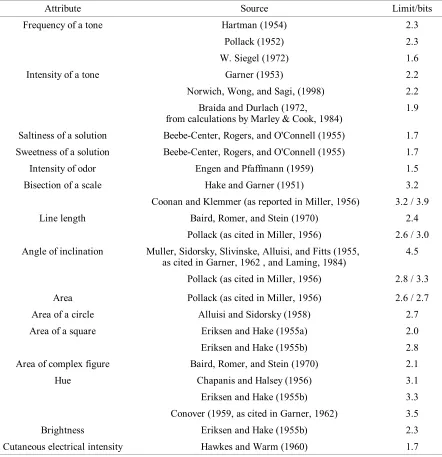
Miller (1956) drew attention to a curious phenomenon. People have great difficulty identifying stimuli from a set that varies along a single psychological continuum, even though their ability to discriminate pairs of stimuli from the set suggests that they should be very good at the identification task. This phenomenon can be seen across a wide range of stimulus
attributes - the frequency and loudness of tones, the strength of tastes and smells, the magnitude of lengths and areas, the hue and brightness of colors, and the intensity and
numerousness of cutaneous stimulation - suggesting some common and fundamental source of the limitation.
In an absolute identification task, participants are required to identify, with a unique label, stimuli drawn from a set of items that vary along only a single continuum. Typically, stimuli are evenly psychologically spaced. A stimulus's label is normally its ordinal position within the set. Three key phenomena, which we review in more detail below, are observed. First, there is a severe limit in the information transmitted from stimulus to response (i.e., the size of the set for which members can be identified perfectly) even when adjacent stimuli are perfectly discriminable. Second, a bow effect is observed when identification accuracy is plotted against stimulus, with an advantage for the smallest and largest stimuli. Third, there are strong sequential effects, whereby the stimuli on previous trials exert a strong bias on the response to the current stimulus.
sequential effects has not been achieved."
Here, in contrast to existing models (excepting Laming, 1984), we offer a relative judgment model (RJM) of absolute identification. The RJM does not utilize long-term representations of absolute magnitudes. Instead, the difference between the current stimulus and the previous stimulus is used, in conjunction with the feedback from the previous trial, to generate a response. Thus, the magnitude of the current stimulus is judged relative to the magnitude of only the immediately preceding stimulus (hence the name RJM). In this article, we review existing models of absolute identification and show that none offers a complete account of the phenomena described above. We then show that the RJM offers a unified account of these phenomena, and present new experimental evidence that supports the model. We begin with a review of the key empirical results.
Empirical Results in Absolute Identification Information Transmission Limit
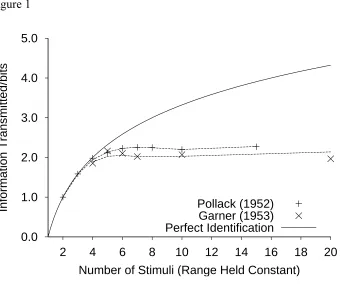
Using multivariate information transmission as a dependent variable (McGill, 1954), it is possible to measure the information transmitted1 in an absolute identification task. If
the information transmitted from stimulus to response does not continue to increase. Although an increase in the range of stimuli (number held constant), and hence the separation of the stimuli, will produce an initial increase in information transmitted, the increase is a negatively accelerated function of range, and quickly reaches an asymptote once adjacent stimuli are discriminable (Alluisi & Sidorsky, 1958; Braida & Durlach, 1972; Eriksen & Hake, 1955a; Pollack, 1952).
Bow or Edge Effects in the Serial Position Curve
When accuracy is plotted as a function of the rank of the stimulus within the stimulus set, a characteristic bow is observed in the resulting serial position curve (e.g., Kent & Lamberts, in press; Lacouture & Marley, 2004; Murdock, 1960; W. Siegel, 1972). Performance on stimuli at the ends of the range is better than performance on mid-range stimuli even though, when presented in isolation, any two adjacent stimuli may be perfectly discriminable. As for information transmission, once stimuli are pairwise perfectly
discriminable, increased spacing of items leads, at best, to only slight improvements in accuracy (Braida & Durlach, 1972; Brown, Neath, & Chater, 2002; Gravetter & Lockhead, 1973; Hartman, 1954; Lacouture, 1997; Luce, Green, & Weber, 1976; Pollack, 1952). Figure 2 shows the very similar stimulus-response confusion matrices obtained by Brown et al. (2002) for absolute identification of tones varying in their frequency. Tones were
geometrically spaced, with each tone a constant ratio higher in frequency than the immediately lower tone. (Following Weber's Law, geometric spacing is typically used to produce stimuli that are presumed to be equally psychologically spaced.) Each confusion matrix is for a
different stimulus spacing (from 420 - 563 Hz in the narrow spacing condition to 363 - 652 Hz in the wide spacing condition). As Figure 2 shows, increasing the stimulus spacing had almost no effect on performance.
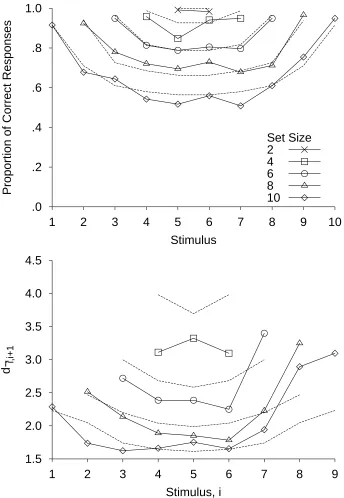
1995; Pollack, 1953; W. Siegel, 1972; Weber, Green, & Luce, 1977). Figure 3 shows the serial position curves obtained by Lacouture and Marley (1995; see also Kent & Lamberts, in press; Lacouture, Li, & Marley, 1998) for different stimulus set sizes, with a larger bow effect for larger set sizes. Note that although Stimuli 5 and 6 can be nearly perfectly discriminated when they constitute the entire stimulus set, performance on these same stimuli drops
considerably when they are identified within a larger stimulus set. Simply shifting all the stimuli along the dimension, so that each stimulus increased in value by a constant multiplicative factor, has no effect on the accuracy against stimulus magnitude curve (Lacouture, 1997). The bow effect remains even after extensive practice, although small improvements in accuracy are observed (Alluisi & Sidorsky, 1958; Hartman, 1954; Weber et al., 1977; but see Rouder, Morey, Cowan, & Pfaltz, 2004, for a larger practice effect). The bow effect is greatly reduced by correcting for the asymmetry of errors on extreme verses interior stimuli (Weber et al., 1977), suggesting that the restricted opportunity to make errors at the ends of the range is a major factor underlying the bow effect (see also Eriksen & Hake, 1957). The bow effect is not due to response bias (at least, not response bias alone). In data where end responses are not used more frequently than central responses, the effect is still observed (W. Siegel, 1972). In our data from Experiment 1, the bow is observed although there is a bias against responding with extreme categories.
Sequential Effects
We know of no absolute identification experiment where strong sequence effects (where the response to the current stimulus is shown to depend on previous stimuli and responses) are not found. Of course, when performance in an absolute identification task is perfect, then there are no sequential dependencies. Thus the existence of sequential
dependencies is likely to provide a useful insight into processing in an absolute identification task.
shown to be assimilated to the immediately preceding stimulus (Garner, 1953; Holland & Lockhead, 1968; Hu, 1997; Lacouture, 1997; Lockhead, 1984; Long, 1937; Luce, Nosofsky, Green, & Smith, 1982; Petrov & Anderson, in press; Purks, Callahan, Braida, & Durlach, 1980; Rouder et al., 2004; Staddon, King, & Lockhead, 1980; Stewart, 2001; Ward &
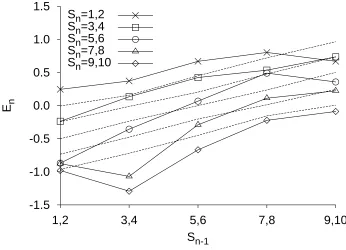
Lockhead, 1970, 1971). In other words, participants are systematically biased to respond as if the current stimulus is nearer to the previous stimulus than it actually is. Figure 4 shows data from the feedback condition of Ward and Lockhead's (1970) absolute identification
experiment. Stimuli were tones varying in loudness. The average error in responding on the current trial is plotted for each stimulus as a function of the stimulus on the previous trial. When the current stimulus is greater than the previous stimulus, the error is negative (i.e., the stimulus is underestimated); when the current stimulus is less than the previous stimulus, the error is positive. The five lines are approximately parallel, with positive slopes, demonstrating that assimilation takes place for all combinations of current and previous stimuli (Lockhead, 1984). Assimilation to preceding items is also observed in magnitude estimation tasks (e.g., Jesteadt, Luce, & Green, 1977), in matching tasks (Stevens, 1975, p. 275), and in relative intensity judgment tasks (Lockhead & King, 1983).
numbers of intervening trials.
In the experiments on sequence effects discussed so far stimulus, response and feedback are all highly correlated. Which of these is the basis for assimilation (and contrast)? We focus on this question for the remainder of this section.
The sequence effects observed are dependent on the quality of stimulus presentation. Ward and Lockhead (1971) examined performance in a standard absolute identification experiment using line length. When task difficulty was increased, by reducing the luminance and duration of line length presentations, more assimilation was observed. In the difficult condition, accuracy was low and therefore the correlation between stimuli and responses was reduced. Assimilation was demonstrated only to the previous stimulus and not the previous response. This suggests that assimilation to the previous response is only normally observed because the response is correlated with the previous stimulus (see also Garner, 1953; McGill, 1957; Mori, 1998).
Ward and Lockhead (1971) also observed assimilation to the previous trial's feedback but not to the previous response in a guessing task (although there was slight evidence of a small contrast effect to responses further back in the sequence). The guessing task was identical to an absolute identification experiment, except that the stimuli were omitted, and therefore the stimuli could not have been the cause of the assimilation observed. As the task was guessing, there was no correlation between the feedback and the responses. Thus the observation of sequential effects only for the previous feedback but not the previous response in a task where the two are not correlated, also suggests that previous responses are not the locus of sequential effects.
Manipulating the Sequence in an Absolute Identification Task
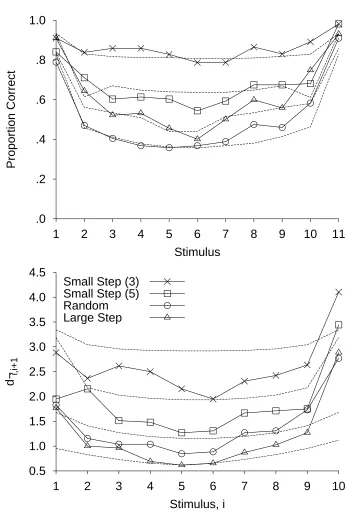
was constrained so that the current stimulus was either identical to, one step softer than, or one step louder than the previous stimulus. This condition was called the small step (3) condition, because the current stimulus was chosen from one of three stimuli centered on the previous stimulus. In the small step (5) condition, the current stimulus was selected from five adjacent intensities centered on the previous stimulus. In the random condition, the sequence was random. In the large step condition, the current stimulus was at least four stimuli different from the previous stimulus. For all four sequence types, each intensity was equally frequent over the course of the whole experiment. From the identification confusion matrix a measure of the confusability, d´i, i + 1, of each loudness i with the adjacent loudness i + 1, was obtained.
This method of analysis allows comparison of identification performance free from
contamination by constraints imposed by the control of the sequences in each condition.2 (The
procedure for calculating d´i, i + 1 is given in Appendix A.) When d´i, i + 1 is plotted against
stimulus magnitude, each condition shows a characteristic bow, with poorer performance for the middle of the range of signals (see the bottom panel in Figure 6). The key result is that the curves lie one above the other, such that tones are more confusable in the conditions where the step size is larger: In order of decreasing identification performance, the curves are small step (3), small step (5), random step, and large step. Smaller transitions seem to lead to higher accuracy (see also Hu, 1997, and Petzold and Haubensak, 2001, for similar findings). (The top panel of Figure 6 shows the corresponding bows in the accuracy serial position curves. Here the ordering of the large step and random conditions is reversed, with better performance in the large step condition because of the restricted possibility for making mistakes imposed by the restricted set of possible responses on each trial.) Further work (Nosofsky, 1983a), testing alternative hypotheses, is consistent with the idea that smaller transitions lead to higher
accuracy.
Existing Models of Absolute Identification
identification data. The extant models can be divided into four main classes: (a) models where memories of recent stimuli are assimilated (Holland & Lockhead, 1968; Lockhead & King, 1983), (b) modified Thurstonian models (Braida et al., 1984; Durlach & Braida, 1969; Purks et al., 1980; Luce et al., 1976; Treisman, 1985), (c) limited response or processing capacity models (Lacouture & Marley, 1991, 1995, 2004; Laming, 1984, 1987; Marley & Cook, 1984, 1986), and (d) exemplar models (Brown et al., 2002; Kent & Lamberts, in press; Nosofsky, 1997; Petrov & Anderson, in press). Below, we briefly review each of these models and consider which of the phenomena outlined (limit in information transmitted, bow effects, and assimilation and contrast) are and are not accounted for by each model. Table 2 gives an overview of the scope of these models. Two themes emerge from this review. First, there are two different types of explanation as to why increasing the range of stimuli does not increase information transmitted. Some models assume a perceptual locus and others assume the limit lies in the response process. The second theme is that current models which assume that long-term representations of absolute magnitudes are the basis for absolute identification do not provide a full account of sequential effects.
Assimilation models
Holland and Lockhead (1968). In Holland and Lockhead's (1968) model, participants are assumed to generate a response by adding the judged distance between the current
stimulus and the previous stimulus to the feedback from the previous trial. Assimilation and contrast are accounted for in terms of the contamination of the representations of the absolute magnitudes of stimuli. Specifically, the memory of the previous stimulus is assumed to be contaminated by the memories of earlier stimuli.
Of the phenomena outlined above, Holland and Lockhead's (1968) model accounts for assimilation and contrast, but only on average. For example, consider a low magnitude
its magnitude will be an overestimate. This will cause the difference between the current and previous stimuli to be underestimated on average (as the current stimulus is also likely to be larger than the previous stimulus), and lead to the current response being biased towards the previous stimulus (i.e., assimilation). Contrast also follows: on average the current response is biased away from stimuli two or more trials ago because these stimuli are, on average, greater in magnitude than the (low magnitude) stimulus on the immediately preceding trial. However, a detailed examination reveals this account to be unsatisfactory. Typically, assimilation is observed for all combinations of current and previous stimuli (e.g., Ward & Lockhead, 1970; our Experiment 1). Holland and Lockhead's model predicts contrast in some cases. For example, consider the case in absolute identification of 10 stimuli with Stimulus 3 on the preceding trial followed by Stimulus 2 on the current trial. The confused representation of Stimulus 3 will be an overestimate (as earlier stimuli are likely to have been larger), and thus the difference between the current stimulus and the previous stimulus will be overestimated. This produces a contrast effect where assimilation is observed. In addition to this difficulty for the model, Holland and Lockhead give no account of the other phenomena listed in Table 2.
Lockhead and King (1983). In Lockhead and King's (1983, see also Lockhead, 1984) model, two assumptions are made: (a) that successive stimuli assimilate in memory; (b) that people compare each new stimulus to a collection of stimulus memories to determine a response. No psychological mechanism is chosen to motivate these assumptions, "the focus here is on a simple equation to fit the data" (Lockhead, 1984, p. 44). The equation is
Rn=Sna1SnSn1a2SnSn2a3SnSn3...
where Rn is the response on trial n, Sn is the stimulus on trial n, a1 < 0 for assimilation to Sn - 1,
a2 > a3 > ... > 0 for decreasing contrast to less recent stimuli, and is a noise term. Although
or the bow effect.
Modified Thurstonian Models
In a Thurstonian account, presentation of a stimulus results in perception of an absolute magnitude, represented as a noisy value on an internal sensory scale. Criteria, or bounds, divide this scale into response categories. The criteria provide a long-term frame of reference for absolute magnitudes. There are important multidimensional extensions of this idea (e.g., Ashby & Townsend, 1986). The source of variability in responding in the standard Thurstonian model is the noise in the representation of the stimulus on the internal sensory scale.
A simple Thurstonian model can offer some account of the limit in information transmitted as the number of stimuli is increased with the range held constant (the "Range constant" columns in Table 2): As the number of stimuli is increased, the bounds will become closer together, and the fixed magnitude noise on the sensory scale means that a stimulus is more likely to be classified incorrectly. The bow effect can also be explained because there is a limited ability to make mistakes for stimuli at the edges of the range. For example, if the smallest magnitude stimulus is greatly underestimated, then it will still be correctly classified into the first category. The invariance of these phenomena as range is increased (the "N
constant" columns in Table 2) and an account of sequential effects require further modification of the model. We evaluate three modifications below.
Durlach and Braida (1969). Durlach and Braida (1969) modified the simple
subject to determine the context precisely and his inability to determine or represent the relation of the sensation to this context precisely" (p. 374). The standard deviation of the context-coding noise is assumed to be proportional to the range of the stimuli, though no psychological motivation is given for this assumption. The inclusion of a source of variability that grows with the stimulus range allows Durlach and Braida's (1969) preliminary theory of intensity resolution to account for the invariance of the absolute identification phenomena as range is increased (either by increasing the number of stimuli with the spacing held constant or increasing the spacing).
To account for the bow effects, Braida et al. (1984) suggested that the general context is set by two anchors at either end of the range. A stimulus is compared to the general context by counting steps (which are some proportion of the distance between the anchors) using a noisy measurement unit. Thus, there is less variability for stimuli near one of the anchors, as a small number of steps is small, and thus the cumulative error is small.3
No mechanism is offered to account for sequential effects. However, Purks et al. (1980) suggest that the distributions that represent signals are unaffected by the location of the previous signal, but that the category boundaries are. By partitioning their data by the previous signal, and fitting a Thurstonian decision bound model to each partition, Purks et al.
demonstrate that the separation between signal distributions was unaffected, but the locations of decision boundaries were, being shifted away from the previous signal. The next
modification of the simple Thurstonian model extends this idea.
sensory inputs, motivated by the assumption that criteria will be adjusted to maximize information transmitted. Tracking shifts are larger in magnitude than stabilizing shifts, but decay more quickly. Thus, Treisman's model predicts assimilation to the immediately preceding stimulus, when tracking shifts will dominate, but contrast to less recent stimuli, when stabilizing shifts will dominate. However, this account does not fully explain the sequential biases. Treisman (1985, p. 192) states that the magnitude of criteria movement decreases with the distance of the criteria from the stimulus. Therefore, the model would be expected to predict greater assimilation where previous and current stimuli are similar. However, assimilation is greater where stimuli differ more, rather than less (see, e.g., Figure 4). For the same reason, Treisman's model predicts that the error in responding should be greater if the previous and current stimuli are similar: Luce et al. (1982), Nosfosky (1983), Hu (1997), and Rouder et al. (2004) found the opposite result.
The magnitude of the stabilizing shift is, unlike tracking shifts, not fixed, but instead proportional to the distance between the sensory input and the nearest criterion. The
magnitude of stabilization is thus proportional to the inter-criterion distance and therefore also proportional to the range. This allows Treisman's (1985) model to explain why increasing the range of stimuli does not increase information transmitted. But it also means that as the range is increased, stabilization should come to dominate, predicting a change in the pattern of assimilation and contrast which is not observed (e.g., Experiment 1 below).
in a less variable Thurstonian representation than those that do not. As the stimulus range is increased, the probability of stimuli falling inside the fixed width band is reduced, causing a reduction in identification performance. This allows the model to predict a limit in
performance as stimulus range is increased. With the additional assumption that the attention band dwells at the edges of the range of stimuli, bow or edge effects are accounted for, although no motivation for this assumption is given. The further assumption, that attention tends to dwell on the location of the last stimuli, explains the finding that there is typically reduced variation in responding when the previous stimulus is similar to the current stimulus (e.g., Luce et al., 1982). However, the attention band model does not offer an account of the systematic bias in responding to the current stimulus by preceding stimuli (i.e., assimilation and contrast).
Restricted Capacity Models
Cook, Lacouture, and Marley have presented three models of absolute identification that account for limits on information transmitted and bow effects by assuming a limited capacity process in either memory or response processes (not perceptual processes). These models can account for limits in performance as stimulus range is increased because they do not assume that the limit in information transmitted is perceptual.
Marley and Cook (1984, 1986), Karpiuk, Lacouture, and Marley (1997). In Marley and Cook's (1984, 1986) models, perception is assumed to be absolute, with the location of the stimulus represented accurately on a Thurstonian continuum. The exact location on the continuum is unavailable to the response process, and must be deduced by comparing the stimulus to the context in which it is presented. Marley and Cook assume that the context, which comprises a set of elements, must be rehearsed. Each element's activation is
elements is derived by summing the activation of the elements between the stimulus and known anchors (cf. Braida et al., 1984). The anchors are assumed to be at or outside the location of the extreme stimuli. Marley and Cook (1984) show that, under these assumptions, the variability of the total activity of elements to one side of the stimulus increases with the number of elements.
Marley and Cook (1984) demonstrated that the model can account for: (a) the
asymptote in information transmission as stimulus range increases, with the number of stimuli held constant, or as the number of stimuli increases, with the spacing held constant; and (b) the bow effect. Karpiuk et al. (1997) extended the model to predict reaction time distributions. Marley and Cook provide no account of the sequential effects observed. Marley and Cook also point out that, if their model were extended to provide the necessary account by assuming the range of the rehearsal is determined by the immediately preceding context, it is not clear how it could explain assimilation and contrast without a further addition to the model.
Lacouture and Marley (1991). Lacouture and Marley (1991) demonstrated that a simple network model could provide a reasonable account of the limit in information
transmitted. The model was a three layer feed-forward network that learned by mean-variance back-propagation of error. Input vectors of adjacent stimuli overlapped. For example, if Stimulus 5 was presented, input unit 5 would be activated, but neighboring hidden units, 4 and 6, would also be activated to a lesser extent. The model predicts the limit in information transmitted when the number of hidden units is one, although the observed characteristic shape of the information transmitted against set size (see our Figure 1) is not well reproduced. The model does however produce a good fit to Braida and Durlach's (1972) data, where
information transmitted was measured as stimulus range was varied (with set size held constant). Modeling of bow and sequence effects is not described. The model could not
immediately preceding stimuli.
Lacouture and Marley (1995, 2004). Lacouture and Marley's (1995, 2004) mapping model is a feed-forward network with one single input unit, one single hidden unit, and an output unit for each response. The activation of the input unit represents the magnitude of the stimulus. Perception is assumed to be noisy and repeated presentation of the same stimulus does not always lead to the same activation. The hidden unit normalizes this activation using a lower and an upper anchor value so that the resulting activation falls within the range 0 to 1. Fixed magnitude noise which represents a noisy mapping process is then added, resulting in a limited channel capacity. With a large number of stimuli, the resulting set of possible mean hidden unit activations will be closer together than for a smaller set and, thus, the fixed magnitude noise will have a greater effect on performance for larger sets. The mapping of the hidden unit activation onto output units acts to partition the unit interval into response categories. For each output unit, activation is accumulated over the course of the trial, with the corresponding response being emitted once the accumulator reaches a given threshold (Lacouture & Marley, 1995). The assumption of repeated intra-trial sampling of the output units allows the model to predict response times as well as accuracy, providing an extension over previous models. Lacouture and Marley (2004) replace the accumulator and threshold with a leaky, competing accumulator (Usher & McClelland, 2001) to capture full correct response time distributions.
the model to account for sequential effects: (a) Instead of normalizing hidden unit activation by using two anchor values, previous stimulus values could be used. (b) Hidden unit
activations may be contaminated with hidden unit activations from previous stimulus
presentations. (c) The leaky competing accumulators may begin each trial with some residual activation carried over from previous trials.
Laming's (1984, 1997) Relative Judgment Model
Laming (1984) describes a model that accounts for the limit in information
transmission and the effects of constraining possible jump sizes between successive stimuli (i.e., Luce et al., 1982). The crucial assumption in Laming's model is that all judgments are relative to the immediate preceding context (i.e., that it is the differences between successive stimuli that are used, not the absolute magnitudes of the stimuli). Further, Laming proposes that such relative judgments are limited. Specifically, Laming suggests that the current stimulus can be judged as 'much less than', 'less than', 'equal to', 'more than', or 'much more than' the previous stimulus. This judgment limit provides a limit in the information transmitted. Numerical estimates of the stimulus magnitudes are assigned such that they follow the same pattern. If the difference between stimuli is judged as 'less than', for example, then the number assigned to the estimate of the magnitude of the current stimulus is less than the estimate of the magnitude of the previous stimulus. The ordering of Luce et al.'s (1982) conditions is also explained by Laming's model. Laming shows that the variability in responding depends mainly on the mean squared jump sizes in the sequence and, as jump size predicts perfectly the ordering of performance in Luce et al.'s conditions, so does Laming's model.
Exemplar Models
Exemplar models (Medin & Schaffer, 1978; Nosofsky, 1986) assume a long-term memory for each stimulus's magnitude, together with the label associated with that stimulus. On presentation of a stimulus, the probability of a given response is given by similarity of the presented stimulus to the memory of the stimulus associated with that response divided by the summed similarity of the presented stimulus to each stimulus memory.
Brown, Neath, and Chater (2002). Brown et al.'s (2002) model of scale-invariant memory, perception and learning (SIMPLE) has been applied to absolute identification data (as well as free, serial, and probed recall memory tasks). The model is an exemplar model of absolute identification, and is equivalent to the generalized context model (Nosofsky, 1986) in its application to absolute identification.
Exemplar models of absolute identification provide a reasonable account of bow effects. Bow effects are accounted for because items at the end of the range have fewer similar neighbors to be confused with. However, exemplar models do not predict the gradual bowing that is typically observed: Instead, all items tend to show almost identical levels of
performance, except for superior performance on the very edge items. It is possible to provide a better fit by biasing the responses associated with more extreme stimuli. However, this bias for extreme responses is at odds with the central tendency in responding that is typically observed. Further, as described above, the bow effect is still observed in data where each response is used equally often (W. Siegel, 1972) or where middle responses are used more often (see Experiment 1).
Exemplar models face a further problem. Recall that increasing the spacing of stimuli does not remove the bow effect, and leads only to a slight improvement in accuracy. Exemplar models, however, predict a large improvement in accuracy, as items become more
invariant under stimulus range. Exemplar models do not predict any curves in d' without further assumptions.
In their simplest form, exemplar models offer no account of sequence effects. When adapted to predict sequence effects, typically by assuming more recent exemplars are more available in memory and/or weighted more heavily in the subsequent decision process (e.g., Nosofsky & Palmeri, 1997; see also Elliott & Anderson, 1995) the models do not correctly predict sequence effects observed in classification (Stewart and Brown, 2004; Stewart, Brown, & Chater, 2002). Increased weighting of more recent items will make a prediction similar to assimilation, as repetition of the previous response will be more likely. However, the criticism applied to the Thurstonian models above applies: An increased probability of
repetition is not equivalent to assimilation. Further, this modification will provide no account of contrast.
Nosofsky (1997). Nosofsky (1997) applied Nosofsky and Palmeri's (1997) exemplar-based random walk model, which is an extension of the generalized context model (Nosofsky, 1986), to predict responses and reaction times in absolute identification. Stimuli are
represented by normal distributions on a psychological continuum, with stimuli at the edges of the range assumed to be less variable. In this way, an account of bow or edge effects is built into the model. On presentation of a test item, the model assumes memories race to be retrieved. The probability of a memory being retrieved at a given time is a function of the exemplar's similarity to the test item, and the exemplar's strength in memory. Once an item is retrieved, a counter for the associated category label is incremented and all others
decremented. The remaining items then race again. When any counter falls too low, the response associated with the counter leaves the race. When a counter reaches a given
when stimulus range is altered.
Petrov and Anderson (in press). Petrov and Anderson (in press) present a scaling model (ANCHOR) based on the ACT-R architecture (Anderson & Lebière, 1998) that they apply to absolute identification and category rating. The perception of the absolute magnitude of a stimulus is compared to anchors or exemplars stored in memory. Perception is assumed to be stochastic. The selection of exemplars is also stochastic, and depends upon the similarity between the exemplars and the target stimulus and also upon the frequency and recency with which each exemplar was previously used. Exemplars compete for selection. One exemplar is selected and the associated response is retrieved. If there is a discrepancy between the
exemplar magnitude and the percept magnitude, then an adjustment is applied to the response to correct it either up or down. The system is adaptive and, after feedback, the location of the associated exemplar is assimilated towards the percept.
Petrov and Anderson fitted the model to their own data from an absolute identification of nine stimuli. The model was able to fit simultaneously the information transmitted, central tendency in responding, assimilation (on average), and a small practice effect. The model did not predict bows in d', but was able to predict an accuracy advantage for end stimuli because of the limited opportunity for errors at the ends of the range.
Petrov and Anderson did not model the effect of increasing the number of stimuli (with the range held constant) or the range of the stimuli (with the number held constant) and, thus, it is uncertain whether the model could account for the effects of these variables. However, the model does include noisy components that are independent of the spacing of the stimuli, and so it may well be able to account for the effects without modification.
as best fitting their data and ran 200 simulations of 450 trials. Although ANCHOR does predict assimilation on average, it does not predict the detailed pattern that is normally observed (e.g., Figure 4 and Experiment 1) in which assimilation increases as the difference between the previous and current stimuli increases. In ANCHOR, sequential effects are caused by exemplars being weighted by their recency of use. Thus, ANCHOR fails to predict the more detailed pattern of assimilation for the same reason as Treisman (1985) and Luce et al.'s (1976) models: Predicting that the response associated with the previous stimulus is more likely to be repeated is not the same as predicting that the current response will be biased towards the previous stimulus. Further, the model does not predict contrast to stimuli at lags of 2 or greater, and instead predicts assimilation to stimuli at these lags.
Motivation of the Relative Judgment Model
Having reviewed the key empirical phenomena and the existing models of absolute identification, we next lay out the motivation for the RJM. We have made two main choices in developing the RJM. First, we assume that the locus of the limit in performance is not
perceptual but judgmental. Second, we assume that judgment is relative and not absolute. We give our motivation for these assumptions below.
The Locus of the Effects is Not Perceptual
As we have reviewed above, as the range of the stimuli is increased, performance quickly reaches asymptote (Braida & Durlach, 1972; Brown et al., 2002; Eriksen & Hake, 1955a; Gravetter & Lockhead, 1973; Hartman, 1954; Luce et al., 1976; Pollack, 1952). Further, stimuli that can be identified perfectly when presented in isolation are poorly
mapping model makes the same assumption. They assume that stimulus magnitudes are scaled onto a hidden unit activation which ranges over the unit interval and that constant variance noise (completely independent of the stimulus range) is responsible for the limit in capacity. In the RJM, in assuming that mapping rather than perceptual noise is responsible for the limit in capacity, we do not require any additional assumptions to explain the lack of an improvement in performance when stimulus range is increased.
One reason for this approach is parsimony. As described above, the limit in information transmitted is approximately constant across a wide range of stimulus types (see Table 1; Miller, 1956; Garner, 1962; Laming, 1984). The differences in the exact amount of information that can be transferred are perhaps less important that the fact that the limit in channel capacity seems to be generally so low. Miller (1956, p. 86) concludes, "There seems to be some limit built into us either by learning or by the design of our nervous system, a limit that keeps our channel capacities in this general range." The fact that similarly low limits in channel capacity are found across such a wide range of stimulus attributes suggests that there is a common cause to this limitation, especially as the same bow and sequential effects are observed across the same wide range. Of course, it could be that this cause is duplicated across the different sensory apparatus used in each task. But a more parsimonious explanation is that the cause resides not in the perceptual system, but in the judgment system responsible for producing responses.
Relative Rather than Absolute Judgment
sequential effects has also eluded exemplar models, where the weighting of recent exemplars and the updating of their locations from trial to trial has also failed (Petrov & Anderson, in press). Here, we propose that these models find accommodating sequential effects difficult because they are based on the assumption that long-term absolute magnitude information is the basis for absolute identification performance. In the Thurstonian models, the position of the criteria provide long-term absolute magnitude information. In the Lacouture and Marley's (1991, 1995, 2004) connectionist model, long-term absolute magnitude information about the most extreme stimuli is used in rescaling each stimulus magnitude. In the exemplar models, the memory for the magnitude of each exemplar provides long-term absolute magnitude
information. It may be that some future modification of these models would allow them to fully predict the pattern of sequential effects, but in the RJM we show how these sequential effects follow naturally from a relative judgment account.
J. A. Siegel and W. Siegel (1972) review evidence that long-term representation of attributes such as pitch and loudness may be very poor: Memory for pitch, as measured in a same-different judgment task, decays very rapidly with the duration of tone or unfilled interval between the standard and comparison tones (Bachem, 1954; Harris, 1952; Kinchla & Smyzer, 1967; Koester, 1945, as cited in Massaro, 1970, and Wickelgren, 1966; König, 1957; Tanner, 1961; Wickelgren, 1966, 1969; Wolfe, 1886, as cited in Massaro, 1970, and Wickelgren, 1966). Massaro (1970) found that, if the intervening tone was similar to the standard, this disrupted judgment further. In their review article, J. A. Siegel and W. Siegel conclude that the limit in absolute identification performance "is not limited by stimulus information, but rather by subjects' inability to maintain multiple representations of sensory stimuli in memory" (p. 313). If a long-term representation of the absolute magnitude of a stimulus cannot be
across the (on average) larger number of intervening trials in an absolute identification experiment.
In the RJM, we instead suggest that, in the absence of stable and accurate long-term representations of the absolute magnitudes of stimuli, participants instead rely upon a relative comparison of the current stimulus to the previous stimulus. This relative difference is then used in conjunction with the feedback from the previous trial to generate a response (cf. Holland & Lockhead, 1968). Our intuition, which we test below, was that a model where responding on the current trial depends on information from the preceding trial might offer a simple account of sequential effects. We are not the first to suggest that psychophysical judgment might be relative. In reviews of the psychophysical literature, Helson (1964) and Laming (1997) both suggest that psychophysical judgment is relative. Lockhead (1992; 2004) also reaches this conclusion, although he suggests that, because single attributes cannot be abstracted from the object in which they occur, it is entire objects, rather than their constituent attributes, that are judged relative to one another. In absolute identification, where objects (stimuli) vary on only a single attribute, these alternatives are equivalent.
preceding stimulus, and the preceding stimulus was from the low category, then the current stimulus was correctly categorized as a member of the low category. These data are consistent with the idea that the categorization of the previous stimulus, together with a judgment of the difference between the current stimulus and the previous stimulus, inform the current
categorization decision.
Other data are difficult to explain with an absolute account. If judgment were absolute, then the effect of the previous stimulus on the current response should be viewed as a biasing of absolute judgment. Attenuation of sequential effects should therefore lead to an
improvement in identification performance. Stewart and Chater (2003) found that a manipulation which attenuated sequential effects instead reduced identification accuracy. Stewart and Chater had participants perform an absolute identification of eight loudnesses. However, each loudness was randomly presented as either a pure, sinusoidal tone or a white noise hiss. When consecutive stimuli were of different types (a hiss followed by tone or a tone followed by hiss) there was a significantly smaller correlation between the previous stimulus and the current response compared to when stimuli were of the same types (two consecutive hisses or two consecutive tones). Accuracy was also significantly lower when consecutive stimuli were of different types compared to when consecutive stimuli were of the same type. This result is the opposite to what would be expected if absolute judgments are being made: Reducing the biasing caused by the previous stimulus should have increased accuracy. However, this result is expected if the loudness of current stimulus is judged relative to the previous stimulus: A switch in the stimulus type will make the comparison of loudnesses more difficult, reducing the accuracy on the current trial.
The idea that long-term representations of absolute magnitudes are not available may well be too strong. There are some data that are problematic for this view. Ward and
successive magnitudes, absolute magnitude estimation and cross modality matching). On different days, they varied the loudness of the entire stimulus set. Whether or not participants were performing relative or absolute judgment tasks, the judgments on each day were
systematically biased towards the stimulus-response mapping from the previous day. This suggests that some representation of the absolute magnitudes of stimuli persists over an interval of at least one day. Thus, it may be that long-term absolute magnitude information is available in absolute identification, but that its representation is rather poor or "fuzzy" (Ward, 1987, p. 226) and not sufficient to support absolute identification. Alternatively, the
information may be available, but (for some unknown reason) not used. Consistent with this possibility, long-term absolute magnitude information seems to be weighted more heavily when instructions suggest using a long-term frame of reference (DeCarlo & Cross, 1990; DeCarlo, 1994) or when inter-trial intervals were large (DeCarlo, 1992). (Stewart and Brown, 2004, give a more detailed discussion of these data.) Our core claim - that absolute
identification is achieved by relative judgment - is consistent with either the possibility that long-term representations of absolute magnitudes are poor or that the long-term
representations are (for some unknown reason) unused. Summary
In summary, two shortcomings of existing models have motivated the RJM. Models which assume the locus of the limit in information transmitted is perceptual fail to predict (or require modification to predict) that channel capacity remains severely limited even for very large stimulus spacings. In the RJM, the limit in channel capacity is not perceptual. Models which use long-term representations of absolute magnitudes do not capture the sequential effects adequately. In the RJM, as the name suggests, judgment is instead relative to the immediately preceding stimulus. Next we give a detailed specification of the RJM.
Mathematical Specification of the Relative Judgment Model
trials as trial n - 1, and the kth most recent trial as trial n - k. The physical magnitude of the stimulus on trial n is denoted Xn, the rank of the stimulus within the set Sn, the response Rn, the
feedback Fn, and the error in responding En = Rn -Sn.
The elemental unit admitted to the decision process is assumed to be the difference between Sn and Sn - 1. In other words, what is admitted to the decision process on trial n is not
some representation of the magnitude of Sn, but a representation of the difference between Sn
and Sn - 1. This difference, Dn, n - 1, is given by the logarithm of the ratio of the physical
magnitudes.
Dn , n1=A ln Xn
Xn1
(1)
where A is a constant that depends on the sensory dimension. The use of the ratio follows from Weber's Law. A rearrangement of Equation (1) gives
Dn ,n1=A ln Xn Aln Xn1 . If Fechner's logarithmic law relating physical magnitude
to the subjective, psychological percept holds, then Dn, n - 1 is the arithmetic difference between
psychological magnitudes. If stimuli are geometrically spaced with spacing r (i.e., each stimulus is a constant ratio r larger in physical magnitude than the next highest in magnitude), as is nearly always the case in absolute identification experiments, then
Dn , n1=A lnr SnSn1 . (2)
This difference Dn, n - 1 is assumed to be contaminated by residual representations of
earlier differences Dn - 1, n - 2, Dn - 2, n - 3, ... . Equivalently, elements of the representation of Dn, n - 1
are assumed to be confused with elements of the representations of Dn - 1, n - 2, Dn - 2, n - 3, ... (cf.
Estes, 1950). The result of this confusion or contamination is labeled DCn ,n1.
DCn ,n1=
i=0 n2
iDni , ni1 (3)
The coefficients are constrained to be in the range 0 1. The coefficient for the
decreasing (i.e., i > i + 1), so that more recent differences are more likely to be confused with
the current difference. The idea that representations may be confused is quite ubiquitous in psychology. What is unique in the RJM is the assumption that it is stimulus differences that are confused, and this follows from our initial assumption that it is stimulus differences rather than
absolute magnitudes that are elemental. That is, DCn ,n1 can be considered the result of a
confusion of stimulus differences in exactly the same way as any other representations might be confused.
To produce a response, the difference DCn , n1 is converted to a difference on the
response scale by dividing by a constant . ( represents the subjective size of the difference that corresponds to a single unit on the response scale; see Luce & Green, 1974, and Marley, 1976, for a similar approach in magnitude estimation.) The result is then added to the feedback from the previous trial (cf. Holland & Lockhead, 1968). It is at this point that we assume that there is a limit in channel capacity. Next we outline the form that this limit takes in the RJM.
The limit in the channel capacity in the RJM is assumed to arise from noise in mapping the stimulus difference onto the response scale. Lacouture and Marley (1995, 2004), Marley and Cook (1984, 1986), and Petrov and Anderson (in press) also assume that the limit in channel capacity is (at least partly) a result of noisy mapping. These authors give detailed mechanistic accounts of the mapping process: in terms of a limited capacity rehearsal of the context in a Thurstonian model (Marley & Cook, 1984, 1986); in terms of noisy activation of a single connectionist unit (Lacouture & Marley, 1995, 2004); or in terms of exemplars competing for selection (Petrov & Anderson, in press). Here we do not choose between these accounts or offer our own mechanistic account. Instead we borrow a general principle from all of these accounts. In each account, as the number of response categories is increased, fixed magnitude noise in the mapping process leads to greater confusion between response
hidden unit varies between 0 and 1. Fixed magnitude noise is added to the activation of the hidden unit. In experimental blocks where the set size is larger and, thus, the spacing of stimuli on the hidden unit's unit interval is closer, the fixed magnitude noise causes greater confusion between response categories. In the RJM, we make the additional assumption that, on a given
trial, some responses can be ruled out because of knowledge of Fn - 1 and the sign of DCn ,n1.
The limited capacity is then used to represent only the remaining responses. For example, if Sn
is perceived as being less than Sn - 1, then only those responses less than Fn - 1 are represented. If
Sn is greater than Sn - 1, then only those responses greater than Fn - 1 are represented. This
assumption follows directly from the initial assumption that judgment is relative.
We assume that the noise in the mapping process is normally distributed with variance 2, and that this variance will be constant from trial to trial (and also from experiment to
experiment). However, as we outlined above, the effect of this noise on responding will not be constant from trial to trial because the number of candidate responses will vary from trial to trial. Consider the example illustrated in Figure 8A for the absolute identification of 10 stimuli.
If Sn - 1 = 4 and Sn = 8, then because DCn ,n1/ 8 - 4 = +4 is positive, Rn must be higher
than Fn - 1 = 4. The response scale must now be partitioned into six responses (i.e., 5, 6, 7, 8, 9,
and 10). Compare this case with the case illustrated in Figure 8B. Now, Sn - 1 = 6 and, as
before, Rn must be higher than Fn - 1 = 6. Now, however, the same limited capacity can be used
to represent only four candidate responses (i.e., 7, 8, 9, and 10). In this latter condition, the same variance noise in mapping translates into less confusion among responses, because the limited capacity is partitioned into fewer response categories.
Two pieces of empirical evidence support this assumption. First, there is almost never a problem deciding whether Sn is higher or lower than Sn - 1. In only 1.2% of the responses in
vice versa). We describe the second piece of evidence in Experiment 2, which provides a
direct test of the assumption that Fn - 1 is used together with DCn , n1 in generating Rn.
Equation 4 implements the conversion of DCn , n1 into a difference on the response
scale, and then the subsequent addition to Fn - 1 within a fixed limited capacity that is used to
represent the range of possible responses.
Rn=Fn1
Dn , n1C
Z (4)
where Z is a normally distributed random variable that represents the noise in the mapping process with a mean of 0 and a standard deviation of , and represents the range of possible
responses (given the sign of DCn ,n1 and Fn - 1) and scales the fixed noise within the limited
capacity onto the response scale. Thus Rn is a normally distributed random variable. is
specified exactly in Equation 5.
=
{
N Fn1 if Dn , n1C
1 if Dn , n1C
Fn11 if Dn , n1C
}
(5)
where N is the number of stimuli and is a criterion whose magnitude DCn ,n1 must exceed
for Sn and Sn - 1 to be assumed to be different. is assumed to be fixed at half of the stimulus
spacing throughout this paper.
1986; Petrov & Anderson, in press). In the RJM, we assume that, the noise varies not only from block to block in an experiment as the set size is manipulated, but
also from trial to trial as the number of available responses varies (constrained by Fn - 1 and
DCn , n1 ). In Equations 4 and 5, we assume that the noise in responding will grow linearly
with the number of available responses. We return to this issue later in this article, and suggest that this simple assumption may need to be modified.
We assume that the location of the N - 1 criteria, labeled x1, x2, ..., xN - 1, that partition
the response scale is such that accuracy is maximized. The probability of a given response r is
given by the total density of Rn within the range
xr1Rn xr (6)
with the lower and upper bounds replaced by - and + for the lowest and highest responses respectively. Figure 9 shows the placement of criteria that maximizes the proportion of correct responses for the parameters that best fit the data from Experiment 1. The dashed lines are drawn at 1.5, 2.5, ..., 9.5. Notice that the optimal placement for criteria is more extreme than criteria half way between integer values on the scale. This displacement is approximately a linear function of the distance of the criteria xr from the center of the scale. (When predicting
the displacement of xr from r + 1 / 2 as a linear function of r, 99.96% of the variance is
accounted for.)
This outward displacement of optimal criteria happens because of a mathematical fact proved by James and Stein (1961). James and Stein demonstrated that when predicting three or more population means from three or more observations (one from each population), the best estimate of each mean is not given by each observation. Instead, estimates derived by shrinking each observation towards the grand mean of all the observations are better.4 Efron
shrunk towards the grand mean of all baseball players' scores. Here, we are trying to estimate the correct response from a single noisy estimate (i.e., a single sample from Rn). James and
Stein's result tells us that the single sample from Rn will be too extreme compared to the mean
response. Thus, it is optimal to place the criteria at more extreme locations. Equation 7 gives the location of each criterion.
xr= Rr 12 R
1c (7)
where R is the mean of the response scale (i.e., (N + 1) / 2) and 0 < c < 1 is a James-Stein estimator. As c becomes larger, criteria are more outwardly displaced.
Fitting the RJM to Existing Data
In this section, we describe the mechanics of fitting the RJM to the data reviewed above. The RJM has a set of parameters that describe the confusion of the representations of the differences between stimuli, a parameter that scales between differences and response scale units, a noise parameter , and a James-Stein estimator c. For simplicity, the quantity 1 / (A ln(r)) is absorbed into the parameter. Thus, when = 1, the size of the difference
between stimuli that corresponds to a single unit on the response scale is perfectly estimated. < 1 represents an underestimation of the stimulus spacing and > 1 represents an
overestimation.
Except where specified otherwise, the data modeled in this section were collected from experiments where a random sequence of stimuli was used. In modeling these data, the RJM was used to generate predictions of the probabilities of each response for every possible combination of the preceding and current stimuli. The relevant descriptive statistics were then calculated as in the original experiments. For fits to these existing data sets, the MSE between each data point and the predicted value was minimized. The best fitting parameter values were found using both a downhill simplex procedure and Brent's method (Press, Flannery,
Best fitting parameters for each model are given in Table 3. Some data sets did not adequately constrain all of the parameters. For example, in fitting the pattern of assimilation and contrast in Figure 5, a wide range of parameters was observed in the fits. When this happened, a fit was chosen from the subset of fits with a MSE within 1% of the best fit MSE that had values for the unconstrained parameters similar to those found in fitting other data sets.
The RJM Account of the Bow Effect
In Figure 2, a single fit is presented for all three stimulus spacing conditions in Brown et al.'s (2002) experiment. The data did not constrain the parameters for less recent stimuli, and so a restricted version of the RJM with 3 = 4 = 5 = 0 was fitted. The RJM provides an
excellent fit to the characteristic bow.
The primary explanation for the bow effect is that there is a limited opportunity to make errors at the end of the stimulus range. For example, Stimulus 1 can only be mistaken for larger stimuli but Stimulus 5 can be mistaken for smaller or larger stimuli. However, given that the error observed is normally only one, or maybe sometimes two response units (see, for example, the confusion matrices in Figure 2), the restricted opportunity to make mistakes can really only account for the peaks at each end of the accuracy against stimulus magnitude curve, and does not offer an account of the gradual smooth curve over the entire stimulus range.
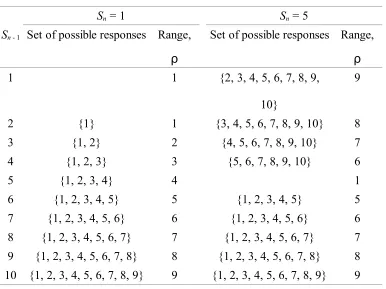
The gradual bowing is accounted for because the effect of the limited decision capacity is greatest for the central stimuli. When Sn lies in the center of the range, averaging over all
possible Sn - 1, the range of possible Rn constrained by Fn - 1 and Dn, n - 1 is, on average, larger than
when Sn lies at an extreme. For example, Table 4 shows the range of possible responses for
two cases, Sn = 1 and Sn = 5. Averaged over all possible Sn - 1, the range of possible responses
in the center of the range, more than it reduces accuracy at the edge of the range. Together with the limited opportunity for errors at the edge of the range, the effects produce the characteristic smooth bow.
A single set of parameters was used across all of the set sizes in fitting the bow effects in accuracy in Lacouture and Marley's (1995) data (Figure 3). With only the set size differing between fits, the RJM is able to provide a good account of the bows. A key observation is that the limited capacity for representing the range of possible responses can represent two
possible alternatives nearly perfectly, but not many more. For this reason, the decision process will not add noise in a task were two stimuli are identified but will add noise when there are more than two stimuli. The RJM is able to account for the dependency of the bow effect on set size because, as the set size increases, the average magnitude of both the differences between stimuli and the range of possible responses on any given trial increases. Both of these increases lead to more variability in responding.
A shortcoming of the RJM in its present instantiation is that it does not make predictions about reaction times. Reaction times are faster for extreme stimuli (e.g., Kent & Lamberts, in press; Lacouture & Marley, 1995). As described above, some models can predict this effect (e.g., Lacouture & Marley, 1995; Nosofsky, 1997) and other models go further and predict reaction time distributions for each stimulus (Karpiuk et al., 1997; Kent & Lamberts, in press; Lacouture & Marley, 2004). Though we have not addressed this issue in this article, it may be possible to extend the RJM to predict response time distributions. In its present form,
noise is added to the quantity Fn1Dn , n1C / (see Equation 4) and the result Rn is
partitioned into response categories (see Equation 6) using fixed criteria. Instead of assuming that response probabilities are given directly by the integrals of the probability density between relevant criteria, a set of leaky competing accumulators (Usher & McClelland, 2001) could be
which accumulators from the full set (one for each response category) enter into the
competition on each trial, full response time distributions that are conditional upon the current stimulus and previous stimuli could be predicted. Although it would be hard to test the fully conditional distribution predictions because of the large amount of data required (e.g., for absolute identification of 10 stimuli and sequence effects up to a lag of five trials, there would be 106 possible sequences, each requiring of the order of 100 repetitions to construct full
reaction time distributions), this extension of the RJM could be tested with data conditional upon, say, just the current stimulus.
The RJM Account of the Limit in Information Transmission
In modeling the limit in information transmitted (Figure 1), a single set of best fitting parameters was used across all set sizes. Again, the data did not constrain the parameters for less recent stimuli, and so a restricted version of the RJM with 3 = 4 = 5 = 0 was fitted.
Dashed lines represent the fits to the Pollack (1952) and Garner (1953) data. Information transmitted is completely defined by the confusion matrix. Thus, the RJM's account of the limit in information transmitted as the number of stimuli is increased is the same as that given above for the confusion matrix.
The RJM Account of the Restricted Sequence Designs
Fits of the RJM to Luce et al.'s (1982) proportion correct data are shown in Figure 6, using a single set of parameters for all conditions. In fitting these data, the responses that the RJM could generate on each trial were restricted to be those available to participants. There were 10 criteria dividing the response scale into 11 categories positioned according to Equation 7. However, in the small step (3) condition, for example, when each stimulus was either one smaller than, the same as, or one larger than the previous stimulus, only the relevant 2 of these 10 criteria that divided the response scale into the categories Fn - 1 -1, Fn - 1, and Fn - 1
+ 1 were used.
restricted version of the RJM with 3 = 4 = 5 = 0 was fitted. The RJM fits the bow effect in
mean proportion correct and orders the sequences correctly. Within the RJM, the advantage for conditions with smaller transitions results from the cumulative effect of the smaller transitions, in agreement with Nosofsky (1983a) and Luce et al.'s (1982) conclusions. With
smaller transitions, because the range of previous stimuli will be smaller, DCn ,n1 is less
variable (Equation 3). Together with reduced noise in the mapping process when a stimulus is repeated (Equations 4 and 5), with is more likely with smaller transitions, these two properties of the RJM give higher accuracy for sequences with smaller transitions. (As we noted in the initial presentation of Luce et al.'s data, accuracy is higher in the large step condition than the random condition, because the responses available on each trial are restricted in the large step condition. However, performance measured by d' is higher for the random step condition than the large step condition. Immediately below, we show that the RJM predicts this.)
The RJM Account of Bows in Discriminability
Using the parameter set from fitting the accuracy data (above), we also generated predictions for d' for Brown et al.'s (2002; our Figure 10) data, Lacouture and Marley's (1995; our Figure 3) data and for Luce et al.'s (1982; our Figure 6) data. Parameters from the
accuracy fits were used because the optimization algorithm performed very poorly when fitting d' directly. The RJM does predict bows in d' because the effect of the limited decision capacity is greatest for central stimuli, as described above. However, the size of this effect is
systematically underestimated. The RJM predicts that the confusion between the lowest two stimuli and also between the highest two stimuli is larger than is actually observed. Below, we consider two modifications that should allow the RJM to predict better the bows in d'.
responses (see Equation 5). If one assumes a different relationship (specifically, a convex relationship when the effect on the response scale is plotted against the range of possible responses) then greater bows in d' can be predicted. Motivating the functional form of this relationship will require more detailed assumptions about the procedural nature of the
mapping from stimulus differences to the response scale. Lacouture and Marley (1995, 2004) assume that the limit results from the range of stimulus magnitudes being represented by the activation of a single noisy unit in a connectionist network. Marley and Cooke (1984, 1986) assume the limit in mapping arises because of a limited rehearsal capacity in maintaining the context against which a stimulus is judged. Either one of these assumptions could be incorporated into the RJM.
An alternative modification would be to assume that the edge stimuli are somehow privileged, as other authors do (e.g., Braida et al., 1984; Marley & Cook, 1984, 1986;
Nosofksy 1997). For example, participants may utilize representations of the magnitude of the extreme stimuli if they occur two or three trials ago which they do not utilize for interior stimuli. Alternatively, maybe a limited number of long-term representations of absolute magnitudes can be maintained, and the extreme stimuli are preferentially selected. Though these assumptions would complicate the RJM, they may prove to be necessary in providing a fuller account of the d' data.
The RJM Account of Assimilation and Contrast
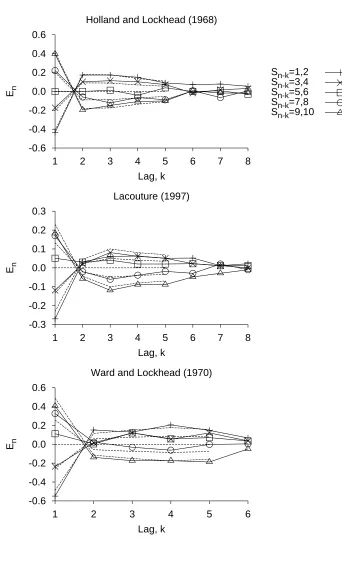
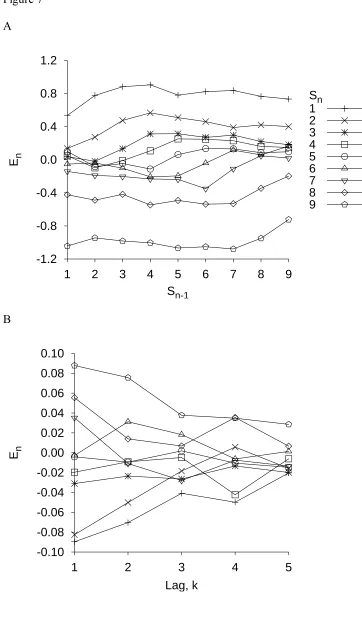
Fits of the RJM to the sequential effects of Holland and Lockhead (1968), Lacouture (1997), and Ward and Lockhead (1970) are shown in Figures 4 and 5. In the RJM, sequence effects result from the confusion of the representation of the current difference with the representation of other differences. The complex pattern of first assimilation and then contrast emerges naturally from the RJM, as a consequence of the assumption that more recent
Rn= Fn1 Alnr [0SnSn11Sn1Sn22Sn2Sn3...] Z.
Recalling that, when feedback is provided, Fn - 1 = Sn - 1 rearranging by collecting together Sn - i
terms gives
Rn= A lnr 0Sn
1 A lnr 10Sn1 Alnr21 Sn2Alnr 32 Sn3... Z
(8)
For assimilation of Rn to Sn - 1 to occur,
1 Aln r 100 .
Given an approximately correct estimate of the stimulus difference corresponding to a single unit on the response scale (i.e., = A ln(r)) and recalling that the availability of the current difference was set at 0 = 1, then this inequality reduces to 1 > 0. 1, which represents the
extent to which Dn - 1, n - 2 is confused withDn, n - 1, is positive and so assimilation is predicted.
Assimilation is still predicted if A ln(r) unless is greatly overestimated. For contrast of Rn to Sn - 2 to occur,
Alnr
210
(with similar expressions for less recent stimuli). Given that A ln(r) and are both positive, and that 1 > 2 (reflecting a greater confusion of Dn, n - 1 with Dn - 1, n - 2 than with Dn - 2, n - 3)
contrast is always predicted.
In summary, in the RJM, the awkward pattern of assimilation and then contrast follows in a straightforward way from the assumption that the current difference is confused more with more recent differences. To capture this pattern in a model where absolute stimulus magnitudes are used would be difficult, because one would need to motivate a switch in the sign of the coefficient for Sn -1 compared to Sn - 2, Sn - 3, ... .
The data in Figure 4 show that, irrespective of Sn - 1, if Sn is small it is overestimated
(i.e., En > 0) and if Sn is larger it is underestimated (En < 0). The RJM model accounts for this
pattern because optimally-located response criteria xr are spread outwards from the center of
the scale.
Extensions of the RJM The Effect of Range
Thus far we have accounted for the key phenomena in absolute identification by assuming that the locus of these effects lies purely in the response process. We have assumed that the effects are not perceptual, because all of the effects are seen with very widely spaced stimuli. When stimuli are already widely spaced, increasing their spacing does little to improve performance (e.g., Brown et al., 2002). However, if stimuli are closely-spaced then increasing their spacing does improve performance (e.g., Braida & Durlach, 1972; see our Figure 11), up to an asymptotic limit. So, at least for closely-spaced stimuli, stimulus noise does play some role in limiting performance in absolute identification. The version of the RJM presented above cannot account for this result, because the RJM predicts no effect of increasing the range of the stimuli. Because of the ratio in Equation 1, the RJM is scale free (Chater & Brown, 1999). That is, the magnitude of all of the stimuli could be increased by any factor and the same predictions would be made (see Lacouture, 1997, for an empirical demonstration). However, it is straightforward to extend the model to include a stimulus noise component by replacing Equation 1 with
Dn , n 1= Aln Xn
Xn1
(9)
where stimulus magnitudes are now random variables. Substituting Equation 9 into Equation 3 gives
DCn ,n1=0Aln Xn10 A ln Xn121 A ln Xn2... .
follows from assuming that the distribution of the logarithm of stimulus magnitudes is normal) with standard deviation s. This version of the model can account for the data in Figure 11
using a single parameter set for all stimulus ranges (1 = 0.271, 2 = 0.253, c = 0.109, =
0.025, = 0.892, and s = 0.129).
Even with this modification there are still some data that are problematic for the RJM. Nosofsky (1983b) investigated whether stimulus noise or criteria noise was increased when the stimulus range was increased in absolute judgment of the intensity of tones. By fitting a simple Thurstonian model Nosofsky found evidence that both stimulus and criterial noise increased with range. In its present form, the RJM does not predict an increase in stimulus noise and would require a further assumption, such as a limit in the width of an attention band (cf. Luce et al., 1976).
Designs with Uneven Stimulus Spacing
Stimuli are not always evenly spaced in absolute identification designs. For
example,Lockhead and Hinson (1986) investigated performance in an absolute identification of three tones differing in intensity. They used three different stimulus sets. In the even-spread condition, stimuli were evenly spaced at 58, 60, and 62 dBA. In the low-spread condition, the lowest stimulus was 4 dB less intense (i.e., a set of 54, 60 and 62 dBA intensities). In the high-spread condition, the highest stimulus was 4 dB more intense (i.e., a set of 58, 60, and 66 dBA intensities). Figure 12 gives the confusion matrices for each condition. Comparing the low-and even-spread conditions, it can be seen that identification performance of the common stimuli (Stimuli 2 and 3) is affected by the location of Stimulus 1. Stimuli 2 and 3 are more likely to be confused when Stimulus 1 is lower. A similar (mirror image) pattern is seen when the the high- and even-spread conditions are compared.