University of Warwick institutional repository: http://go.warwick.ac.uk/wrap
This paper is made available online in accordance with
publisher policies. Please scroll down to view the document
itself. Please refer to the repository record for this item and our
policy information available from the repository home page for
further information.
To see the final version of this paper please visit the publisher’s website.
Access to the published version may require a subscription.
Author(s): V. A. McBride, J. Wilms, M. J. Coe, I. Kreykenbohm, R.
E. Rothschild, W. Coburn, J. L. Galache, P. Kretschmar, W. R. T.
Edge, R. Staubert
Article Title: Study of the cyclotron feature in MXB 0656-072
Year of publication: 2006
Link to published article:
http://dx.doi.org/10.1051/0004-6361:20054239
A&A 451, 267–272 (2006)
DOI: 10.1051/0004-6361:20054239 c
ESO 2006
Astronomy
&
Astrophysics
Study of the cyclotron feature in MXB 0656-072
V. A. McBride
1, J. Wilms
2, M. J. Coe
1, I. Kreykenbohm
3,4, R. E. Rothschild
5,
W. Coburn
6, J. L. Galache
1, P. Kretschmar
7, W. R. T. Edge
1, and R. Staubert
31 School of Physics & Astronomy, University of Southampton, Highfield, SO17 1BJ, UK
e-mail:[email protected]
2 Department of Physics, University of Warwick, Coventry CV4 7AL, UK
3 Institut für Astronomie und Astrophysik – Astronomie, Sand 1, 72076 Tübingen, Germany 4 INTEGRAL Science Data Centre, 16 Ch. d’Écogia, 1290 Versoix, Switzerland
5 Center for Astrophysics and Space Sciences, University of California at San Diego, La Jolla, CA 92093-0424, USA 6 Space Sciences Laboratory, University of California at Berkeley, Berkeley, CA 94702-7450, USA
7 European Space Astronomy Centre (ESAC), European Space Agency, PO Box 50727, 28080, Madrid, Spain
Received 22 September 2005/Accepted 26 January 2006
ABSTRACT
We have monitored a type II outburst of the Be/X-ray binary MXB 0656−072 in a series of pointedRXTEobservations during October through December 2003. The source spectrum shows a cyclotron resonance scattering feature at 32.8+0.5
−0.4keV, corresponding to a magnetic field strength of 3.67+0.06
−0.04×10
12G and is stable through the outburst and over the pulsar spin phase. The pulsar, with an average pulse period of 160.4±0.4 s,
shows a spin-up of 0.45 s over the duration of the outburst. From optical data, the source distance is estimated to be 3.9±0.1 kpc and this is used to estimate the X-ray luminosity and a theoretical prediction of the pulsar spin-up during the outburst.
Key words.X-rays: stars – stars: magnetic fields – stars: pulsars: individual: MXB 0656−072
1. Introduction
MXB 0656−072 was first classified as a transient source by Clark et al. (1975) when detected at 80 mCrab on 1975 September 20 bySAS-3. SubsequentlyAriel Vobserved the source at 50 and 70 mCrab on 1976 March 19 and 27 re-spectively (Kaluzienski 1976). Kaluzienski’s comments that MXB 0656−072 may more closely resemble a long term vari-able source as opposed to a transient possibly led to it being classified as a Low Mass X-ray Binary in the catalogue of Liu et al. (2001).
The source, which has been dormant and unobserved since 1975/1976, made a reappearance in the X-ray sky in a large, extended outburst during 2003 October. During this out-burst,which lasted over 2 months and reached an X-ray lumi-nosity of 200 mCrab, it was identified as a pulsating X-ray bi-nary with a pulse period of 160.7 s (Morgan et al. 2003) and with an optical counterpart of spectral type O9.7Ve (Pakull et al. 2003), re-categorising it as a High Mass X-ray Binary. Time-resolvedBandR photometry (Bartolini et al. 2005) of the optical counterpart during this outburst revealed no optical periodicity at the X-ray pulse period. Orbital parameters of the system remain undetermined.
Preliminary analysis of the phase averaged spectrum by Heindl et al. (2003) showed that the continuum could be fit with a power law with an exponential cutoff. A cyclotron
resonant scattering feature with a centroid energy of 36±1 keV was discovered by Heindl et al. (2003).
The strong magnetic fields found near the polar caps of neu-tron stars quantise the ambient elecneu-tron energies into Landau levels. Photons at these resonant electron energies are scattered, creating cyclotron resonant scattering features (CRSFs) in the observed spectrum. The energy of the fundamental CRSF is approximated by:
EC11.6 keV× 1 1+z×
B
1012G (1)
wherezis the gravitational redshift andBthe magnetic field strength. Thus measuring the energy of cyclotron features in the spectra of accreting X-ray binaries gives us a direct mea-surement of the magnetic field of the neutron star.
2. Data reduction
MXB 0656−072 was observed with RXTE
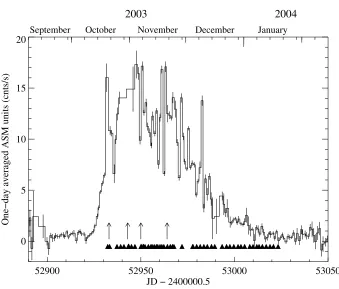
dur-ing 2003 October through 2004 January. Observations coincided with a Type II (Stella et al. 1986) X-ray outburst and data were accumulated during both the rise and decline of the outburst. In total, thePCAlivetime for this set of observa-tions amounts to 95 ks. Figure 1 shows the MXB 0656−072 lightcurve from the All Sky Monitor (ASM) aboard RXTE
268 V. A. McBride et al.: Study of the cyclotron feature in MXB 0656-072
0 5 10 15 20
One−day averaged ASM units (cnts/s)
52900 52950 53000 53050
JD − 2400000.5
September October November December January
[image:3.595.56.395.77.366.2]2003
2004
Fig. 1. The ASM lightcurve of
MXB 0656−072 during the 2003 out-burst with bin sizes of 1 day. Triangles indicate the dates of pointedRXTE observa-tions. The arrows indicate the dates at which spectra were compared with each other in order to observe any spectral evolution over the outburst. This is further discussed in Sect. 3.2.
during the outburst. Triangles indicate the dates of pointed RXTEobservations.
WhileStandard2f modePCAdata (with 16 s time resolu-tion and 128 channel energy resoluresolu-tion) were employed to gen-erate phase averaged spectra, the phase resolved spectra and timing results were obtained from observation-specific binned-mode data with a temporal resolution of 250 ms and an energy resolution of 128 channels.
Analysis was performed with HEASOFT version 5.3.1 and spectral fitting with XSPEC version 11.3.1t. Phase re-solved spectra were created using a modified version of the FTOOL fasebin developed at the University of Tübingen (Kreykenbohm 2004).
For spectral fitting,PCAdata (Jahoda et al. 2006) in the en-ergy range 3−22 keV were used, to which we added systematic errors of 0.5%. Below and above this range the systematic er-rors required are larger to account for the uncertainties in the PCAresponse matrix, so we ignored data outside the 3−22 keV range.
For all spectra we used the E_8µs_256_DX1F mode HEXTE data (Rothschild et al. 1998), which have a tempo-ral resolution of 8µs and covers the range 0−250 keV with 256 spectral channels. Electronic thresholds limit theHEXTE energy range to 15−250 keV. In all cases, the signal-to-noise ratio was increased by adding together the data from both clus-ters and generating a new response file with weights 1:0.75 to account for the loss of signal from one of the detectors in the secondHEXTE cluster. A binning factor of 3 was applied to data in the 70−200 keV range to improve statistical significance of model fitting while still maintaining a reasonable energy res-olution. Data above 200 keV were not used.
3. Phase averaged analysis
For the phase averaged spectral analysis, the spectra from all observations through the peak of the outburst (from MJD 52932 to MJD 52964) were added together in an effort to maximise the signal-to-noise ratio.
3.1. Spectral model
In accreting X-ray pulsars the highly ionised accretion stream is channelled onto one or both of the magnetic poles of the neu-tron star by its sneu-trong (B∼1012G) magnetic field. Depending on the accretion rate and the strength of the magnetic field, an accretion shock may form. The continuum spectral shape is dominated by Comptonisation of photons by the accretion stream at the magnetic poles. As a comprehensive theoretical spectral model is unavailable, the spectrum is generally mod-elled as a exponentially cutoffpower law, but see Tanaka (1986) for the choice of a Fermi-Dirac Cut Off (FDCO) model or Mihara (1995) for the NPEX model. In addition to this contin-uum we may observe photoelectric absorption by the accretion stream or stellar wind, an Fe Kαfluorescence line and one or more cyclotron resonance scattering features.
In our analysis we describe the continuum using a power law with photon indexΓ, with a high energy cutoffatEcut.
Icont(E)=KE−Γ×
1 (E ≤Ecut)
e−(E−Ecut)/Efold (E >E
cut). (2)
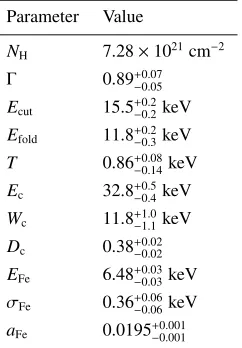
Table 1.Spectral parameters (as defined in the text) for the phase aver-aged spectrum. The model consists of power law with a smoothed high energy cutoff, photoelectric absorption, a CYCLABS cyclotron fea-ture, a Gaussian Fe line and a blackbody component. The flux in the Fe emission line is represented byaFe, in photons cm−2s−1. Uncertainties are at 90% confidence intervals.
Parameter Value
NH 7.28×1021cm−2 Γ 0.89+0.07
−0.05
Ecut 15.5+−00..22keV Efold 11.8+−00..23keV T 0.86+0.08
−0.14keV
Ec 32.8+−00..54keV Wc 11.8+−11..01keV Dc 0.38+−00..0202 EFe 6.48+−00..0303keV σFe 0.36+−00..0606keV aFe 0.0195+−00..001001
a cyclotron feature (Kretschmar et al. 1997; Coburn 2001). Although we attempted to use the FDCO and NPEX models to describe the continuum, we found that the best-fit continuum was indeed a power law with a smoothed high-energy cutoff.
The spectral shape is insensitive to the H I column density and in order to include some estimate of the column density a value of 7.28×1021 cm−2 was estimated over a cone of radius 1◦ in the direction of the source (Dickey & Lockman 1990). The column density,NH, was fixed at this value for sub-sequent spectral fitting.
Modifying the continuum is a CRSF modelled with the CYCLABS model, which has the analytical form shown below:
CYCLABS(E)=Dc
(WcE/Ec)2 (E−Ec)2+Wc2
(3)
whereEc,DcandWcare the cyclotron energy, depth and width respectively (Makishima et al. 1990; Mihara et al. 1990). Using other continuum models (FDCO and NPEX) did not alter the presence of the cyclotron feature.
We model a strong Fe Kα fluorescence feature with a Gaussian emission line and determine the equivalent width to be 3.66 keV. In addition we include a blackbody component to account for the excess flux at the soft end of the spectrum. The blackbody component has a temperature of 0.86+0.08
−0.14keV and can be attributed to emission from an accreting polar cap, in a manner similar to Coburn et al. (2001) in the case of X Per.
The fit to the phase averaged spectrum results inχ2
red =1.1
with the spectral parameters given in Table 1. The spectrum is shown in Fig. 2.
The cyclotron feature at 32.8+0.5
−0.4keV is clearly visible in the residuals. A harmonic with width 16+20
−14keV and depth 0.19+0.26
−0.16may be present at twice the fundamental energy, but detection is marginal, as can be interpreted from the uncertain-ties in the line parameters. Assuming that the cyclotron line at 32.8 keV is the fundamental (n = 1) and a gravitational
redshift ofz = 0.3 for a typical neutron star mass of 1.4M and radius of 10 km, we can estimate the magnetic field from Eq. (1) to be 3.67+0.06
−0.04×10
12G.
Note the systematic feature in the residuals at∼10 keV. This feature is evident in the spectra of a number of accreting X-ray binaries (GS 1843+00, Her X-1) (Coburn 2001). It has been observed in spectra accumulated byGinga(Mihara 1995) and BeppoSAX (Santangelo et al. 1998) as well, and should be ac-counted for in future continuum models of accreting X-ray pul-sars. A more comprehensive review of this feature can be found in Coburn (2001).
3.2. Spectral evolution over outburst
In order to determine whether there was any significant change in the spectral shape or the cyclotron feature during the outburst we compared the spectral parameters at various dates through the outburst. These dates are indicated by the arrows in Fig. 1 and further information is shown in Table 2.
Note that the fourth spectrum is obtained by adding ob-servations over a five day range in order to have signal-to-noise ratios similar to those of the first 3 datasets. We find that, on average, the spectral fits haveχ2
red ∼ 1.2, except for 2003 November 16−20 which hasχ2
red = 1.7. The power law index stays between 0.9 and 1.1 during this time and there is very little change inEcutandEfold, which have values close to those given in Table 1. The cyclotron parameters over this time interval are shown in Fig. 3. Noting that the error bars repre-sent 90% uncertainty levels it is clear that the cyclotron feature is stable over the outburst.
4. Phase resolved analysis
If the rotation and magnetic axes of the neutron star are not aligned, the observer sees X-ray emission modulated by the pulsar spin period. Due to the fact that cyclotron features are strongly dependent on viewing angle, phase resolved spec-troscopy is a tool well-suited to studying cyclotron features.
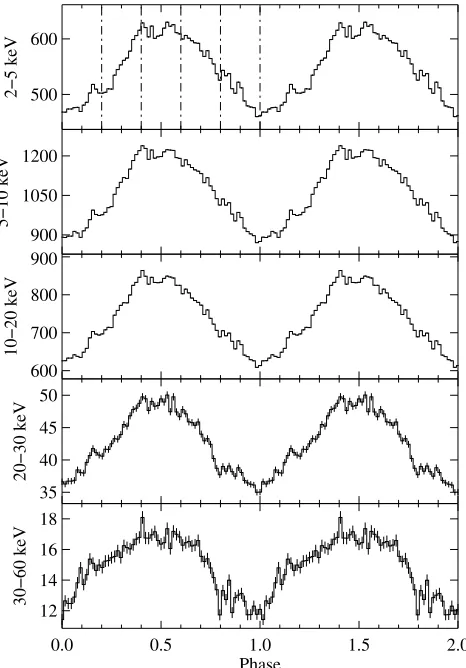
Pulse profiles and phase resolved spectra were generated by performing a barycentric correction of the bin times for the PCA data and the photon arrival times for the HEXTE data for two 15 ks observations at the peak of the outburst. Orbital modulation was not accounted for as the orbital ephemeris of the system is still unknown. The pulse period was deter-mined by running a Lomb-Scargle analysis (Press & Rybicki 1989; Lomb 1976; Scargle 1982) on the barycentre-corrected lightcurves. The lightcurves were then folded at the pulse pe-riod of 160.4 s to produce the pulse profiles shown in Fig. 4.
4.1. Pulse profiles
270 V. A. McBride et al.: Study of the cyclotron feature in MXB 0656-072
10−3 10−2 10−1 10 0 10 1 10 2 10 3
cts s
−1 keV
−1
10−6 10−5 10−4 10−3 10−2 10−1
photons cm
−2 s −1 keV
−1
−10−5 0 5 10
∆
χ
2
10 100
Energy (keV) −10
−50 5 10
∆
χ
[image:5.595.57.394.70.337.2]2
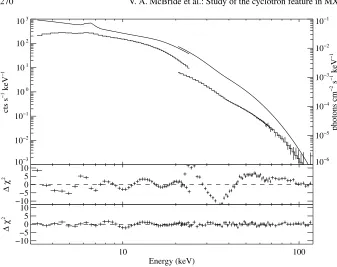
Fig. 2. The spectrum of MXB 0656−072
[image:5.595.78.285.389.627.2]from 3–120 keV. The crosses show the data, the smooth curve shows the unfolded spec-trum and the histogram the model fit. In the second panel the residuals, plotted as∆χ2, are shown for the case in which no CRSF is included in the model. In the lower panel, these residuals are shown again – this time including a CRSF in the model.
Table 2.Dates andPCAlivetimes of observations used to determine
the spectral evolution over the outburst.
Date MJD Livetime (ks)
2003-10-20 52 933 11 2003-10-30 52 943 8 2003-11-06 52 950 15 2003-11-(16–20) 52 96(0-4) 7
32 33 34 35 36
Energy
10 15 20
Width
52920 52930 52940 52950 52960 52970 52980 JD − 2400000.5
0.2 0.4 0.6
Depth
Fig. 3.Cyclotron line parameters throughout the 2003 October
out-burst. The energy and width are in keV.
(Beloborodov 2002). The almost perfectly sinusoidal pulse shapes may indicate that there is no absorption along the ac-cretion column, as it is believed that strong absorption along the accretion column contributes to the complexity of the pulse profile at low energies (Kreykenbohm et al. 2002; Nagase et al. 1983). The pulse profile shape and amplitude support the con-clusion reached by Bulik et al. (2003): that the rotation and magnetic axes of accreting pulsars are almost aligned.
4.2. Spectral evolution over Pulse
The data were split into 5 phase bins for analysis, as shown in the topmost panel of Fig. 4. This gives us good statistics at a temporal resolution sufficient to describe this particular pulse shape. Evolution of the spectral parameters with phase is shown in Fig. 5.
For the phase resolved spectra, we used the same model as in Sect. 3.1, however the addition of a blackbody compo-nent did not significantly improve the fit, so was not included. Furthermore, a Gaussian absorption component at ∼10 keV was required to take account of the systematic feature at this wavelength, mentioned in Sect. 3.1.
The cyclotron feature at energy around 32 keV is present through all pulse phases. There are, however, variations in the cyclotron line width. In general, the line is at its nar-rowest (6+−35keV) in the peak rise and reaches its broad-est (14+−53keV) during the pulse decline (see Fig. 5.) The cy-clotron line depth also shows some variation through phase, in a manner inverse to the continuum power law normalisa-tion coefficient. However, the cyclotron feature in this source shows little variability with phase in comparison with some other sources such as Vela X-1 (Kreykenbohm et al. 2002) and GX 301-2 (Kreykenbohm et al. 2004), which show cyclotron line energy variations of a couple keV throughout the phase.
5. Discussion
5.1. Source distance
As the optical counterpart to MXB 0656−072 has been identi-fied, we can use the optical magnitude and colour to estimate the distance to the source.
0.0 0.5 1.0 1.5 2.0 Phase
12 14 16 18
30−60 keV
35 40 45 50
20−30 keV
600 700 800 900
10−20 keV
900 1050 1200
5−10 keV
500 600
[image:6.595.303.518.82.347.2]2−5 keV
Fig. 4.Pulse profile shown in counts s−1. Profiles are plotted twice for clarity.
V-magnitude in the range 12.05 mag to 12.38 mag. For this es-timate we shall assume that the variability in theV-magnitude and theB−Vcolour is due to the circumstellar disk contribut-ing the theV-magnitude. Hence we will use the faintest avail-ableV-magnitude value, assuming that this is when the disk is smallest, along with the corresponding bluestB−Vcolour. We have estimated errors typical for photometry of a 12th magni-tude star on a 1−2 m telescope and useV =12.38±0.02 mag andB−V=0.86±0.03.
Interstellar reddening is given by:
E(B−V)=(B−V)−(B−V)0 (4) where (B−V)0is the intrinsic colour. Thus for an O9.7Ve star we expect (B−V)0 = −0.28 (Wegner 1994) and an absolute magnitude ofMV =−4.2 mag (Zombeck 1990).
This puts the magnitude of reddening in theV-band atA= 3.7±0.1 mag. Knowing the apparent magnitude, the absolute magnitude and the reddening magnitude allows us to estimate the distance using:
D=101+(m−M−A)/5=3.9±0.1 kpc. (5) It is most likely that the optical colour and magnitude used in this calculation were observed at time when the contribution from the Be star disk was not negligible. Hence the above dis-tance estimate will be an underestimate.
0.9 1.0 1.1
Γ
0.4 0.5
Γnorm
28 30 32 34
Energy (keV)
0 5 10 15 20
Width (keV)
0.0 0.5 1.0 1.5 2.0
Phase 0.2
0.4 0.6
[image:6.595.36.269.85.419.2]Depth
Fig. 5.From top to bottom the power law index, the power law normal-isation, the cyclotron energy, cyclotron line width and cyclotron line depth are plotted as a function of phase. Error bars indicate 90% un-certainty levels.
5.2. Spin-up trends
Accretion of material onto a pulsar is expected to transfer a significant amount of angular momentum to the neutron star. Thus an accreting X-ray pulsar undergoing an outburst is in a state where the mass (and thus momentum) transfer rate is high and one expects to observe a slight decrease in the pulse period as it is spun-up.
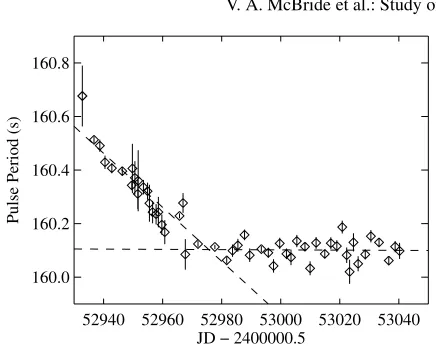
We have analysed all pointed PCAdata in the 2−20 keV energy range and determined pulse periods as a function of time. Initially, to derive the pulse period, we used a Lomb-Scargle analysis (Press & Rybicki 1989). Since the resulting values had a rather high uncertainty, the method of phase con-nection (Deeter et al. 1981; Muno et al. 2002) was applied in a second step: average pulse profiles (with an initial period of P = 160.4 s) for data sets of individualRXTEorbits (of typ-ical length 1 to 3 ks) were produced and phase connected by an integer number of pulse cycles. Using an improved solution for the pulse ephemeris, including ˙P, also the larger gaps be-tween data sets could be uniquely bridged. The result is shown in Fig. 6. The measurements are consistent with an initial pe-riod of 160.58 s at MJD 52 930 and an average spin-up until MJD 52 971 of ˙P=−0.0101±0.0003 s day−1.
272 V. A. McBride et al.: Study of the cyclotron feature in MXB 0656-072
52940 52960 52980 53000 53020 53040 JD − 2400000.5
160.0 160.2 160.4 160.6 160.8
[image:7.595.73.291.69.242.2]Pulse Period (s)
Fig. 6.Pulse period as a function of time through the outburst, with a linear fit to the data.
From the average X-ray flux in the 2−10 keV band (4.35× 10⁻⁹erg cm−2s−1) we can calculate the X-ray luminosity if the distance to the source is known. Using our estimate of 3.9±0.1 kpc for the source distance from Sect. 5.1, the X-ray luminosity of the source is 6.6±0.4 ×1036erg s−1. Then a straightforward application of the accretion torque model by Ghosh & Lamb (1979) (Eq. (15) with standard neutron star pa-rameters and our own values ofB = 3.67×10¹²G and L
x =
6.6×1036erg s−1) yields a spin-up rate of ˙P=−0.0034 s day−1. This is about a factor of three smaller than the observed value. We do not consider this a problem, as accreting binary pulsars very generally show a broad range of behaviour with respect to the development of their spin periods with time (for reviews see Nagase 1989 and Bildsten et al. 1997). This includes episodes of spin-up and spin-down, depending on the exact conditions of accretion at the time. For a transient in outburst such as MXB 0656-072 one would expect to observe a strong spin-up, since under the greatly increased mass accretion rate, as evi-denced by the large increase in X-ray luminosity, the system will tend to be far from any equilibrium condition.
6. Summary
From analysis of the pointed RXTE observations of MXB 0656−072 and limited optical data available we can deduce the following:
– The X-ray spectrum continuum is best fit by a power law model with an exponential cutoff, where a Gaussian func-tion with an energy dependent width is used to smooth dis-continuities at the cutoffenergy.
– A cyclotron resonance scattering feature is present at an energy of 32.8+0.4
−0.5keV and the energy is independent of the continuum model used to describe the spectrum. The CRSF is present at this energy in all observations throughout the outburst. The CRSF is present throughout the entire neutron star spin phase, but the width and depth of the feature show variation through the spin phase.
– Although there is no convincing evidence for higher har-monic cyclotron lines in this data, the possibility of a higher harmonic cannot be ruled out.
– The magnetic field inferred from the cyclotron energy (by assuming that the detected line is the fundamental CRSF) is 3.67+0.04
−0.06×10
12G.
– On the basis of optical photometric data, the distance to MXB 0656−072 is estimated to be 3.9±0.1 kpc.
– Over the time considered, we have measured a strong spin-up (about 0.45 s in 30 days), which appears quite reason-able under the conditions observed in this high mass X-ray binary in outburst.
Acknowledgements. V.A.M. would like to acknowledge the NRF(S.Africa), the British Council and Southampton University. I.K. acknowledges DLR grants 50 OG 9601 and 50 OG 0501.
References
Bartolini, C., Casares, J. V., Guarnieri, A., et al. 2005, Informational Bulletin on Variable Stars, 5663, 1
Beloborodov, A. M. 2002, ApJ, 566, L85
Bildsten, L., Chakrabarty, D., Chiu, J., et al. 1997, ApJS, 113, 367 Bulik, T., Gondek-Rosi´nska, D., Santangelo, A., et al. 2003, A&A,
404, 1023
Clark, G., Schmidt, G., & Angel, J. 1975, IAU Circ., 2843
Coburn, W. 2001, Ph.D. Thesis (University of California, San Diego) Coburn, W., Heindl, W. A., Gruber, D. E., et al. 2001, ApJ, 552, 738 Deeter, J. E., Pravdo, S. H., & Boynton, P. E. 1981, ApJ, 247, 1003 Dickey, J. M., & Lockman, F. J. 1990, ARA&A, 28, 215
Ghosh, P., & Lamb, F. K. 1979, ApJ, 234, 296
Heindl, W., Coburn, W., Kreykenbohm, I., & Wilms, J. 2003, ATel, 200
Jahoda, K., Markwardt, C., Radeva, Y., et al. 2006, accepted, ApJS, [arXiv:astroph/0511531]
Kaluzienski, L. 1976, IAU Circ., 2935
Kretschmar, P., Pan, H. C., Kendziorra, E., et al. 1997, A&A, 325, 623 Kreykenbohm, I. 2004, Ph.D. Thesis (Institut für Astronomie und
Astrophysik, Tübingen)
Kreykenbohm, I., Coburn, W., Wilms, J., et al. 2002, A&A, 395, 129 Kreykenbohm, I., Wilms, J., Coburn, W., et al. 2004, A&A, 427, 975 Liu, Q., Paradijs, J., & van den Heuvel, E. 2001, A&A, 368, 1021 Lomb, N. R. 1976, Ap&SS, 39, 447
Makishima, K., Ohashi, T., Kawai, N., et al. 1990, PASJ, 42, 295 Mihara, T. 1995, Ph.D. Thesis (University of Tokyo)
Mihara, T., Makishima, K., Ohashi, T., Sakao, T., & Tashiro, M. 1990, Nature, 346, 250
Morgan, E., Remillard, R., & Swank, J. 2003, ATel, 199
Muno, M. P., Chakrabarty, D., Galloway, D. K., & Psaltis, D. 2002, ApJ, 580, 1048
Nagase, F. 1989, PASJ, 41, 1
Nagase, F., Hayakawa, S., Makino, F., Sato, N., & Makishima, K. 1983, PASJ, 35, 47
Pakull, M., Motch, C., & Negueruela, I. 2003, ATel, 202 Press, W. H., & Rybicki, G. B. 1989, ApJ, 338, 277
Rothschild, R. E., Blanco, P. R., Gruber, D. E., et al. 1998, ApJ, 496, 538
Santangelo, A., Del Sordo, S., Segreto, A., et al. 1998, A&A, 340, L55 Scargle, J. D. 1982, ApJ, 263, 835
Stella, L., White, N., & Rosner, R. 1986, ApJ, 308, 669
Tanaka, Y. 1986, in IAU Coll. 89: Radiation Hydrodynamics in Stars and Compact Objects, ed. D. Mihalas, & K. H. Winkler (New York: Springer)
Wegner, W. 1994, MNRAS, 270, 229