University of Warwick institutional repository: http://go.warwick.ac.uk/wrap This paper is made available online in accordance with
publisher policies. Please scroll down to view the document itself. Please refer to the repository record for this item and our policy information available from the repository home page for further information.
To see the final version of this paper please visit the publisher’s website. Access to the published version may require a subscription.
Author(s): Anders Pedersen, Kefeng Zhang, Kristian Thorup-Kristensen and Lars S. Jensen
Article Title: Modelling diverse root density dynamics and deep nitrogen uptake—A simple approach
Year of publication: 2009 Link to published version:
http://dx.doi.org/10.1007/s11104-009-0028-8
1
2
3
4
5
6
7
8
9
Modelling diverse root density dynamics and deep nitrogen uptake – A simple approach
Pedersen A.1,2, Zhang, K.3, Thorup-Kristensen K.2* and Jensen L.S.1
1)
University of Copenhagen, Faculty of Life Sciences, Department of Agricultural Sciences, Plant
and Soil Science, Thorvaldsensvej 40, DK-1871 Frederiksberg C., Denmark.
2)
University of Aarhus, Faculty of Agricultural Sciences, Department of Horticulture,
Kirstinebjergvej 10, DK-5792, Aarslev, Denmark.
3)
Warwick HRI, the University of Warwick, Wellesbourne, Warwick CV35 9EF, UK
10
11
12
13
14
15
*E-mail: [email protected], Phone: +45 89993228, Fax: +45 89993494
Text pages: 29
Tables: 1
Figures: 12
Abstract
1
2
3
4
5
6
7
8
9
10
11
12
13
14
15
16
17
18
19
20
21
22
We present a 2-D model for simulation of root density and plant nitrogen (N) uptake for crops
grown in agricultural systems, based on a modification of the root density equation originally
proposed by Gerwitz and Page (1974). A root system form parameter was introduced to describe the
distribution of root length vertically and horizontally in the soil profile. The form parameter can
vary from 0 where root density is evenly distributed through the soil profile, to 8 where practically
all roots are found near the surface. The root model has other components describing root features,
such as specific root length and plant N uptake kinetics. The same approach is used to distribute
root length horizontally, allowing simulation of root growth and plant N uptake in row crops.
The rooting depth penetration rate and depth distribution of root density were found to be the most
important parameters controlling crop N uptake from deeper soil layers. The validity of the root
distribution model was tested with field data for white cabbage, red beet, and leek. The model was
able to simulate very different root distributions, but it was not able to simulate increasing root
density with depth as seen in the experimental results for white cabbage. The model was able to
simulate N depletion in different soil layers in two field studies. One included vegetable crops with
very different rooting depths and the other compared effects of spring wheat and winter wheat. In
both experiments variation in spring soil N availability and depth distribution was varied by the use
of cover crops. This shows the model sensitivity to the form parameter value and the ability of the
model to reproduce N depletion in soil layers. This work shows that the relatively simple root
model developed, driven by degree days and simulated crop growth, can be used to simulate crop
soil N uptake and depletion appropriately in low N input vegetable production systems, with a
Introduction
1
2
3
4
5
6
7
8
9
10
11
12
13
14
15
16
17
18
19
20
21
22
Plant and soil models are commonly used to predict crop yield and the environmental impact of
crop production. Such models often combine complex modelling of water movement, soil organic
matter turnover and aboveground plant growth. Simulation of root growth is an important part,
because roots are the link between mineral N in soil and plant N. Good models of crop root growth
is important to simulate N use efficiency within rotations (Delgado et al. 2000).
While the simulation of aboveground plant growth has become increasingly advanced over the
years, root modelling has remained fairly simple due to the lack of field data to calibrate more
sophisticated root models at field scale. Some root models including detailed modelling of
individual roots have been developed (Kohl et al., 2007; Pages et al., 2004). However, such models
are mainly used for scientific work and are generally not suitable for simulation of real crop
rotations because of a lack of input data and because the models are often only developed for one or
a few plant species.
Recent field studies have shown that the development of crop rooting depth can be described by a
lag phase starting at sowing or transplanting, after which root depth increases linearly with
temperature sum (Kage et al., 2000; Smit and Zuin, 1996; Thorup-Kristensen and Van den
Boogaard, 1998).
Rooting depth and root architecture differ significantly between crop species (Kutschera, 1960). For
monocot species, root penetration rates in the range of about 0.2 mm day-degree-1 have been
observed for onion (Thorup-Kristensen, 2006a) and 0.8 to 1.2 mm day-degree-1 for cereals and
grasses (Thorup-Kristensen, 2001). For dicot species, penetration rates are about 0.7 mm
day-degree-1 or even higher for white cabbage and fodder radish (Smit and Groenwold, 2005;
Thorup-Kristensen, 2001). Final rooting depth is related to penetration rate and length of growing
season. Thus onions develop only a very shallow root system down to approximately 0.2 to 0.3 m
(Burns, 1980; Thorup-Kristensen, 2006a), ryegrass roots grow to approximately 1 m while white
cabbage, red beet and fodder radish can grow to 2 m or more (Thorup-Kristensen, 2006b). 1
2
3
4
5
6
7
8
9
10
11
12
13
14
15
16
17
18
19
20
21
22
23
Monocots and some dicot species have their highest root length densities near the surface, as
observed in winter wheat (Asseng et al., 1997; Xue et al., 2003; Zuo et al., 2006), grasses (Smit and
Groenwold, 2005; Thorup-Kristensen, 2001) and cauliflower and spinach (Kage et al., 2000; Smit
and Groenwold, 2005). However, many dicot species have a more uniform distribution of root
length density in the soil profile, often with higher root densities in deeper soil layers than monocot
species, as found e.g. for oilseed rape (Barraclough, 1989) and fodder radish (Smit and Groenwold,
2005; Thorup-Kristensen, 2006b). For crops grown as row crops, e.g. maize and many vegetable
species, a significant difference in root density below and between rows has been shown for maize
(Liedgens and Richner, 2001), onion and carrot (Thorup-Kristensen, 2006a; Thorup-Kristensen and
van den Boogaard, 1999), whereas lettuce and white cabbage typically show the same root density
below and between rows already during their early growth (Thorup-Kristensen, 2006a).
The development and proliferation of the roots in soil are affected by intrinsic and extrinsic
parameters such as the supply of photosynthates from the shoot, the nutrient status of the plant, soil
type and compaction, water potential at the root surface and availability and distribution of nutrients
(Bloom et al., 2003; Forde and Lorenzo, 2001). Root penetration rate in root models is often
described as being affected by air or soil temperature and a plant-specific growth rate coefficient.
The daily growth rate is associated with water stress, soil compaction, clay or sand content and
1
2
3
4
5
6
7
8
9
10
11
12
13
14
15
16
17
18
19
20
21
22
A number of one-dimensional (1-D) models have been developed for modelling the soil-plant
system to enable prediction of plant production, water and nitrogen dynamics in agricultural
systems. In 1-D models, the soil column is divided into layers from the surface to a defined depth.
Each layer can be assigned standard or specific parameters such as nutrient concentration, water
content, temperature, bulk density, or soil strength. As 1-D models only distribute roots according
to depth, this prevents them from taking into consideration the uneven root distribution of row
crops. Two-dimensional (2-D) and three-dimensional (3-D) root models, on the other hand, are able
to simulate spatial differences in nutrient uptake and root distribution of row crops, which leads to
much more complex soil water and N dynamics.
Gerwitz and Page (1974) introduced a logarithmic function for root density calculations in 1-D
systems. The function gives the percentage of roots for a given rooting depth, with the highest root
density near the soil surface. The function has been modified and used in the Daisy model by
Abrahamsen and Hansen (2000). Here root density is set to a very low default value at the bottom
of the rooting zone, so a very low root density will always be simulated close to the rooting depth;
variations in total root length have little effect on subsoil root length and nearly all variation is
confined to the surface soil layers. This approach to root modelling prevents the model from
simulating the relatively high root densities sometimes observed in deeper soil layers. Further,
rooting depth in the model means absolute rooting depth, whereas the measured rooting depths used
for parameterization normally does not. In the experimental data roots are also present below the
observed rooting depth, and by using these values as estimates of absolute rooting depth in the
model, the simulated root exploration of the subsoil will be less efficient than actually indicated by
1
2
3
4
5
6
7
8
9
10
11
12
13
In this work we present a model for root growth and proliferation of root length density in the soil
profile, assess whether this model is able to simulate a range of crop root systems, their N uptake
and their soil mineral N depletion, and compare these against experimental field data. The purpose
of this root model is to model a variety of arable and vegetable crop species and reproduce results
from field experiments for soil mineral N depletion with a simple root modelling approach and a
minimum of parameters and input requirements.
The objective of the present work was to test the ability of the newly developed root model to
simulate root development and N depletion in the soil profile as known from the literature, and to
compare simulated soil mineral N depletion against field observations for vegetable crops with
different root patterns. The model was tested with respect to its: a) ability to simulate rooting depth
and partitioning of root length density in the rooted zone, b) sensitivity of plant N uptake to
parameter values determining root distribution, root growth and root system N uptake efficiency,
Materials and methods
1
2
3
4
5
6
7
8
9
10
11
12
13
14
15
16
17
18
19
20
Plant and soil modules
The root model operates as a module in an integrated soil-plant-atmosphere model. In brief, other
modules in the model include an aboveground crop development and N demand module
(Greenwood et al., 1996; Greenwood et al., 2001), a soil organic matter, soil microbial biomass and
decomposition of added organic matter module from the Daisy model (Hansen et al., 1991) and a
water balance module (Brisson et al., 2003). While the root model simulate N uptake processes, the
other soil N processes such as N mineralization, immobilization, denitrification and ammonia
volatilization are modelled as described by Hansen et al. (1991).
The model runs on a daily basis. The information fed into the root module from other modules
includes soil water content, ammonium and nitrate concentrations, root biomass increment and crop
potential water and N demand, together with the climatic data, soil clay content and bulk density
from the model run setup files. All processes are calculated in 0.05 m x 0.05 m grid units within the
soil domain of 2 m depth vertically and half the row width horizontally. Root density is calculated
in 0.05 x 0.05 m soil units, up to 1 m horizontally (controlled by row width) and to 2 m depth
vertically, and when root depth or width enters the centre of a new soil unit, root density is
calculated and plant N uptake occurs. For crops planted more spatially homogeneously (row width
< 0.1 m), the model operates in 1-D and only one soil column with 0.05 m width is considered.
Root module – 1-D model
Root growth calculation is based on cumulative day-degrees (DD, Equation 1), which is common
for root models (Kage et al., 2000) and has been shown in field trials to be applicable to both
monocot and dicot crops (Kirkegaard and Lilley, 2007; Smit and Groenwold, 2005). 1 2 3 4 5 6 7
rz Rz
Equation 1
min
min min max
max min max
0 ; - ; - ; air air air air T T
T T T T T
DD T
T T T T
≥
⎧ ⎫
⎪ ≤ < ⎪
= = ⎨ ⎬
⎪ ≥ ⎪
⎩ ⎭
∑
A lag phase (DDlag) in terms of DD is set to account for the period from seed germination or
transplanting to root penetration. The root penetration depth (Rz) is calculated as follows.
Explanations of abbreviations used in the equations are shown in Table 1.
Equation 2
z-min
z-min
max z-min max
R ;
(( ) )+ R ;
; + R lag
lag rz lag
z
z lag
DD DD
DD DD k DD DD
R
R− DD DD k −
⎧ ≤ ⎫
⎪ ⎪
− >
= ⎨ ⎬
⎪ − > ⎪
⎩ ⎭
∑
∑
∑
∑
8 9 10 11 12 13 14 15 16 17The calculation of root penetration in the horizontal direction is similar with Equation (2), and the
calculation is restricted to the rooting depth. The initial root system starts with the root depth 0.1 m
and begins to grow horizontally and vertically after the DDlag. The model calculates the root
penetration depth until 2 m. Rz-max is default 2 m and can be adjusted in the setup file for soil
information.
Root density
The total root length (Lr) is calculated from root biomass (Wr) by assuming a specific root length
density (Sr) (Equation 3). The equation for root density distribution is a modified form of the
a logarithmic function down to the simulated rooting depth Rz, while below Rz it decreases linearly
to zero at q=1.3 (Equation 4). 1
2
r 3 Equation 3Lr =W Sr
Equation 4 ( ) ( ) 0 0 z z ;
1 ; R
0 ; z > R
z
z z a z
z
a R z
z z
z z
L e z R
z R
L L e q z R
qR R
q
−
−
⎧ < ⎫
⎪ ⎪
⎛ ⎞
⎪ −
=⎨ ⎜ − ⎟ > ⎬
− ⎝ ⎠ ⎪ ⎪ ⎪ ⎪ ⎩ ⎭ ⎪ > 4 5 6 7 8
Plant N uptake
Assuming a uniform distribution of roots in a soil unit, the potential nitrate and ammonium uptake
in each unit is calculated by modifying the equation from Nielsen and Barber (1978) with root
length as shown in Equation 5.
Equation 5 ( , ) r ( min)
pot
L kN c c
N i j
kf c − = + 9 10 11 12 13 14 15
The calculations for nitrate and ammonium uptake are similar, but they are calculated separately for
each unit and accumulated for the whole soil profile. Ammonium only appears in the first 6 soil
layers (0 - 0.30 m) in the model.
Actual plant N uptake is calculated from the potential N uptake accumulated for the whole rooted
zone and the plant N demand comes as external information from the crop module. Equation 6
shows the calculation of actual plant N uptake.
Equation 6
pot 3 pot 4 demand N ( ) N ( )
2-D root system
1
2
3
4
5
6
7
8
9
10
11
12
13
14
15
16
17
18
19
20
21
22
In the 2-D model the soil domain is divided into a 0.05 m x 0.05 m grid. If a row crop has a row
width greater than 0.1 m, the root module calculates root density in 2-D. The default root model
assumes the same penetration rate in both directions, but different form parameters (az and ax) are
used for vertical and horizontal root density distribution. Horizontal growth stops in the middle of
the inter-row, and competition between crop rows is not allowed in this model.
Model simulations
For testing the significance of parameter values, model simulations were run for 110 days starting
from 1 April, with typical Danish weather conditions averaged for the period 1960-1990.
Precipitation/irrigation was set according to evapotranspiration, to ensure a minimum downward
percolation of nitrate during the crop growth period. Soil texture was selected so that it did not
restrict the root penetration rate and root distribution. The default parameter values in the root
module are shown in Table 1 and the method was tested with form parameter value az ranging from
0 to 8. Potential crop N demand in the model corresponded to 250 kg N ha-1 and simulations were
carried out for both soil mineral N contents below and above sufficient supply for this demand. For
the low soil N conditions, 70 and 32 kg mineral N ha-1 were distributed in the 0-1 and 1-2 m depth,
respectively. For the high soil N conditions, 415 and 185 kg mineral N ha-1 were distributed in the
0-1 and 1-2 m depth, respectively. The effects of root penetration rate krz, and plant N uptake
efficiency kN were also studied. To do so, the model was run with settings of krz=90% of default
value (0.0009 m DD-1); and Sr=90% of the default value (270000 m kg-1 DW). In addition, the root
depth extension value was tested by setting values of q=1.3 (default) and q=1.0.
A sensitivity analysis was carried out for three different parameters in the root model. These were
the sensitivity of the root depth penetration rate (k
1
2
3
4
5
6
7
8
9
10
11
12
13
14
15
16
17
18
19
20
21
22
23
rz), which controls how fast the roots occupy a
new soil layer and soil depth for roots distributed with the logarithmic function; the specific root
density (Sr), used to calculate the root length in each soil unit influencing the potential and actual
plant N uptake; and the root zone extension depth (q), which is the extra root zone where root
density declines linearly below the simulated rooting depth. These three parameters were tested
with a range of values for the form parameter in order to test their different influence on plant N
uptake.
Comparison against experimental data
Values of soil mineral N depletion and root density distribution produced by the model were
compared with the results from three field experiments, one including variable N supply for a white
cabbage crop, one comparing N dynamics in short rotation sequences including vegetable crops
with very different root growth (Thorup-Kristensen, 2006b), and one comparing winter wheat and
spring wheat with or without a preceding cover crop (Thorup-Kristensen et al., 2009)
In the first experiment white cabbage was transplanted on 18 April and harvested on 21 October
2004. Soil mineral N was measured on 12 May and 26 October 2004. For this study we selected
five of the fertiliser levels (A-E) included in this experiment, represented by Y1:Y2, where Y1 was
the N application in the preceding year (2003) to a cauliflower crop, and Y2 was the N application
on 18 May 2004 (kg mineral N ha-1). The treatments were: A: 0:0, B: 230:0, C: 0:120, D: 230:120
and E: 390:120. No N application in 2003 (Y1=0) resulted in low mineral N content in spring,
whereas the two higher levels of N application in 2003 left high residual N levels in the subsoil.
Therefore this experiment is ideal for testing the ability to simulate deep root growth and N
location has been reported elsewhere (Thorup-Kristensen 2006b). Simulated mineral N depletion of
soil was tested with different a
1
2
3
4
5
6
7
8
9
10
11
12
13
14
15
16
17
18
19
20
21
22
23
z values of the white cabbage root model and compared with
measured data from this experiment. Crop parameters adopted in simulations were DDlag 100, krz
0.0014. In the simulation, the values 0, 1, 1.5, 2, 3, 4, 5, 6, 7, and 8 were tested for parameter az.
Measured plant N uptake at harvest was compared with the az parameter. Measured soil mineral N
values from the spring were used as initial conditions in the simulations and measured mineral N
contents in late October in soil layers 0-1 m and 1-2 m were then compared with the values
predicted by the model.
The validity of the model was also tested against data from an experiment with three different
vegetable crops representing shallow-rooted with low root density (leek), deep-rooted with medium
root density (red beet) and deep-rooted with high root density (white cabbage). Leek, red beet and
white cabbage were grown after a ryegrass cover crop or no cover crop in the preceding autumn,
with two replicates, and the experiment was repeated in two years. Mineral N in the soil was
measured on 18 May and 31 October 2001 and 16 May and 30 October 2002 (Thorup-Kristensen,
2006b). Crop parameters adopted in the simulations were: DDlag 200, krz 0.0004, az 8, ax 8 for leek,
DDlag250, krz 0.0009, az 2, ax 2 for red beet, and DDlag100, krz 0.001, az 1.5, ax 1.5 for white
cabbage. Measured soil mineral N values from the spring were used as initial conditions in the
simulations and measured mineral N contents in late October after vegetable harvest in the soil
layers 0-1 and 1-2 m were compared with model simulated results.
Finally the model was tested against data from an experiment with comparing winter wheat to
spring wheat grown after a cover crop or with no preceding cover crop. The experiment was
repeated in three years with different precipitation patterns. The crucifer cover crop was very deep
respectively (Thorup-Kristensen et al., 2009). Measured soil mineral N values from August before
sowing of winter wheat and the cover crop were used as initial conditions in the simulations and
measured mineral N contents in four soil layers (0-0.5, 0.5-1, 1-1.5, and 1.5-2 m) in November and
again after wheat harvest in August in the next year were compared to model simulated results.
Crop parameters adopted in the simulations were: DD
1
2
3
4
5
6
7
8
9
10
11
lag 100, krz 0.001, az 2 for spring and winter
wheat, and DDlag100, krz 0.0025, az 1.5 for the brassica cover crops.
Statistical analysis:
Statistical analyses were conducted to evaluate the performance of the model in predicting soil
mineral N using the Root Mean Square Error (RM+SE) approach. RMSE was calculated as shown
in equation 7. Here Oiwas the observed value in the field experiment and Pi was the value predicted
by the model, both with units (kg N ha-1) and with n number of observations.
Equation 7
2
(Oi Pi)
RMSE
n
Results
12
3
4
5
6
7
8
9
10
11
12
13
14
15
16
17
18
19
20
21
Root density distribution
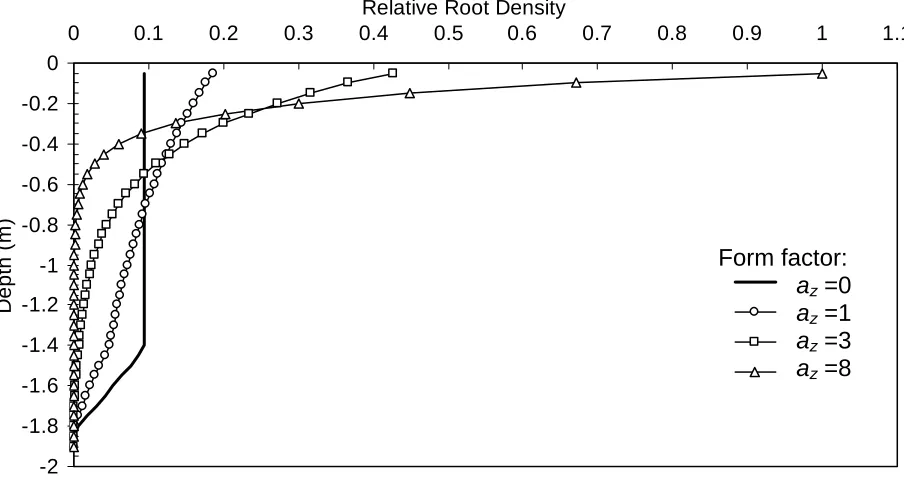
Figure 1 shows the root length distributions obtained with different values of the parameter az after
110 days, equal to 1400 DD and assuming a q=1.3 (Table 1). With form parameter az=0, the roots
were distributed evenly in the soil profile to the current simulated rooting depth, while az>0 gave an
exponential decline in root density with depth. When az>3, the majority of the roots were found
close to the soil surface. The fraction of root density in the extended zone (controlled by q) where
root density decreases linearly with depth was high when az=0 compared with that calculated with
higher az values.
Plant N uptake
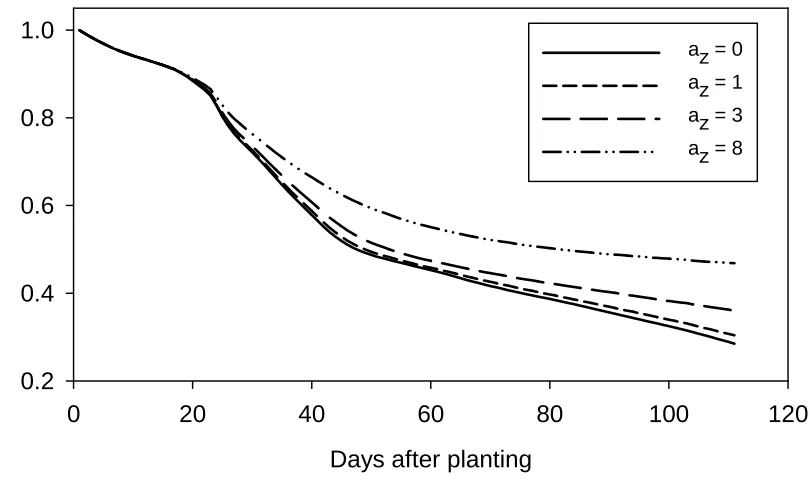
In situations where the mineral N level in the topsoil was lower than the plant N demand, the form
parameterhad a significant impact on plant N uptake and soil mineral N depletion. Figure 2 shows
model simulations with different form parameter values and their impacts on soil mineral N
depletion, which has the same value as plant N uptake. The value az=0 resulted in fast plant N
uptake and the highest N depletion from the soil. The form parameter value az=1 resulted in slightly
slower uptake, whereas az=3 or 8 led to more significant reductions in N uptake.
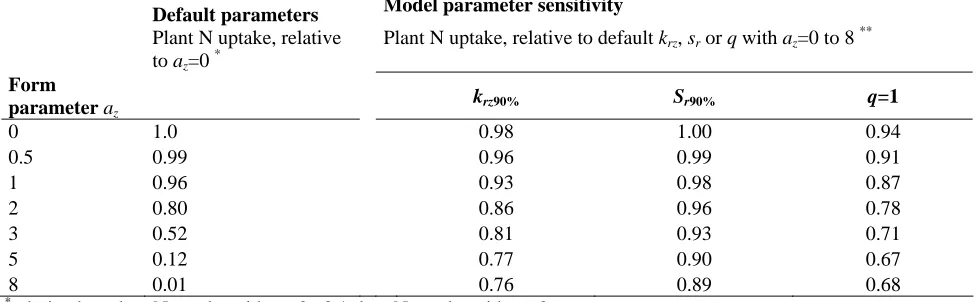
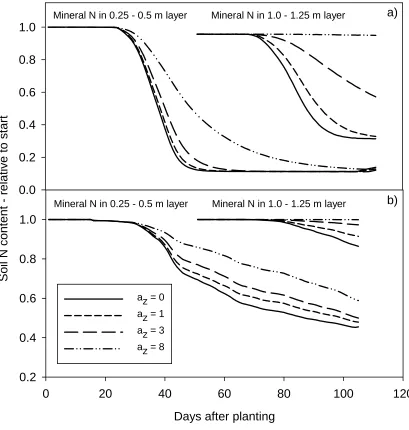
Soil mineral N depletion occurred rapidly when roots reached the 0.25-0.5 m soil layer when az=0,
1 or 3, whereas a form parameter az=8 led to a rather slow depletion of this layer (Figure 3a), when
soil N contents were below plant N uptake demand. In the 1-1.25 m soil layer, az=0 and 1 led to a
later but still rather fast mineral N depletion, but this depletion was slower for az=3 and az=8,
where the fractions of plant N uptake compared to az=0 were only 0.52 and 0.01 respectively at the
in the first soil layer, 99% of this was taken up within two days with az=8, while it took 12 days
with a
1
2
3
4
5
6
7
8
9
10
11
12
13
14
15
16
17
18
19
20
21
22
z=0 (data not shown). Simulations where soil mineral N content exceeded crop N demand
(Figure 3b) showed similar differences, but against a background of generally much less efficient
soil mineral N depletion. While high az values led to low subsoil root density, they increased topsoil
root density and plant N uptake capacity.
Sensitivity analysis
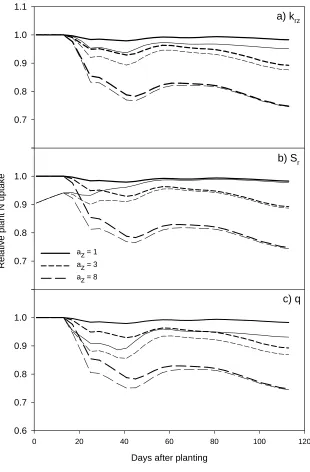
The sensitivity of N uptake to variation in root depth penetration rate (Krz) was moderate, as the
reduction in N uptake was always less than 10% when depth penetration rate was reduced with 10%
(Figure 4a). With form parameter values az= 1 and 3, plant N uptake interacted with root
penetration rate, because with these az values the crop had the potential to produce high root
densities and take N also in deep soil layers, and therefore a delayed depth penetration reduced
uptake from deep soil layers. With az=8 plant N uptake was insensitive to root penetration rate
(Figure 4a), as even with the faster root penetration very few roots reached the deep soil layers. For
all three az values the effect on N uptake relatively stronger during early growth, when the root
system was still colonizing N rich upper soil layers.
Simulated N uptake was found to be sensitive to specific root length parameter (Sr) especially at
very early growth stages, whereas during later growth stages the effect almost disappeared. During
very early growth N uptake was reduced by 10% when Sr was reduced to 90% (Figure 4b). The
pattern of response did not vary depending on the az values.
Similarly to root penetration rate, the root zone extension factor q had a larger effect on the relative
plant N uptake during the simulation with low form parameter values than with az=8 where only a
4c). Reducing Krz and removing the q factor both reduce root development at the deeper parts of
the root system, and therefore mainly have an effect on root systems which have a significant part
of their roots in the deeper part of the root system. 1
2
3
4
5
6
7
8
9
10
11
12
13
14
15
16
17
18
19
20
21
2-D simulation
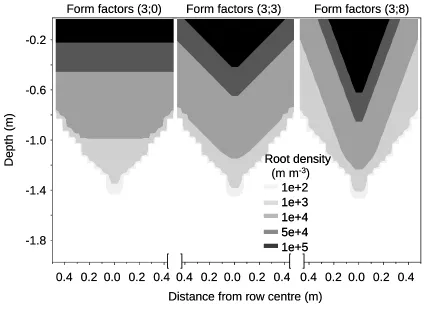
Figure 5 shows simulated 2-D root density in a soil profile with three different ax values for a crop
grown with a row width of 1 m. Simulations with the form parameter values ax=0 showed a high
and evenly distributed root density in the surface layer. When ax was increased to 3 or 8, the root
density right below the crop row became higher and density in the soil between rows were reduced.
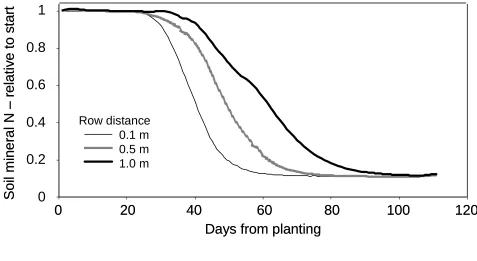
Figure 6 shows N depletion with three different row widths, simulated using az=3 and ax=3. When
row distance was only 0.1 m, and the model simulates the soil as a 1-D system, the crop depleted
the soil mineral N by 50% in the 0.25-0.5 m layer within 40 days and had consumed all available
soil mineral N by day 60. These values changed to days 50 and 75 for a row width of 0.5 m and to
days 60 and 100 for a row width of 1 m (Figure 6). With a row distance of 0.5 m and using the
default model setup and parameterization, the simulated N uptake showed very little sensitivity to
variation in the az value (data not shown).
Model comparison against field experimental data
The value of the form parameter az for simulating root distribution was tested against data from
field experiments. The distribution of roots into depth in the simulations matched root data for
but not for day 153 (Figure 7c). Simulated root distribution using az parameter values between 0
and 1.5 had a higher part of the roots below 1 m, and in this way they mimicked the field data from
the last measurement date better, whereas when a
1
2
3
4
5
6
7
8
9
10
11
12
13
14
15
16
17
18
19
20
21
22
z>1.5 the match became very bad with far too low
root densities below 1 m.
When the inorganic N content was lower than plant N uptake capacity and some soil mineral N was
found in deeper soil layers, simulated crop N uptake was reduced at high az parameter values, and
predicted plant N uptake was lower than experimental data, as illustrated with fertiliser levels A and
B in Figure 8a. When high N levels were found in the 0-1 m soil layer, plant N uptake in the
simulations corresponded to field data and was not sensitive to the az value, as illustrated with
fertiliser levels D and E. Mineral N left by the crop in different soil layers was highly affected by
the different az values (Figure 8bc). For fertiliser levels A, B and C, the model depleted the 0-1 m
soil layer to lower N levels than indicated by field data, and the sensitivity was less than at levels D
and E, and at any fertiliser level in the 1-2 m soil layer. The model accurately predicted mineral N
content in the 1-2 m soil layer for az=0 to 2, indicating that simulation of a high root density below
1m depth is needed to simulate the N depletion measured in this soil layer in field experiments.
Comparing measured soil inorganic N data to simulations using different az values for three
vegetable crops (Figure 9) show that for cabbage the best fit (lowest RMSE) in both the 0-1 and 1-2
m soil layers were obtained with az=1.5. Especially in the subsoil the predictions became very bad
with higher az values. With leek the RMSE values for the 0-1 m soil layer declined gradually with
increasing az values, reaching its lowest value at az=8. In the 1-2 m layer there was no effect of
changing az, in accordance with the fact that the simulated leek crop did not have any roots below 1
values in both the 0-1 and 1-2 m soil layers, whereas high RMSE values in the 1-2 m soil layer were
found using a
1
2
3
4
5
6
7
8
9
10
11
12
13
14
15
16
17
18
19
20
21
22
z values between 0 and 3.
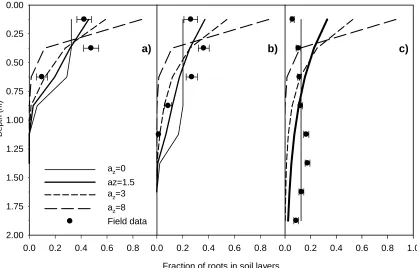
When field observed root distribution of three vegetable crops was compared with simulations, the
simulations of the leek root system matched observed data well (Figure 10). Leek had a root
distribution with high root density in the topsoil, and then declining fast with depth, corresponding
to simulated root density distribution using high az values. Red beet also showed a reasonable match
between measured and simulated data using az=2, though the model overestimated root density in
the top 0.25 m, and underestimated root density somewhat between 1 and 1.75 m. Cabbage had a
root distribution where the highest root densities were found between 0.75 and 1.5, a distribution
which cannot be simulated by the root model, as also illustrated in Figure 7c.
The simulated soil mineral N content after the three vegetable crops following either a ryegrass
cover crop or no cover crop in the previous autumn was reasonably correlated with field
observations in the 0-1 m and 1-2 m soil layers (Figure 11). With no cover crop, the N content in
surface soil layer was low and subsoil mineral N content was high. The model was able to simulate
the effects of these different starting conditions, and their interaction with rooting depth of the three
vegetable crops. Results revealed that leek only depleted the 0-0.5 m soil layer, due to its shallow
root system, while red beet depleted the 0-1 m soil layer and white cabbage the whole 0-2 m layer
for mineral N in the simulations, as well as in the field experiment. In the 0-1 m soil layer, the
model underestimated soil mineral N content on the day of harvest by on average 33% or 10 kg N
ha-1. In the subsoil layer (1-2 m), the model underestimated soil mineral N content for red beet in
the simulations without cover crops, whereas the results for leek and cabbage were in good
1
2
3
4
5
6
7
8
9
10
11
12
13
14
15
16
17
18
large variation in soil mineral N content and depth distribution produced by the three very different
root systems and the preceding cover crop effect.
Finally, the model was tested against a dataset including effects of crops with very different rooting
depths and timing of root growth, leading to very different amounts and depth distributions of soil
inorganic N. The crops were winter wheat, spring wheat, and a crucifer cover crop followed by
spring wheat (Thorup-Kristensen et al., 2009). The simulation covered more than 12 months from
sowing of the cover crop in early August to wheat harvest in August of the following year. The
results show that the model is able to predict major effects of the experimental treatments and how
they interact with weather conditions (Figure 12). In all three years it simulates correctly the fact
that the deep rooted crucifer cover crop is able to deplete soil inorganic N effectively to 2 in
November. After wheat harvest in August it simulated repeatedly that spring wheat depleted the top
0.5 m as effectively as winter wheat, but that especially from 1 to 2 m much more inorganic N was
left under spring wheat following bare soil than under winter wheat. In the 1-2 m soil layer it
simulated that very little inorganic N would be present under winter wheat because of its deep
rooting and under spring wheat grown after the cover crop, as the cover crop had prevented N
leaching to this deep soil layer. The model was even able to simulate that soil inorganic N content
under winter wheat was higher in the 1.5-2 m layer than in the 1-1.5 soil layer, as the winter wheat
Discussion
1
2
3
4
5
6
7
8
9
10
11
12
13
14
15
16
17
18
19
20
21
Root penetration and density distribution
The assumption of an exponential decrease in root length density with depth has been adopted in
several models, with a fixed low root density at the calculated rooting depth, but a varying form
factor to distribute increased root length mainly with increasing root density in the uppermost soil
layers (Abrahamsen and Hansen, 2000; Barraclough and Leigh, 1984; Greenwood et al., 1982).
This exponential decrease has been shown to match monocots such as grasses and cereals
reasonably well and was demonstrated here also for the vegetable crop leek, but not for dicot
species such as oil radish or winter rape (Thorup-Kristensen, 2001). In the model presented here, it
was possible to vary the root length density distribution among soil layers, and to increase root
length density in deeper soil layers using a fixed value of the form parameter but allowing root
density to vary at calculated rooting depth. This variation in root distribution provides the
opportunity to simulate a range of different crop species with significantly different root
distribution. The model still had problems simulating the deep root distribution of dicot species
such as white cabbage in late season (Figure 7), but agreement was satisfactory in the earlier part of
the growing season. Using an exponential equation for root density distribution only fully agrees
with most monocot species and some dicot species. However, the purpose of developing this model
was not to simulate root depth distribution very closely, but mainly to develop a root model where it
was possible to simulate crop N uptake from deeper soil layers more appropriately compared with
existing crop models used today.
The root model showed plant N uptake from the entire rooted zone, even when there was a high N
level in the topsoil. Field experiments with high mineral N level in the topsoil layer also show some
plant N uptake from deeper soil layers, indicating that this approach complies with field
observations (Thorup-Kristensen and van den Boogaard, 1998). Plant N uptake from all of the
rooted zone was also supported by a field study where 1
2
3
4
5
6
7
8
9
10
11
12
13
14
15
16
17
18
19
20
21
22
23
24
15
N was added at 0.6 to 1.4m depth in a
carrot crop and from 1 to 2.5m in a cabbage crop (Kristensen and Thorup-Kristensen, 2004). For
both crops a high N inflow rate was found from all positions within the estimated depth of the crop
rooting zone, showing that the crops can deplete deep soil layers for mineral N. In a field
experiment where sugar beet was grown, nitrate concentration was measured in three soil layers
(0-0.2, 0.2-0.4 and 0.7 m depth) and these data showed a two-week delay in N depletion in the
0.4-0.7 m layer compared with the two layers above (Schmied et al., 2000). Furthermore, the two layers
nearer the surface were depleted to the same soil mineral N concentration at harvest, whereas the
deepest layer had a higher soil mineral N concentration. Such a delay in N depletion simulated by
the model is also shown in Figure 3, where depletion of the 1-1.25 m soil layer began at day 75. The
efficiency of plant N uptake in this layer was dependent on the root density distribution, determined
by az and plant N demand and mineral N level in soil layers above.
Simulated depletion of mineral N down the soil profile was highly sensitive to the value of the form
parameter. This makes the description of the root distribution flexible and makes it possible to
represent root systems from crops with very different root profiles. Sensitivity of plant N uptake to
other parameters was also analysed. The root penetration rate was particularly important for
simulation of crops with low azvalue, whereas in the simulations using a high azvalue the subsoil
root density was low, and thus, absolute rooting depth became less important. For the same reason,
simulation results are only sensitive to the q-parameter, when azis low. The sensitivity to the q
significant plant 15N uptake from soil layers below the estimated rooting depth of carrot and sweet
corn, crops which had a clear decline in root density with depth, i.e. a high a
1
2
3
4
5
6
7
8
9
10
11
12
13
14
15
16
17
18
19
20
21
22
23
zvalue.
During early crop growth the simulation of plant N uptake was sensitive to the specific root length
(Sr), affecting total crop root length, but the importance of this parameter decreased during the
simulation. In the beginning of the simulation a 10% reduction in the specific rooting length
resulted in a 10% reduction in plant N uptake, but after about 50 days the effect had almost
disappeared. Such a result is in accordance with the general observation that root growth can often
limit crop nutrient uptake during early growth (e.g. Costigan (1988)), but later during growth the
root system capacity for nutrient uptake is often much higher than the crop demand. Further, this
pattern makes sense, as during early root colonisation of a soil volume, the roots will not yet have
affected soil mineral N concentration, and the root length will be the main varying factor. Later, this
will be compensated as high root density leads to fast soil mineral N depletion and therefore
reduced uptake at a later stage, while soil volumes with fewer roots will sustain some plant N
uptake for a longer time.
When fertilizer was added at the surface and in surplus of the plant N demand the simulations show
that plant N uptake become independent of the az value, showing that the value of az is mainly
important for crop N uptake when too little N is available in the topsoil. At high N supply the value
of az only affects the depth distribution of N left in the soil. Further the test showed that the
simulations with high az deplete the soil layer 0-1 m more effectively than is measured in the field.
This opportunity to alter root distribution is important to allow plant models to describe mineral N
dynamics in mixed rotations of arable and vegetable crops in low or reduced input agricultural
systems, because root distributions differ strongly among arable and vegetable crops (Smit and
1
2
3
4
5
6
7
8
9
10
11
12
13
14
15
16
17
18
19
20
21
22
23
protect the environment, less fertilizer N will be added and there will be more focus on cover crop
use and utilization of residual mineral N in deeper soil layers.
Comparisons between measured and simulated vegetable crops of leek, red beet and white cabbage
(Figures 8 and 11) showed that the model could be parameterized to simulate the measured
depletion of N from the 0-1 m and 1-2 m layers in the autumn at vegetable harvest. This was found
on a background of very different N content in the 1-2 m soil layer in the spring before planting of
vegetables. This was possible even though the simulated root distribution does not comply
accurately with the root distribution measured in the field (Figure 10), but it has previously been
shown that rooting depth may be more important than root density distribution for determining the
ability of crops to deplete soil inorganic N (Thorup-Kristensen, 2001). Robinson et al. (1994)
showed another example based on a 15N study, where soil mineral N was depleted most efficiently
by the crop with the lowest root length density, in this case because of interactions with above
ground plant N status.
The strongest deviation between measured and simulated data was found for red beet in the 1-2 m
soil layer (Figure 11), where the model simulated lower N content than found in the experiment.
This is also the reason why the model optimization showed that an az value above 4 would give the
best simulation of red beet soil N depletion (Figure 9), while it would clearly not simulate a root
system matching the one measured on red beet. This deviation may be due to the simplicity of the
crop model used. In this model crop growth, root growth and N uptake continues at full rate until
the date of harvest. This is relevant for many of the vegetable crops the EU_Rotate model was
developed to simulate, but not for all. Root and tuber crops as onion, potato, red beet, and carrot
will cease to produce leaves during late growth stages while tubers are still growing. Thus, the
low N demand at the late part of its growth period, when the deeper parts of the root system were
developed. In the model simulation this result can be mimicked by using an unrealistically high
value of a
1
2
3
4
5
6
7
8
9
10
11
12
13
14
15
16
17
18
19
20
21
22
23
z, to create a very low subsoil root density. However, developing a crop growth model
allowing reduced N demand at late growth stages would be more relevant, also for simulation of
cereal crops which mature and die off at the end of their growth.
Row crops such as carrots and maize have different rooting depth and root density beneath the crop
rows and in the interrow soil. This root distribution leads to a lower or delayed N depletion in the
soil between rows, as has been demonstrated in field experiments (Liedgens and Richner, 2001;
Schröder et al., 1996; Thorup-Kristensen, 2006a). The model showed high sensitivity to row
distance, but did not show high difference in N depletion with variation of the ax form parameter.
The model simulations are likely to be more sensitive to variation in ax when simulating crops with
slow root growth, than with the faster root growth in the tests made here, but there is a lack of
experimental data available to qualify such tests. The 2-D model will be useful for simulating the
delay in soil mineral N availability to row crops compared to other crops, which will be especially
important for vegetable crops which are harvested at early growth stages.
All in all we find that the root model presented in this paper is an improvement compared to other
simple root models used for crop-soil N simulation models. It can simulate the variable ability of
crop species to build high root density and N uptake capacity in deep soil layers, and do so in a very
simple way. The tests of the ability of the root model as part of the full EU-Rotate model to
simulate effects of cover crops and main crops with highly variable root growth and timing of root
growth shown in Figure 11 and 12 demonstrate that it allow the model to simulate main effects of
Conclusions
1
2
3
4
5
6
7
8
9
10
11
12
13
14
15
16
17
18
19
The root modelling approach used in the present study involved simulating the development of
rooting depth, root density distribution with depth, and plant N uptake. The model can be
parameterised to simulate observed differences in root growth among species of vegetable and
arable crops using only a few parameters, such as root system form, lag phase for germination and
root penetration rate. This model could simulate experimental data for root distribution of monocot
crops, whereas for deep-rooted dicot crops, the simulated root density in the lower part of the
rooting zone were too low compared with experimental data. However, by varying the az value, the
model was capable to predict N depletion in surface and subsoil layers reasonably well after crops
with different N demand, rooting depth and depth distribution of the root system, which is
important for simulating nitrogen use efficiency as well as nitrogen losses from agricultural and
horticultural rotations. The 2-D root model approach used made the model able to simulate soil
mineral N depletion both horizontal and vertically to comply with different row width and rooting
depths.
Acknowledgements
Root sub-module was developed in the European Community Network project: Development of a
model-based decision support system to optimise nitrogen use in horticultural crop rotations across
Europe (EU-Rotate_N) under Framework 5. For more information about the plant soil model and
access to downloads see:
http://www2.warwick.ac.uk/fac/sci/whri/research/nitrogenandenvironment/eurotaten/
20
21
22
The authors gratefully acknowledge additional funding for this work from the European
1
2
QUALITYLOWINPUTFOOD, FP6-FOOD-CT-2003-9 506358 and from the UK Department for
1 2 3 4 5 6 7 8 9 10 11 12 13 14 15 16 17 18 19 20 21 22 23 24 25 26 27 28 29 30 31 32 33 34 35 References
Abrahamsen P and Hansen S 2000 Daisy: an open soil-crop-atmosphere system model. Environ. Model. Soft. 15, 313-330.
Asseng S, Richter C and Wessolek G 1997 Modelling root growth of wheat as the linkage between crop and soil. Plant Soil 190, 267-277.
Barraclough P B 1989 Root growth, macro-nutrient uptake dynamics and soil fertility requirements of a high yielding winter oilseed rape crop. Plant Soil 119, 59-70.
Barraclough P B and Leigh R A 1984 The growth and activity of winter wheat roots in the field: The effect of sowing date and soil type on root growth of high-yielding crops. J. Agr. Sci. 103, 59-74.
Bloom A, Meyerhoff P, Taylor A and Rost T 2003 Root Development and Absorption of
Ammonium and Nitrate from the Rhizosphere. Journal of Plant Growth Regulation 21, 416-431. Brisson N, Gary C, Justes E, Roche R, Mary B, Ripoche D, Zimmer D, Sierra J, Bertuzzi P, Burger P, Bussiere F, Cabidoche Y M, Cellier P, Debaeke P, Gaudillere J P, Henault C, Maraux F, Seguin B and Sinoquet H 2003 An overview of the crop model stics. Eur. J. Agron. 18, 309-332.
Burns I G 1980 Influence of the spatial distribution of nitrate on the uptake of N by plants: A review and a model for rooting depth. J. Soil Sci. 31, 155-173.
Costigan P A 1988 The placement of starter fertilizers to improve the early growth of drilled and transplanted vegetables. Proceedings of the Fertilizer Society 274.
Delgado J A, Follett R F, Shaffer M J 2000 Simulation of nitrate-nitrogen dynamics for cropping systems with different rooting depths. Soil Sci Soc Am J 64, 1050-1054
Forde B G and Lorenzo H 2001 The nutritional control of root development. Plant Soil 232, 51-68. Gerwitz A and Page E R 1974 Empirical Mathematical-Model to Describe Plant Root Systems. J. Appl. Ecol. 11, 773-781.
Greenwood D J, Gerwitz A, Stone D A and Barnes A 1982 Root development of vegetable crops. Plant Soil 68, 75-96.
Greenwood D J, Rahn C, Draycott A, Vaidyanathan L V and Paterson C 1996 Modelling and measurement of the effects of fertilizer-N and crop residue incorporation on N-dynamics in vegetable cropping. Soil Use & Management 12, 13-24.
Greenwood D J, Rahn C, Draycott A, Vaidyanathan L V and Paterson C 2001 Modelling
N-response of field vegetable crops grown under diverse conditions with N_ABLE: A review. Journal of Plant Nutrition 24, 1799-1815.
1 2 3 4 5 6 7 8 9 10 11 12 13 14 15 16 17 18 19 20 21 22 23 24 25 26 27 28 29 30 31 32 33 34 35
Kage H, Kochler K and Stützel H 2000 Root growth of cauliflower (Brassica oleracea L. botrytis) under unstressed conditions: Measurement and modelling. Plant Soil 223, 133-147.
Kirkegaard J A and Lilley J M 2007 Root penetration rate - a benchmark to identify soil and plant limitations to rooting depth in wheat. Aust. J. Exp. Agr. 47, 590-602.
Kohl M, Büttcher U and Kage H 2007 Comparing different approaches to calculate the effects of heterogeneous root distribution on nutrient uptake: a case study on subsoil nitrate uptake by a barley root system. Plant Soil 298, 145-159.
Kristensen H L and Thorup-Kristensen K 2004 Uptake of (15)N labeled nitrate by root systems of sweet corn, carrot and white cabbage from 0.2 to 2.5 meters depth. Plant Soil 265, 93-100.
Kutschera L 1960 Wurzelatlas mitteleuräischer Ackerunkrüter und Kulturpflanzen. DLG Verlag, Frankfurt-am-Main.
Liedgens M and Richner W 2001 Minirhizotron observations of the spatial distribution of the maize root system. Agron. J. 93, 1097-1104.
Nielsen N E and Barber S A 1978 Diffferences Among Genotypes of Corn in the Kinitics of P Uptake. Agron. J. 70, 695-698.
Pages L, Vercambre G, Drouet J-L, Leccompte F, Collet C and Le Bot J 2004 Root Typ: a generic model to depict and analyse the root system architecture. Plant Soil 258, 103-119.
Penning de Vries F W T, Jansen D M, ten Berge H F M and Bakeman A 1989 Simulation of ecophsiological processes of growth in several annual crops. Pudoc: Wageningen,The Netherlands. Robinson D, Linehan D J and Gordon D C 1994 Capture of nitrate from soil by wheat in relation to root length, nitrogen inflow and availability. New Phytol. 128, 297-305.
Schmied B, Abbaspour K and Schulin R 2000 Inverse Estimation of Parameters in a Nitrogen Model Using Field Data. Soil Sci. Soc. Am. J. 64, 533-542.
Schröder J J, Groenwold J and Zaharieva T 1996 Soil mineral nitrogen availability to young maize plants as related to root length density distribution and fertilizer application method. Neth. J. Agr. Sci. 44, 209-225.
Smit A L and Groenwold J 2005 Root characteristics of selected field crops: Data from the Wageningen Rhizolab (1990-2002). Plant Soil 272, 365-384.
Smit A L and Zuin A 1996 Root growth dynamics of Brussels sprouts (Brassica olearacea var.
gemmifera) and leeks (Allium porrum L.) as reflected by root length, root colour and UV fluorescence. Plant Soil 185, 271-280.
Thorup-Kristensen K 2006a Root growth and nitrogen uptake of carrot, early cabbage, onion and lettuce following a range of green manures. Soil Use Manag. 22, 29-39.
1 2 3 4 5 6 7 8 9 10 11 12 13 14 15 16 17
Thorup-Kristensen K 2001 Are differences in root growth of nitrogen catch crops important for their ability to reduce soil nitrate-N content, and how can this be measured? Plant Soil 230, 185-195.
Thorup-Kristensen K 2006b Effect of deep and shallow root systems on the dynamics of soil inorganic N during 3-year crop rotations. Plant Soil 288, 233-248.
Thorup-Kristensen, K., Salmeron, M. and Loges, R. (2009) Winter wheat roots grow twice as deep as spring wheat roots, is this important for N uptake and N leaching loss? Plant and Soil (DOI: 10.1007/s11104-009-9898-z)
Thorup-Kristensen K and van den Boogaard R 1998 Temporal and spatial root development of cauliflower (Brassica oleracea L. var. botrytis L.). Plant Soil 201, 37-47.
Thorup-Kristensen K and van den Boogaard R 1999 Vertical and horizontal development of the root system of carrots following green manure. Plant Soil 212, 143-151.
Xue Q, Zhu Z, Musick J T, Stewart B A and Dusek D A 2003 Root growth and water uptake in winter wheat under deficit irrigation. Plant Soil 257, 151-161.
1
2 Table 1. List of abbreviations, initial value if needed, units and explanation
Name Default value Unit Explanation
Model parameters
az [0,1..8] - Form parameter, vertically
ax [0,1..8] - Form parameter, horizontally
c - [kg N m-3] Nitrate or ammonium content in soil unit
cmin 0.001 / 0.002 [kg N m-3] Minimum nitrate / ammonium concentration allowing N
uptake from a soil unit
kf 1.45 - Parameter reducing root N uptake at low N concentrations
kN 0.07 - Root N uptake efficiency parameter
krz - [m day-1 °C-1] Vertical root penetration rate parameter
krx - [m day-1 °C-1] Horizontal root penetration rate parameter
q 1.3 - Absolute rooting depth relative to simulated rooting depth
Rx - [m] Root system width
Rz - [m] Vertical root depth
Rz-max - [m] Maximum rooting depth
Rz-min 0.10 [m] Rooting depth at sowing or planting
Sr 300000 [m g-1] Specific root density
Tmin 0 [°C] Minimum temperature for root growth (crop dependant)
Tmax Tmin+20 [°C] Maximum temperature for root growth
DD - - Day-degrees
DDlag - [DD] Lag phase for initiating root growth
T - [°C] Temperature
Tlag - [DD] Lag phase for initiating root growth
L0 - [m m-3] Root density at surface
Lr - [m m-2] Total root length
Lz - [m m-3] Root density at soil depth z
Ndemand - [kg N ha-1 d-1] Nitrogen demand calculated
Npot(i,j) - [kg N] Potential nitrate or ammonium N uptake for each soil unit
(i,j), where i denotes depth and j denotes width
Npot - [kg N ha-1] Potential daily N uptake from the whole root zone
Nup - [kg N ha-1] Actual nitrate and ammonium plant uptake
Wr - [g m-2] Root biomass
z - [m] Soil depth
[image:31.595.44.519.105.510.2]1 2
Table 2. Relative plant N uptake in the 1.0-1.25 m soil layer. Simulation with the default model settings and simulation
for testing model sensitivity for root penetration rate, specific root length and root extension.
Default parameters Model parameter sensitivity Plant N uptake, relative
to az=0 *
Plant N uptake, relative to default krz, sr or q with az=0 to 8 **
Form
parameter az krz90% Sr90% q=1
0 1.0 0.98 1.00 0.94
0.5 0.99 0.96 0.99 0.91
1 0.96 0.93 0.98 0.87
2 0.80 0.86 0.96 0.78
3 0.52 0.81 0.93 0.71
5 0.12 0.77 0.90 0.67
8 0.01 0.76 0.89 0.68
3 4 5 6
*
: derived as plant N uptake with az=0,..8 / plant N uptake with az=0
**
: derived as plant N uptake with krz90% / plant N uptake at krz, for each az=0…8 (column 2) and similar for Sr90% and
q=1.
1
-2 -1.8 -1.6 -1.4 -1.2 -1 -0.8 -0.6 -0.4 -0.2 0
0 0.1 0.2 0.3 0.4 0.5 0.6 0.7 0.8 0.9 1 1.1
Relative Root Density
D
ept
h (
m
)
Form factor:
az =0 az =1 az =3 az =8
2
[image:33.595.67.519.137.380.2]3 4
Figure 1. Relative modelled root density distribution in soil profile after 110 days with different values of az. Total root
Days after planting
0 20 40 60 80 100 120
Soil N c
o
ntent - r
e
lativ
e
to s
tart
0.2 0.4 0.6 0.8 1.0
az = 0 az = 1 az = 3 az = 8
1
[image:34.595.72.477.120.365.2]2 3 4
Figure 2. Relative soil mineral N content in the 0-2.0 m soil layer compared with initial soil mineral N content for form
parameter az=0, 1, 3 and 8 for default root model simulation in a situation where soil mineral N level was below
Soil N
content - r
e
lativ
e
to s
tart
0.0 0.2 0.4 0.6 0.8 1.0
Days after planting
0 20 40 60 80 100 120
0.2 0.4 0.6 0.8 1.0
az = 0 az = 1 az = 3 az = 8
Mineral N in 0.25 - 0.5 m layer Mineral N in 1.0 - 1.25 m layer
Mineral N in 0.25 - 0.5 m layer Mineral N in 1.0 - 1.25 m layer
a)
b)
1
[image:35.595.62.471.120.550.2]2 3 4
Figure 3. Soil mineral N content in two soil layers, relative to initial start content for default root model for form
parameter az=0, 1, 3 and 8 in 0.25-0.50 m and 1.00-1.25 m soil layers. a) Low N conditions, below potential uptake for
0.6 0.7 0.8 0.9 1.0 1.1
az = 1 az = 3 az = 8
Days after planting
0 20 40 60 80 100 120
0.6 0.7 0.8 0.9 1.0 1.1
R
e
la
tiv
e
plant N upta
k
e
0.6 0.7 0.8 0.9 1.0 1.1
a) krz
b) Sr
c) q
1
[image:36.595.62.372.107.579.2]2 3 4 5
Figure 4. Sensitivity of plant N uptake to three main parameters. Heavy lines show uptake using form parameter az=1,
3 and 8 relative to uptake with az=0. Thin lines show same simulations but with altered parameter values: a) root
penetration rate (krz) reduced to 90% of default setting, b) specific root length (Sr) reduced to 90% of default setting, and
0.4 0.2 0.0 0.2 0.4 0.4 0.2 0.0 0.2 0.4
1e+2 1e+3 1e+4 5e+4 1e+5 Root density
(m m-3)
Form factors (3;0)
Distance from row centre (m) 0.4 0.2 0.0 0.2 0.4
D
e
pth (
m
)
-1.8 -1.4 -1.0 -0.6 -0.2
Form factors (3;3) Form factors (3;8)
0.4 0.2 0.0 0.2 0.4 0.4 0.2 0.0 0.2 0.4
1e+2 1e+3 1e+4 5e+4 1e+5 Root density
(m m-3)
1e+2 1e+2 1e+3 1e+3 1e+4 1e+4 5e+4 5e+4 1e+5 1e+5 Root density
(m m-3)
Form factors (3;0)
Distance from row centre (m) 0.4 0.2 0.0 0.2 0.4
D
e
pth (
m
)
-1.8 -1.4 -1.0 -0.6 -0.2
Form factors (3;3) Form factors (3;8)
1
[image:37.595.56.480.84.393.2]2 3
Figure 5. Root density in the soil profile in a 2-D system. Three different form parameter settings were used in 2-D:
0
20
40
60
80
100
Days from planting
Soil min
er
al N
–
rel
ativ
e
to
s
tar
t
120
1
0.8
0.6
0.4
0.2
0
Row distance 0.1 m 0.5 m 1.0 m
0
20
40
60
80
100
Days from planting
Soil min
er
al N
–
rel
ativ
e
to
s
tar
t
120
1
0.8
0.6
0.4
0.2
0
Row distance 0.1 m 0.5 m 1.0 m
1
[image:38.595.60.537.134.395.2]2 3 4
Figure 6.Soil mineral N content relative to initial value for the default root model simulated in a system with low
mineral N content. Relative soil mineral N content in 0.25-0.50 m soil layer with three different row widths, 0.1, 0.5,
0.0 0.2 0.4 0.6 0.8 1.0
Fraction of roots in soil layers 0.0 0.2 0.4 0.6 0.8
D
epth (m)
0.00
0.25
0.50
0.75
1.00
1.25
1.50
1.75
2.00
az=0 az=1.5 az=3 az=8 Field data
0.0 0.2 0.4 0.6 0.8
a) b) c)
1
2 3 4 5 6
7
8
[image:39.595.65.482.115.383.2]9
Figure 7. Comparison of measured and simulated root density distribution of a white cabbage crop. The simulated data
were obtained using az values ranging from 0 to 8. Field root data are the average from 10 different N fertility
treatments obtained by variable N rates for white cabbage and a cauliflower pre-crop, and measured a) 46, b) 64, and c)
153 days after planting of white cabbage. Values are shown relative to the total root count at harvest, and error bars
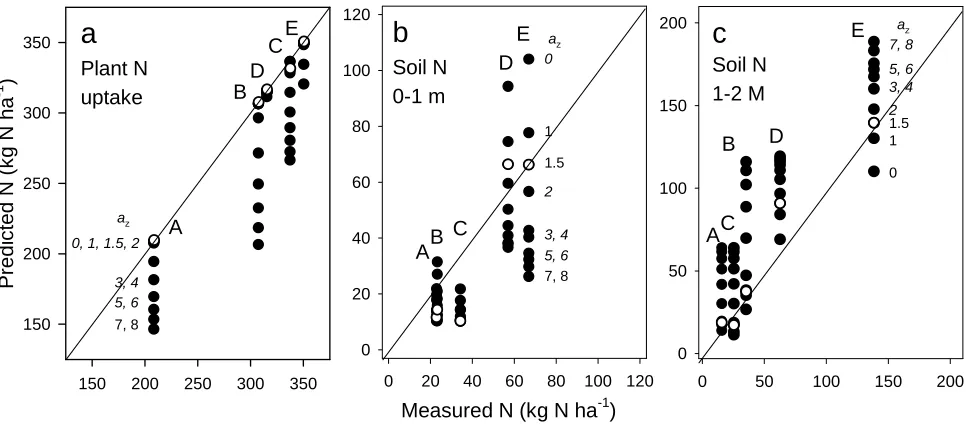
150 200 250 300 350 P redi ct ed N ( k
g N ha
-1 ) 150 200 250 300 350 A B C D E
a
Plant N uptakeMeasured N (kg N ha-1)
0 20 40 60 80 100 120
0 20 40 60 80 100 120
b
Soil N 0-1 mAB C D
E az 0
0 50 100 150 200
0 50 100 150 200
c
Soil N 1-2 M A B C DE az
7, 8 2 5, 6 3, 4 1 1.5 0 2 5, 6 3, 4 1 1.5 7, 8 az 5, 6 3, 4 7, 8
0, 1, 1.5, 2
[image:40.595.72.555.121.335.2]1 2 3 4 5 6 7
Figure 8. Comparisons of measured and model simulated N results from white cabbage grown at five N fertilizer
levels, and using different values of the form parameter az. a) Plant N uptake, b) soil mineral N in the 0-1.0m soil layer,
and c) soil mineral N in the 1.0-2.0 m soil layer. Data for each of the five fertiliser levels is shown (A to E, for fertiliser
levels see Materials and Methods). All fertilizer levels were simulated using az=0 to 8 (Open symbols show az=1.5,
1
Root form paramter (az )
0 1 2 3 4 5 6 7 8
RM
SE
of
N cont
ent
in soil
lay
e
r
0 10 20 30 40 50 60
Cabbage 0-1 m Cabbage 1-2 m Red beet 0-1 m Red beet 1-2 m Leek 0-1 m Leek 1-2 m
2
[image:41.595.62.527.163.350.2]3 4 5
Figure 9. RMSE of model predicted soil mineral N contents in the 0.0-1.0 and 1.0-2.0 m soil layers vs. measured
results from experiments where variation in depth distribution of soil N had been created by pre-crops or cover crops
1
Fraction of roots in soil layers
0.0 0.2 0.4 0.6 0.8 1.0
D
e
pth (
m
)
0.00
0.25
0.50
0.75
1.00
1.25
1.50
1.75
2.00
Leek simulated Red beet Cabbage Leek measured Red beet Cabbage
2
[image:42.595.61.296.131.423.2]3 4 5 6
Figure 10. Comparison of simulated (lines) and measured root intensity (symbols) for three vegetable crops. Root
intensities in the field were measured on 5 September 2001 and 9 September 2002 as root intersections on grids in
minirhizotrons. Field data are an average of 2 years and 2 replicates. All data are shown as fraction of total root density