Exploring patent-based indicators, firm performance and product introductions: the case of
ASML and its industry peers
Robin Meyer
∗ ∗MSc. Business Administration Student, University of Twente, Enschede, The Netherlands
Supervisors: E. Hofman
a, M. de Visser
b, A. Kovács
c aFirst supervisor, University of Twente, Department of Technology Management & Supply, Enschede, The Netherlands
bSecond supervisor, University of Twente, Department of Technology Management & Supply, Enschede, The Netherlands cExternal supervisor, KU Leuven, Department of Managerial Economics, Strategy and Innovation, Leuven, Belgium
T H E S I S I N F O
Version: final Student no.: s1832328
No. words: 8,158 (excl., references, appendices etc.) September 2018
Keywords: Patent-based indicators Firm performance Product introductions
Product life cycle/technology life cycle
Lithography industry;
ASML, Nikon, Canon, Ultratech
A B S T R A C T
It is widely recognized that innovation is increasingly important to firms since marketplaces are becoming more and more dynamic. Firms need to innovate to respond to changes in the demands of customers so that they may capitalize on opportunities regarding changing marketplaces, structures, dynamics and technology. Business executives, policymakers, scholars and public administrators continue to advocate that innovation is essential for economic growth, competitive advantage, industrial and technological change. As a result, patents play an increasingly important role in innovation and economic performance and product introductions. An especially interesting example industry in which continuous innovation important is the semiconductor industry and interesting company that has made some remarkable progress in innovation and (economic) growth is ASML. For this reason, the focus of this research is to examine the differences between ASML and its peers based on measures using patent-based indicators, firm performance indicators and product introductions. It aims to find the underlying reason why ASML has made such significant process by looking at patent-based indicators, firm performance indicators and product introductions. This thesis concludes, in general, that ASML often (on average) performs better than its peers when looking at these firm performance indicators. When we look around the time of the product introductions and between the introductions we mainly notice patterns from the product life cycle theory and the technological life cycle theory, such as, s-curved patters and rapid penetration patterns. In general, ASML and Nikon seem to have fewer but larger cycle patterns whereas Canon and Ultratech have multiple (somewhat) smaller cycles. When considering ASML as an innovator, we could state that Teece's (1986) does not hold for ASML and its peers because ASML seems to perform well based on firm performance indicators (on average often better than its peers) and perform well based on patent analysis.
1. Introduction
Already as early as 1950, Schumpeter asserted that firms should innovate to renew and extend the value of their asset funds (Rowley, Baregheh, & Sambrook, 2011).
According to Schumpeter (1934), “carrying out innovations is the only function which is fundamental in history”. Since Schumpeter’s theory of economic development, innovation has been regarded as one of the main components of firm performance and economic growth (Arts, Appio, & Van Looy, 2013).
It is widely recognized that innovation is increasingly important to firms since marketplaces are becoming more and more dynamic. Firms need to innovate to respond to changes in the demands of customers so that they may capitalize on opportunities regarding changing marketplaces, structures, dynamics and technology (Rowley et al., 2011).
Business executives, policymakers, scholars and public administrators continue to advocate that innovation is essential for economic growth, competitive advantage, industrial and technological change (Damanpour, Walker, & Avellaneda, 2009).
A fundamental concept in the literature of innovation is that of “type of innovation” proposed by Henderson and Clark (1990). According to Henderson and Clark (1990), there are four types of innovation, namely, incremental, modular, architectural and radical innovation. This research will focus on one of those four types, namely, radical innovation.
While innovation can be defined as improving, upgrading, enhancing or making a notable contribution to an existing product, process or service, inventions, in its purest form, can be defined as the creation of something, a product or introduction of a process, for the first time. Thus, before
University of Twente
innovation can happen, inventions need to be made. As a result, patents play an increasingly important role in innovation and economic performance (OECD, 2004). According to the OECD, the number of patent applications filed in Europe, Japan and the United States has increased by more than 40% (OECD, 2004). Patents represent an invention in a specific area of technology and beside that a substantial part of the information presented in patents is relatively new. Thus, patent research and analysis has become vital for both companies, regarding legal and managerial aspects, and scholars. (Abbas, Zhang, & Khan, 2014).
Verhoeven, Bakker and Veugelers (2013) propose three patent-based measures, reflecting three distinct technological dimensions of radical innovation or also called dimension of novelty. The three patent-based measures are New Origins, New Functionality and New Impact.
Hall, Jaffe and Trajtenberg (2001) propose to use the patent-based indicators “originality” and “generality” as well as forward citations itself, all measures regarding breadth and depth of patents.
Referring back to the beginning of this section, an especially interesting example industry in which continuous innovation important is the semiconductor industry. According to a Mckinsey’s (2013) article the semiconductor industry has recorded impressive achievements since 1965. This is when Intel cofounder Gordon Moore published the observation that would become the industry’s standard called Moore’s law. (McKinsey, 2013)
Moore's law states that every two years the number of transistors on integrated circuits doubles. This has set the pace for the past five decades for (innovation) progress in the industry. This constant scaling down that the law predicts has resulted in positive side effects such as cost reductions, less power consumption, and more compactness of the chips (see table 1) resulting in the important role that semiconductor-enabled products play in nearly all aspects of (modern) life. (Peper, 2017; SEMI, 2015; McKinsey, 2013)
Table 1 - Progression of the semiconductor industry (adapted from infographic, figure 3 in appendix)
1971 2015
Price per chip $351 $393
Price per 1,000 transistors $150 $0.0003
Number of transistors per chip 2,300 1,300,000,000
Minimum feature size on chip 10,000nm 14nm
1.1. Problem description and case choice
As we have seen in the previous part of this introduction innovation is increasingly important and regarded as one of the main components of firm performance and economic growth and additionally that patents and patent analysis play a critical role for companies. We have also seen the importance in the semiconductor industry.
An interesting company that has made some remarkable progress in innovation and (economic) growth is ASML.
Their market share (in terms of unit sales) went from around 10% in the early 90s to a little bit under 60% in 2016 making ASML the market leader (see figure 1).
When we look at figure 1 we can clearly see that ASML has made some remarkable growth since the beginning, whereas Nikon has declined from around 60% to around 15% in 2016. Looking at Canon we can see that Canon has mostly stayed between the 10 and 30%, however they have managed to increased their market share significantly after a massive dip around the financial crisis.
When we look at market share in terms of revenue, ASML has a dominance over the semiconductor lithography market with 85.4% market share compared with Nikon 10.3% and Canon with 4.3% (Clarke, 2018). Therefore, we can clearly see that ASML managed to keep growing since the early 90’s and had an increasing trendline growing into being #451 on the Forbes global2000 list which lists the world's largest public companies (Forbes, 2018).
According to Teece (1986) innovators (firms that first commercialize a new product or process) are often outperformed by competitors/imitators who profited more than the firm that first commercialized it. The Thomson Reuters top 100 Global Innovators list of 2011 recognizes ASML as one of the Top 100 global innovators in all industries in innovation and economic growth in 2011 (ASML, 2012). Considering that and the growth ASML has made, as previously described, we might consider ASML as an innovator that has been able to perform well. For this reason, we are going to look at the lithography industry and see if Teece's (1986) theory also seem to hold for ASML and its peers.
Taking everything that has been previously stated into consideration, it will be especially interesting to research how ASML differs in the way they operate (firm performance and product introductions) and handle their patents (patent-based indicators) compared to their industry peers. This can be especially interesting with a two by two design, two companies performing relatively well (ASML and Canon) and two companies that did not perform that well (Nikon and Ultratech).
1.2. Research goal and research questions
The focus of this research is to examine the differences between ASML and its peers based on measures using patent-based indicators, firm performance indicators and product introductions. For the patent-based indicators, this research
will build upon the work of Verhoeven, Bakker and Veugelers (2013) and Hall, Jaffe and Trajtenberg (2001). The goal of this research is to explore patent strategy, firm performance and product introductions with ASML and its industry peers.
The following central research question has been formulated in order to carry out the master thesis:
CQ: “How does ASML differ from their industry peers when
looking at firm performance indicators, patent-based indicators and product introductions?”
Furthermore, this question is divided into the following sub-questions:
SQ1: “How does ASML differ from its industry peers based
on firm performance indicators?
In the introduction we have seen that ASML has made some remarkable growth in terms of unit market share but also market share based on revenue. With this question we are going to look at how ASML is performing compared to its peers and if ASML is, in fact, performing better than its peers.
SQ2a: “When looking at the mapped patent-based indicators
and product introductions, what patterns can be seen?”
SQ2b “When looking at the mapped patent-based indicators
and product introductions, how do ASML’s patterns differ from its peers?”
With these two questions we are going to look at the patterns that (might) emerge when we map the patent-based indicators together with the product introductions. We are going to look at what happens with the indicators around the time of the product introductions and compare this with the other companies.
1.3. Thesis structure
This thesis is organized as follows. We begin with an examination the performance of the firms and how ASML differs from its peers. Next, we look at the mapped patent-based indicators and product introductions. Finally, we discuss and conclude the results and main finding, important limitations and opportunities for future research.
2. Theoretical background
2.1. Firm performance
According to Neely, Gregory and Platts (1995) the level of performance a firm obtains is a function of the efficiency and effectiveness of the actions a firm undertakes. Hence, performance measurement can be defined as the process of measuring the efficiency and effectiveness of the firm’s actions (Neely, Gregory, & Platts, 1995).
The measurement of firm performance measurement is critical for effectively managing a firm because process improvement is not possible without measuring outcomes. A firm's success can be explained as its performance over a certain period of time. Determining measures for the concept of performance is a crucial notion and researchers make extended efforts to do so because finding measurements for the performance of firms enables comparison of performances over a certain period of time. Yet, no firm
performance measurement with the ability to measure every performance aspect has been proposed to date. (Al-Matari, Al-Swidi, & Fadzil, 2014)
The literature of firm performance reveals that different measures have been used by the researchers to measure the performance. For instance, Return on Assets (ROA) and Q ratio are prevalent in firm performance studies as they are used as common firm performance proxies in regression analysis (Frijns, Dodd, & Cimerova, 2016; Morgan, Vorhies, & Mason, 2009; Peni, 2014; Lu & Shang, 2017). Whereas, for instance, Return on Equity (ROE), Return on Sales (ROS), Market-to-Book Value and Return on Investment (ROI) is prevalent in other studies (Morgan, Vorhies, & Mason, 2009; Calantone, Vickery, & Dröge, 1995)
According to Venkatraman & Ramanujam, (1996), these firm performance measurements can be classified into either accounting-based and market-based measurements. The first type of measurements are accounting-based measurements, commonly considered as an effective indicator of the company’s profitability and its business efficiency and effectiveness (Venkatraman & Ramanujam, 1996; Al-Matari, Al-Swidi, & Fadzil, 2014). The accounting-based measures can be characterised as short-term oriented measures. Such measures are, for example:
- sales growth;
- profitability - reflected by ratios such as Return On Investment (ROI), Return On Assets (ROA), Return On Sales (ROS), Return On Equity (ROE);
- Earnings Per Share (EPS), and so forth. (Venkatraman & Ramanujam, 1996; Al-Matari, Al-Swidi, & Fadzil, 2014) According to Venkatraman & Ramanujam (1996), the second type of measurements are market-based (also called value-based) measurements and can be characterised as long-term oriented measures due to its forward-looking characteristics and also its indication of shareholder expectations regarding the firm’s future performance (Venkatraman & Ramanujam, 1996; Al-Matari, Al-Swidi, & Fadzil, 2014). Such measures are, for example:
- Tobin’s Q (traditional measure of expected long-run firm performance);
- Market-to-Book Value (MTBV); - Stock-market returns;
- Dividend Yield (DY); - Price-Earnings Ratio (PE)
- Log of Market Capitalization and so forth. (Venkatraman & Ramanujam, 1996; Al-Matari, Al-Swidi, & Fadzil, 2014)
2.2. Patent
The United States Patent and Trademark Office (USPTO) defines a patent as a property right granted to the invented by the Government of the United States (USPTO, 2015). According to the USPTO, the grant itself gives the right "to exclude others from making, using, offering for sale, or selling the invention throughout the United States or importing the invention into the United States" (USPTO, 2015). The USPTO distinguishes three types of patens, firstly, utility patents which are “granted to anyone who invents or discovers any new and useful process, machine, article of manufacture, or composition of matter, or any new and useful improvement thereof” (USPTO, 2015). Secondly, design patents which are “granted to anyone who invents a new, original, and ornamental design for an article of manufacture” (USPTO, 2015). Lastly, plant patents which are “granted to anyone who invents or discovers and asexually reproduces any distinct and new variety of plant” (USPTO, 2015).
2.3. Structure of patent documents
Regarding the structure of patents, the World Intellectual Property Organization (WIPO) has created a patent drafting manual in which they state that a patent typically consists out of six parts. These six parts are 1) claims, 2) a detailed description (or specification), 3) drawings, 4) background, 5) abstract and 6) summary. The claim section describes what is claimed to be protected from the inventor. The detailed description gives life to the claims and presents a detailed explanation of the invention for, as the WIPO puts it, “an ordinary person skilled in the art to make and understand the invention”. The drawings section contains visual supporting materials that describe the invention, argued by many patent agents as the most important part of the patent after claims (WIPO, n.d.). The section of the background is commonly used to disclose prior patents submitted by the patent applicant. The abstract of the patents describes the invention in the least possible words and as clearly as possible. Lastly, the summary of the invention is not always required by all jurisdictions, however, such a section is generally prepared as well. (WIPO, n.d.)
2.4. Patent analysis
Nowadays there are various tools available that are used for analysing patents. These tools can perform different tasks such as trend analysis, technological forecasting, strategic technology planning, infringement analysis, novelty detection, technological roadmapping, competitor analysis and identifying patent quality (Abbas, Zhang, & Khan, 2014).
Abbas et al. (2014) performed a literature review focusing on the patent analysis. Their literature review presents, as they call it, the state-of-the-art in patent analysis, and also introduces a taxonomy of patent analysis techniques. As previously mentioned patents contain various types of content, however, these types of content can be classified as structured and unstructured data. The unstructured patent data comprises narrative text including the patent title, abstract, claims, and description. The structured patent data
contains information, such as the inventor of the patent, assignee of the patent, and citation information.
According to Abbas et al. (2014) patent analysis techniques can be classified as either text mining techniques or visualization-based techniques for analysing the patent content. Text mining techniques are used to extract the information from structured and or unstructured text. The visualization techniques are meant to assist the decision makers or technology experts in representing the patent information visually to analyse the results.
Patent analysis brings certain challenges, for instance, associated with the proficiency, expertise and experience of the patent researcher, or challenges concerning the information presented in patents and patent databases. Patent analysist with less expertise and experience require patent analysis tools with versatile capabilities. Moreover, issues related to patent information such as difficulties in searching and retrieving correct patent information can also be complex and are crucial for patent analysts. Fortunately, various software and (text mining) tools support the researcher regarding this aspect. (Abbas, Zhang, & Khan, 2014)
Various (text mining) tools and software that are able to both mine structured and unstructured date have been developed. However, text mining a patent’s structured information is comparatively easier as mining unstructured patent data. (Abbas, Zhang, & Khan, 2014)
2.5. Patent based measures
The focus of this thesis, with regards to patents, will be on the patent based measures proposed by Verhoeven, Bakker and Veugelers (2013) and Hall, Jaffe and Trajtenberg (2001). This is due to the aforementioned expertise required for most patent analysis but also due to the time constraint of a master thesis.
Verhoeven, Bakker and Veugelers (2013) propose three patent-based measures, reflecting three distinct technological dimensions of radical innovation or also called dimension of novelty. The three patent-based measures are New Origins, New Functionality and New Impact.
New Functionality regards the extent to which an invention provides substantially new functional capacities. This indicator counts the number of new pairwise combinations of technological classes a patent is assigned to.
New Origins reflects the extent to which an invention builds on different technological knowledge and principles compared to common practice. The indicator measures the number of new technological class pairs created through the backward citations of a patent.
New impact regards to inventions that relate for the first time two previously disconnected technological fields. The indicator counts the number of new combinations of technology classes created by citations from other patents to the focal patent. New impact regards to inventions that relate for the first time two previously disconnected technological fields. The indicator counts the number of new combinations of technology classes created by citations from other patents to the focal patent.
as forward citations itself, all measures regarding breadth and depth of patents.
Measure of "Generality" if a patent is cited by subsequent patents that belong to a wide range of fields the measure will be high, whereas if most of the citations are concentrated in a just few fields it will be low. If we think of forward citations as an indication of the impact of a patent, a high generality score suggests that the patent seemingly had a widespread impact, in that it influenced subsequent innovations in a variety of fields.
Measure of "originality", is defined in the same way as the generality measure, except that it refers to citations the patent makes instead of the patent being cited by subsequent patents. Hence, if a patent cites previous patents that belong to a narrow set of technologies the originality score will be low, whereas citing patents in a wide range of fields would render a high score.
Regarding forward citations, if a patent has received 10 or 100 citations does not tell much whether that patent is “highly” cited. Therefore, intrinsically, information on patent citations is meaningful only when used comparatively.
2.6. Product life-cycle
By the end of the 1950s the Product Life Cycle (PLC) theory was emerging and most of the concepts adoption success might have been due to some high-profile publications in its early years (Cao & Folan, 2012). One these higher profiled publications was Levitt (1965) in his Harvard Business Review that revisited and made known the product life cycle (Levitt, 1965).
As can be seen in figure 2above,the product life cycle represents the sales volume curve for a product over time resulting in an approximately bell-shaped curve that is divided into several stages. The four stages are market development (sometimes also called introduction) growth, maturity, and decline. Levitt (1965), explains that the first stage, market development, is when a new product is first introduced to a market before a proven demand and usually before it has been proven technically in all respects. This stage is characterized by slowly moving sales. In the second stage, growth stage, the demand starts to speed up and the total market size expands quickly. In the third stage, maturity stage, the demand starts to settle and in the fourth and last stage, decline stage, the product starts to lose customer appeal and sales goes down.(Levitt, 1965)
In his paper, Levitt (1965) also suggest that already preparing and planning for life-extending efforts during the pre-introduction stage could be especially important to extend a product’s life cycle, see figure 3.
According to Rink and Swan (1979), product life cycle literature review, the traditional Product Life Cycle bell-shape is only one of the 12 types of product life cycle patterns discovered by researchers. See figure 10 in the appendix for the other types of patterns.
An alternative to the product life cycle is the Technology life cycle which will be briefly explained. According to Shahmarichatghieh, Tolonen, and Haapasalo (2015),the stages of the Technological life cycle are the same as the product life cycle. Additionally, time is also on the x axis but a patent index is placed on the y axis. Furthermore, the patent based Technological life cycle has S-shaped curve. See figure 27 and 28 in the appendix.
Considering the previously mentioned points, we would expect to see approximately s-shaped curves around and between product introductions as in the product life cycle ant technological life cycle theory ormaybe similar shape as in figure 3 life cycle with subsequent extensions.
2.7. Dominant design
A dominant design concerns the emergence of a dominant technology in an industry. A technology becomes dominant through a complex process in which several alternative technologies are competing until a competing alternative technology are de-selected until a favoured technological "hierarch" becomes apparent. (Suarez, 2004)
Suarez (2004) proposes a framework for understanding the dominant design process, a process in which a technology achieves dominance when competing against other alternative technologies.
The dominant process consists out of five phases, according to Suarez (2004). Phase 1, R&D build-up phase, typically in this phase a mix of large firms with expertise in a related technology, a set of new firm entrants, and groups doing applied research in universities or similar institutions are included in a technological field. In this phase, the Figure 2 - Product life cycle, adapted from (Levitt, 1965)
emphasis is on technology and technological talent Suarez (2004).
Phase 2, technical feasibility phase, demonstrating technical feasibility (by presenting a working prototype) forces the other all firms to assess their research programs and to evaluate if they will be in the position to compete in the upcoming dominant design battle Suarez (2004).
Phase 3, creating the market phase, the launch of the first commercial product marks a change of importance from technology to market factors, making any technological differences between the alternatives become increasingly less important as time goes by. In Phase III, several competitors start to gain a sizable installed base of users.
Phase 4, the decisive battle phase, the increasingly large customer bases start to have an important effect on the choses of the customers and there is fierce competition for enlarging customer bases.
Phase 5, post-dominance phase, in this post-dominance phase a clear dominant technology has emerged in the market and its large “locked in” customer base functions as a defence against potential challengers, especially in industries with high switching costs.
Considering the fact that during phase 1 “characteristics of the technological field” and during phase 2 technological superiority are important and the points mentioned above, we would expect that after the initial phase of introduction technological performance would start to increase. Nearing the end, we would expect to see a decrease in technological performance since in phase 3, 4 and 5 factors such as strategic manoeuvring, credibility and installed (customer) base and switching costs become more important.
3. Methodology
3.1. Research design
The focus of this research is on exploring patent-based indicators, firm performance and product introductions with ASML and its peers. Hence, exploratory research seems to be the most appropriate for the purpose of answering the central research question. This is because the goal of exploratory research is to gather preliminary information that will help define problems and suggest hypotheses or as Stebbins (2001) states it aims to generate new ideas and weave them together to form grounded theory, or theory that emerges directly from data. (Stebbins, 2001)
Case study research is considered a flexible research design and can be done using qualitative and/or quantitative methods and evidence (Yin, 1981; Yin, 1994). As Yin (1981) states in the evidence from case studies may from archival records, observations, verbal reports, fieldwork or any combination of these.
According to Yin (1981) a case study research attempts to examine a “contemporary phenomenon in its real-life context, especially when the boundaries between phenomenon and context are not clearly evident. Moreover, case studies can be either exploratory, descriptive, or explanatory and they best address how and why research questions leading to extensive understanding of the topic.
Considering the previously mentioned points an exploratory case study is considered to be due to its focus on generating new ideas, theory building, its flexible research design (qualitative and/or quantitative) and the type of questions it best addresses. More specifically, this research will be an (exploratory) single embedded in-depth case study with a 2 by 2 design, focussed on document analysis. (Yin, 1994)
3.2. Research process
Figure 4 shows the process (workflow) of the patent analysis, firm performance analysis and mapping of patent-based indicators, firm performance indicators and product introductions.
Figure 4 - Research process - patent analysis, firm performance analysis and mapping workflow
As can be seen in figure 4 above, the first step was to collect all subsidiaries from all four companies (ASML, Canon, Nikon and Ultratech). This was done by diving into the annual reports from all companies and collecting all subsidiaries listed per year (2002-2017) (the years annual reports were available) and making a database out of all the subsidiaries per company per year. After that the database was cleaned of all the double or multiple entries. The reason for collecting all subsidiaries in each year is to also intercept all name changes, liquidations, acquisitions and starting-ups of new subsidiaries under which patents might be registered. After that the list with unique subsidiaries was send to Mr. Kovács who then run an algorithm which matched the list of subsidiaries with company names in the patent system under which patents are listed. The output of this was a list which contained all the matches with a score (indicated how well it matched). All matches with a jaro-score of 100 were perfect matches and did not need checking but all matches with a jaro-score between 90 and 100 needed to be manually checked (8000 results). Resulting in a list with all “good matches” and their person ID’s. This list with the person ID’s was again send to Mr. Kovács who used it to run a query to
Collect subsidiaries from annual reports
Subsidiaries matched with names in patent system (algorithm)
Output list of matches partially manually
checked
Prepared data for patent analysis Multivariate analysis in
SPSS for patent analysis Started to collect firm
performance data (from Orbis)
Prepared data for firm performance analysis
Multivariate analysis in SPSS for firm performance analysis Started mapping patent-based indicator and product introductions Combining patent-based indicators for
legibility and understandability. Results, discussion and
retrieve all the necessary patent data (patent-based indicators). Next, the patent data needed to be prepared for analysis and then a multivariate analysis was run in SPSS for the patent analysis.
Next the firm performance data was collected from Orbis (this due to the fact that the companies all use different ways of reporting in their annual reports which has been unified in Orbis) and prepared for analysis. A multivariate analysis was performed in SPSS for firm performance analysis.
Next, started mapping patent-based indicator and product introductions, and product introductions were mapped together. However, during this mapping we could notice that there were too many variables with different scales as well which came up with cluttered graphs.
Therefore, the next step was combining the patent-based indicators in order to create more legibility and understandability and also to be able to examine and conclude from these graphs.
3.3. Measurement
In the tables below, we can see the variables and their measurement used in the analyses. Table 2 shows the overview of the variables used in the firm performance analysis and table 3 shows the overview of the variables used in the combined indicators patent analysis. See appendix table 7 for an explanation (variables and measurement) of the original variables used in the analysis. In table 3 we can see that the combined variables are called Novelty1 and Novelty2. These are based on the IPC4 variant of the variables, though the analysis will also be performed for IPC6 as a check. This will be further explained in the analyses and results part. IPC stands for International Patent Classification (IPC) which is a patent classification system which shows under what kind of (technology) class a patent falls. IPC6 is (just) a more detailed version of classification as IPC4.
3.3.1. Firm performance
Table 2 - Overview variables used in firm performance analysis
Variable Measurement
Part 1
Return On Assets Net income divided by total assets
Return On Equity Net income divided by shareholder’s equity
(net) Profit Margin% Net profit margin is the percentage left after all expenses have been deducted from revenue.
Gross Margin% Gross margin is the difference between revenue and cost of goods sold (COGS) divided by revenue and
multiplied by 100.
Earnings Per Share Net income divided by total shares
Part 2
Tobin’s Q Market capitalization of the firm divided by book value of total assets
Earnings Per Share Net income divided by total shares
3.3.2. Patent analysis
Table 3 - Overview variables used in patent analysis
Variable Measurement
NB_CITING_DOCDB_FAM Number of forward citations related to the patient’s family.
Novelty1 A measure based on both “GENERAL_IPC4” and “ORIGINAL_IPC4” variables that incorporates
both scores using averages per year. See table 7 in appendix for explanation on the variables “GENERAL_IPC4” and “ORIGINAL_IPC4”.
Novelty2 A measure based on both “GENERAL_IPC4” and “ORIGINAL_IPC4” variables that incorporates
both scores using averages per year. See table 7 in appendix for explanation on the variables “GENERAL_IPC4” and “ORIGINAL_IPC4”.
4. Analyses and results
First, we will start with the firm performance analysis. As discussed before, in the introduction we have seen that ASML has made some remarkable growth in terms of unit market share but also market share based on revenue. With the firm performance analysis, we are going to look at how
ASML is performing compared to its peers and if ASML is, in fact, performing better than its peers.
indicators around the time of the product introductions and compare this with the other companies.
4.1. Firm performance analysis
The firm performance analysis is split into 2 parts since there is no data for Tobin’s Q and Earnings Per Share for Ultratech since Ultratech does not have shares since around 2000. If the analysis is performed in one go (all variables) SPSS will not perform posthoc analysis for Tobin’s Q and Earnings Per Share because in order to perform posthoc analysis at least 2 cases are needed. The first part will include all variables excluding Tobin’s Q and Earnings Per Share and include all companies (ASML, Canon, Nikon and Ultratech). The second part will consist out of the Tobin’s Q and Earnings Per Share performed for the companies with data for those variables (namely ASML, Canon and Nikon) excluding Ultratech. See the assumptions in the appendix(9.4.1.)
4.1.1. Descriptive statistics (part 1)
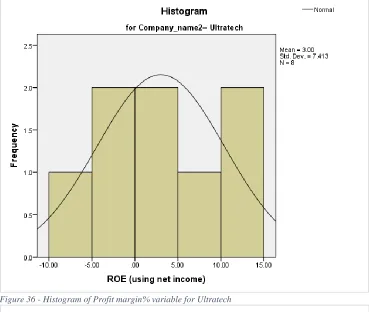
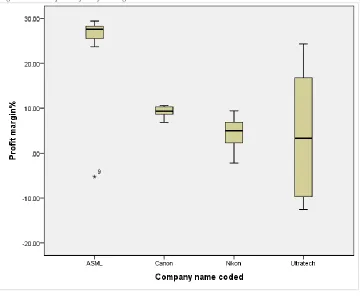
In the descriptive statistics (see appendix figure 68) we can see that ASML’s mean score is the highest for three out of the four variables, “ROA”, “ROE” and “Profit Margin%” but Canon scores highest on “Gross Margin%”.
For the variable “ROA”, ASML has the highest mean with “11.2172”, followed by Canon with “5.0352”, Nikon “2.9558” and Ultratech “2.4800”. As can be seen in the descriptive statistics table the order of highest to lowest is for the variables “ROE” and “Profit Margin%” the same as “ROA” with ASML having the highest mean score followed by Canon, then Nikon and with the lowest score Ultratech. Yet, for the variable “Gross Margin%” Canon has the highest mean score with “55.9286”, followed by Ultratech with “51.7039”, then ASML with “46.9156” and Nikon with the lowest score of “40.0535”.
Before we can say much about these scores and if their mean differences are significant we will look at the result of the multiple comparisons stable in the next part.
4.1.2. Results (part 1)
The results of the MANOVA for the firm performance (part 1) analysis can be found in the multiple comparisons table 15 in the appendix. In this table we can see that from three out of the in total four firm performance (part 1) variables the group mean difference of “ASML-Canon”, “ASML-Nikon” and “ASML-Ultratech” is significant. This goes for and for the variables "ROE", "Profit Margin%" and "Gross Margin %". For the last variable "ROA" the group mean difference "ASML-Nikon" and "ASML-Ultratech".
Continuing with the results, now that we know which group mean differences are significant and which are not we are going to look back at the group means again. We will refer back to table 15 (appendix) statistical significance of the (group) mean differences and refer to table 4 for the means of the groups.
For the variable “ROA” we can see that the mean difference of Canon” is not significant but “ASML-Nikon” and “ASML-Ultratech” are. This means we can only conclude that ASML has a mean of “11.2172” that is
significantly higher than the mean of Nikon with “2.9558” and Ultratech with “2.48”. As said before the mean difference between ASML (11.2172) and Canon (5.0352) is not significantly different. The group mean difference of “Canon-Nikon” and “Canon-Ultratech” is also not significant.
For the variable “ROE” we can see that the group mean difference Canon”, Nikon” and “ASML-Ultratech” are all significant. Meaning that ASML has the highest mean score of “ROE” with “20.0354”. However, the group mean differences Nikon” and “Canon-Ultratech” are not significant, meaning, we cannot say that there is a difference in the group means of “ROE” for Canon, Nikon and Ultratech.
For the variable “Profit Margin%” we can again conclude that ASML a significantly higher mean score with a score of “23.5676”. This is because the group mean differences of “ASML-Canon”, “ASML-Nikon” and “ASML-Ultratech” are significant. Though, again the “Canon-Nikon” and “Canon-Ultratech” group mean differences are not significant at this sample size.
For the variable “Gross Margin %” all group mean differences are significant. This means that we can conclude that for the variable “Gross Margin%” that Canon has the highest mean score with “55.9286” followed by Ultratech with “51.7039”, then ASML with “46.9156” and Nikon with the lowest score of “40.0535”.
Table 4 - Adapted from firm performance analysis descriptive (part 1) table
Company name
coded Mean
ROA (using net income)
ASML 11.2172
Canon 5.0352
Nikon 2.9558
Ultratech 2.48
ROE (using net income)
ASML 20.0354
Canon 7.3752
Nikon 5.5039
Ultratech 3.0014
Profit margin%
ASML 23.5676
Canon 9.1568
Nikon 4.4146
Ultratech 4.0746
Gross Margin %
ASML 46.9156
Canon 55.9286
Nikon 40.0535
Ultratech 51.7039
4.1.3. Descriptive statistics (part 2)
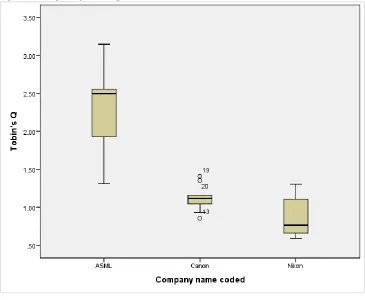
share” ASML has the highest mean score. For the variable “Tobin’s Q” ASML has the highest mean score with “2.3790”, followed by Canon with a mean score of “1.1213” and with Nikon with the lowest score of “0.8736”. In addition, ASML has a mean score of “2.7937” for “Earnings Per Share” compared to Canon with “1.3615” and Nikon with “0.6125”.
Before we can say much about these scores and if the mean differences are significant we will look at the result of the multiple comparisons stable in the next part.
4.1.4. Results (part 2)
The results of the MANOVA for the firm performance (part 2) analysis can be found the multiple comparisons table (in table 16 appendix). In this table we can see that for both variables “Tobin’s Q” and “Earnings per share” the group mean differences of “ASML-Canon” and “ASML-Nikon” are significant. However, the group mean differences of “Canon-Nikon” for both “Tobin’s Q” and “Earnings per share” are found to be not significant. ".
Table 5 - Adapted firm performance analysis part 2 descriptive statistics
Company name coded Mean
Tobin's Q
ASML 2.3790
Canon 1.1213
Nikon 0.8736
Earnings per share
ASML 2.7937
Canon 1.3615
Nikon 0.6125
Continuing with the results, now that we know which group mean differences are significant and which are not we are going to look back at the group means again. We will refer back to table 16 (appendix) for statistical significance of the (group) mean differences and refer to table 5 for the means of the groups.
As we concluded before the group mean differences of “ASML-Canon” and “ASML-Nikon” are significant for both variables. This means that we can conclude that ASML has a significantly higher mean score of “2.3790” than Canon with “1.1213” and Nikon with “0.8736” for Tobin’s Q. This is also for “Earnings per share” were ASML has a significantly higher mean score of “2.7937” than Canon with “1.3615” and Nikon with a mean score of “0.6125”. Yet for both variables we cannot conclude that there is a difference in group means among Canon and Nikon.
4.2. Patent analysis
In the appendix the previous patent analysis that was done before the combining of the patent-based indicators can be found (see headers 9.3. and 9.5. in the appendix).In this section we are going to map and look at the patent variables and the product introductions of the four companies.
4.2.1. Product introductions
In this section we are going to map and look at the patent variables, firm performance and the product introductions of the four companies. In table 6 below, we can see the product introduction years of lithography systems or also called lithography platforms.
Table 6 - Product introduction years of lithography systems (platform)per company (ASML, 2018; Nikon, 2018; Canon, 2018; Ultratech, 2016)
ASML Canon Nikon Ultratech
1984 PAS 2000 Early 1990s i-line 1978 SR-1 1984 Model 1000 1989 PAS 5000 Late 1990s KrF system 1980 NSR-1010G 1998 XLS platform 1990s PAS 5500 Early 2000s ArF system 1995 NSR-S201A 2004 Unity Platform 2000s Twinscan XT-NXT Late 2000s ArF immersion 2000 NS302A (ArF) 2011 SLA system 2010s Twinscan NXE Late 2010s ArF immersion (improved) 2005 NSR-S609B (ArF immersion 2012 Superfast system
Firstly, as can be seen in table 6 above, the product introductions of ASML’s lithography platforms are in the years 1984, 1989, 1990s, 2000s, and 2010s. Secondly, for Canon the product introductions are in the early 1990s, late 1990s, early 2000s, late 2000s, and late 2010s. Thirdly, looking at Nikon we can see that their product introductions were in 1978, 1980, 1995, 2000, and 2005. Lastly, Ultratech’s lithography system introductions are in the years 1984, 1998, 2004, 2011 and 2012.
Now that we have determined lithography systems (platforms) introductions of the four companies introduced their we go on to the actual part of mapping the patent variables and firm performance variables and looking at the product introductions.
Figure 8 - Patent variables and product introduction mapped for Ultratech Figure 7 - Patent variables and product introduction mapped for Nikon
Continuing with patent-based indicators and product introductions, we are now going to examine the graphs looking at the product introductions and between the product introductions if we can see patterns emerging.
We begin with ASML, see figure 5, the first thing to notice is that there is no data from before 1990, meaning that we cannot conclude anything from before 1990. Wat we can see in this figure that between the introductions of 1990, 2000 and 2010 a lot seems to happen. Around the 1990 introduction the data starts at a high point when looking at variable “NB_CITING_DOCDB_FAM”, suggesting that before that introduction also patterns might have happened. Between 1990 and 2000, and between 2000 and 2010 we can see some approximately s-curved patterns emerging. For instance, for the variable “NB_CITING_DOCDB_FAM” we can see a s-curved pattern starting just after the 1990 introduction with a seemingly growth phase between 1992 and 1994. From 1994 until 1996 could be seen as a maturity phase before the decline phase starts just after 1996. This is until the next introduction of 2000 in which we can see a s-curved pattern emerging again only this time with a shorter maturity phase and a longer decline phase until the next introduction of 2010. A similar pattern seems to emerge for Novelty1 between 1990 and 2000 only after the decline phase of 1996 it rises again (showing a similarity figure 3 product life cycle extension) with until just before the introduction of 2000. Between the introductions of 2000 and 2010 we can see a s-curved pattern for Novelty1 as well but only short from just before 2000 to 2002 when a sizeable decline sets in until the introduction of 2010. When looking at Novelty2, we can see that there is not much happening between the 1990 and 2000 except for the slight increase in 1997. However, between 2000 and 2010 we can see a pattern that looks similar to the rapid penetration pattern (see figure 10 in appendix).
Next is Canon, see figure 6, the very first thing to notice is that before the first (known) introduction a spike in the variable “NB_CITING_DOCDB_FAM” occurs in 1982. This makes some of the patterns happening in the other variable seem less notable or remarkable but comparing the max of these patterns (around the 50 mark) with the scales of the others suggest that these are notable. Before the first (known) introduction we can see a few approximately s-curved patterns happening. For instance, for “NB_CITING_DOCDB_FAM” between 1970 and 1976 two small s-curved patterns seem to be happening just before the large spike. Additionally, for “Novelty1” we can see a s-curved pattern happening from 1970 until 1974 when a sizable decline sets in, however, from 1982 until just after 1984 we can notice what seems to be a rapid penetration pattern again. When looking at the introductions between the early 1990s, late 1990s, early 2000s and late 2010s we can see fairly stable lines which makes it seems like a plateau is occurring for both “NB_CITING_DOCDB_FAM” and “Novelty1” for Canon. On the other hand, for “Novelty2” we can see some patterns happening between the introductions. For instance, between the introduction of 1990 and 1998 an
approximately s-curved pattern seems to be present. After 1998 introduction we still see some (minor) s-curved patterns happening (between 1998-2000 and 2000-2004), however they seem to have a downward trend.
Then for Nikon, see figure 7, first thing to notice is that “NB_CITING_DOCDB_FAM” and “Novelty1” seems to follow quite similar patterns (or trend). With approximate rapid penetration pattern occurring between 1980 and 1986 and then after 1986 some slight s-curved during/right after the seemingly decline phase until the next introduction of 1995. For “NB_CITING_DOCDB_FAM” a s-curved pattern seems to be visible just after the introduction of 2000 until the next introduction of 2005. On the contrary, the same s-curved pattern seems to be visible around the same time only starting already around 1997 for “Novelty1”. When we look at “Novelty2” we can see that not much is happening between the introduction of 1980 and 1985. Just after 1985 some slightly s-curved patterns start to be happening until the introduction of 2000. These s-curved patterns seem to look like the cycle-recycle pattern as described in figure 12 in the appendix. Between the introductions of 2000 and 2005 we can see some sharp spikes happening what appear to look like the rapid penetration pattern (see figure 10 in appendix)
Last for Ultratech, see figure 8, the first thing we can notice that a lot is happening between the introductions for “NB_CITING_DOCDB_FAM” and “Novelty1”. We can see that between the introductions of 1998 and 2004 for “NB_CITING_DOCDB_FAM” two really spiked (rapid penetrations) seem to be happening whereas for “Novelty1” we can see three really spiked (rapid penetrations) happening. For Ultratech for both variables we can see that between the introduction of 2004 and 2011 multiple small but with downward trend s-curved, or better yet, rapid penetrations (figure 12) seem to be happening.
When comparing the four companies they seem to have quite some different patterns, however often between the introduction we can notice patterns from the product life cycle theory and the technological life cycle theory, such as, s-curved patters and rapid penetration patterns. To illustrate, in general, ASML and Nikon seem to have fewer but larger cycle patterns whereas Canon and Ultratech have multiple (somewhat) smaller cycles.
5. Discussion and conclusion
The focus of this research is to examine the differences between ASML and its peers based on measures using patent-based indicators, firm performance indicators and product introductions.
indicators around and between the time of the product introductions.
Now that we have looked at all the results we will answer the research questions stated in the introduction.
SQ1: “How does ASML differ from its industry peers based
on firm performance indicators?
For "ROA" we can only conclude that ASML has a significantly higher group mean than Nikon and Ultratech. Meaning that ASML’s has significantly higher Return on their Assets than Nikon and Ultratech.
For "ROE" we can conclude that ASML has a significantly higher mean score than Canon, Nikon and Ultratech. Meaning that ASML has significantly more return on the equity they have than Canon, Nikon and Ultratech.
For “Profit Margin%” we can conclude that ASML has a significantly higher mean score than Canon, Nikon and Ultratech. Meaning that after all costs deducted from revenue, ASML has the higher profit percentage (profit margin%) than Canon, Nikon and Ultratech.
For “Gross Margin %” we can conclude that Canon has the highest significant mean score followed by Ultratech, ASML and with the lowest score Nikon. Meaning that Canon scores second to lowest when looking at Gross Margin %.
For both "Tobin's Q" and "Earnings per share" we can conclude that ASML has a significantly higher mean score than Canon and Nikon. Meaning that for the most widely used firm performance proxy (Tobin’s Q) ASML scores significantly higher than Canon and Nikon. In addition to that, ASML’s investors earn (on average) significantly more per share than those of Canon and Nikon.
Thus, in general we can conclude that ASML often (on average) performs better than its peers when looking at these firm performance indicators.
SQ2a: “When looking at the mapped patent-based indicators
and product introductions, what patterns can be seen?” When we look around the time of the product introductions and between the introductions we mainly notice patterns from the product life cycle theory and the technological life cycle theory, such as, s-curved patters and rapid penetration patterns.
SQ2b “When looking at the mapped patent-based indicators
and product introductions, how do ASML’s patterns differ from its peers?”
When comparing the four companies they seem to have quite some different patterns, however often between the introduction we can notice patterns from the product life cycle theory and the technological life cycle theory, such as, s-curved patters and rapid penetration patterns. To illustrate, in general, ASML and Nikon seem to have fewer but larger cycle patterns whereas Canon and Ultratech have multiple (somewhat) smaller cycles
CQ: “How does ASML differ from their industry peers when
looking at firm performance indicators, patent-based indicators and product introductions?”
We can conclude that ASML differs from its peers based on firm performance and patent-based indicators. Regarding firm performance we can observe that ASML often (on average) scores better based on the firm performance indicators. In addition to that we can conclude from the patent analysis that the patterns emerging in the mapped patent-based indicators are often conform the theory of the product life-cycle and the technological life-cycle. This means that we often see s-curved patterns.
When considering ASML as an innovator (Reuters top 100 global innovators list of 2011), we could state that Teece's (1986) does not hold for ASML and its peers because ASML seems to perform well based on firm performance indicators (on average often better than its peers) and perform well based on patent analysis(innovations).
Looking back at the dominant design the dominant design in the theoretical background. Considering the phases of the dominant design we might conclude that ASML and its peers are still in phase 4, the decisive battle phase. This is because their the increasingly large customer bases have started to have an important effect on the choices of the customers and there is fierce competition for enlarging customer bases.
6. Limitations and future research
Firstly, the lack of available data for firm performance variables was a limiting the scope of the firm performance analysis. Secondly, a small sample size for firm performance analysis (also due to previously mentioned limitation) limited this research. Thirdly, the MANOVA (Multivariate analysis in SPSS) is only able to deal with missing variables listwise (not pairwise which is possible in one-way anova) limiting the sample size/group size of for instance Ultratech. Lastly, this study was limited due to the fact this research is for a master thesis and the time constrain that brings. Future research could be incorporating the firm performance into the mapping if the required data can be secured.
7. Acknowledgements
I would like to thank my first supervisor Dr. Ir. E. Hofman, second supervisor Dr. M. de Visser and external supervisor Mr. A. Kovács for the support they provided during the entire research process.
8. References
Abbas, A., Zhang, L., & Khan, S. U. (2014). A literature review on the state-of-the-art in patent analysis. World Patent Information, 37, 3-13.
doi:10.1016/j.wpi.2013.12.006
Al-Matari, E. M., Al-Swidi, A. K., & Fadzil, F. H. (2014). The Measurements of Firm Performance’s Dimensions. Asian Journal of Finance & Accounting, 6(1). doi:10.5296/ajfa.v6i1.4761 Arts, S., Appio, F. P., & Van Looy, B. (2013). Inventions
shaping technological trajectories: do existing patent indicators provide a comprehensive picture? Scientometrics, 97(2), 397-419. doi:DOI
10.1007/s11192-013-1045-1
ASML. (2012). Enabling innovation. Retrieved September 9, 2018, from ASML:
https://www.asml.com/enabling-innovation-/kr/s45818?dfp_fragment=stratman_2 ASML. (2018, February 8). Our history. Retrieved
September 3, 2018, from ASML: https://www.asml.com/company/our-history/en/s277?rid=51985
Calantone, R. J., Vickery, S. K., & Dröge, C. (1995). Business Performance and Strategic New Product Development Activities: An Empirical
Investigation. Journal of Product Innovation Management, 12(3), 214-223. doi:10.1016/0737-6782(95)00021-K
Canon. (2018). The History of Semiconductor
Miniaturization. Retrieved September 3, 2018, from Canon:
http://www.canon.com/technology/future/nanoimpr int-lithography.html
Cao, H., & Folan, P. (2012). Product life cycle: the
evolution of a paradigm and literature review from 1950–2009. The Management of Operations, 23(8), 641-662. doi:10.1080/09537287.2011.577460 Castellano, R. (2017, March 30). The Switch To ASML's
EUV Lithography Will Impact The Entire Semiconductor Supply Chain. Retrieved from Seeking Alpha:
https://seekingalpha.com/article/4059013-switch- asmls-euv-lithography-will-impact-entire-semiconductor-supply-chain
Clarke, P. (2018, February 2018). ASML increases dominance of lithography market. Retrieved September 3, 2018, from Eenewsanalog: http://www.eenewsanalog.com/news/asml-increases-dominance-lithography-market
Damanpour, F., Walker, R. M., & Avellaneda, C. N. (2009). Combinative Effects of Innovation Types and Organizational Performance: A Longitudinal Study of Service Organizations. Journal of Management Studies, 46(4).
doi:10.1111/j.1467-6486.2008.00814.x
Forbes. (2018). The World’s Largest Public Companies. Retrieved September 3, 2018, from Forbes: https://www.forbes.com/global2000/list/
Frijns, B., Dodd, O., & Cimerova, H. (2016). The impact of cultural diversity in corporate boards on firm performance. Journal of Corporate Finance, 41, 521-541. doi:10.1016/j.jcorpfin.2016.07.014 Hall, B. H., Jaffe, A. B., & Trajtenberg, M. (2001). The
NBER Patent Citation Data File: Lessons, Insights and Methodological Tools. National Bureau of Economic Research. Retrieved from
http://www.nber.org/papers/w8498
Henderson, R. M., & Clark, K. B. (1990). Architectural Innovation: The Reconfiguration of Existing Product Technologies and the Failure of Established Firms. Administrative Science Quarterly, 35(1), 9-30. doi:10.2307/2393549 Laerd Statistics. (2018). One-way manova - SPSS statistics.
Retrieved September 3, 2018, from Laerd Statistics:
https://statistics.laerd.com/premium/spss/owm/one-way-manova-in-spss.php
Levitt, T. (1965). Exploit the Product Life Cycle. Harvard Business Review. Retrieved from
https://hbr.org/1965/11/exploit-the-product-life-cycle
Lu, G., & Shang, G. (2017). Impact of supply base structural complexity on financial performance: Roles of visible and not-so-visible characteristics. Journal of Operations Management, 53, 23-44. doi:10.1016/j.jom.2017.10.001
Lumen. (n.d.). Technology as a driver and enabler of innovation. Retrieved September 3, 2018, from Lumenlearning:
https://courses.lumenlearning.com/boundless-management/chapter/technology-and-innovation/ McKinsey. (2013, December). Moore's Law: Repeal or
renewal? Retrieved May 27, 2018, from Mckinsey.com:
https://www.mckinsey.com/industries/semiconduct ors/our-insights/moores-law-repeal-or-renewal Miles, R. E., Snow, C. C., Meyer, A. D., & Coleman, H. J.
(1978). Organizational Strategy, Structure, and Process. The Academy of Management Review, 546-562. doi:10.2307/257544
Morgan, N. A., Vorhies, D. W., & Mason, C. H. (2009). Market Orientation, Marketing Capabilities, and Firm Performance. Strategic Management Journal, 30(8), 909-920. doi:10.1002/smj.764
Neely, A., Gregory, M., & Platts, K. (1995). Performance measurement system design: A literature review and research agenda. International Journal of Operations & Production Management, 15(4), 80-116.
https://www.nikon.com/products/semi/history/inde x.htm
OECD. (2004). Patents and Innovation: Trends and Policy Challenges. Retrieved from
https://www.oecd.org/sti/sci-tech/24508541.pdf Peni, E. (2014). CEO and Chairperson characteristics and
firm performance. Journal of Management & Governance, 18(1), 185-205. doi:10.1007/s10997-012-9224-7
Peper, F. (2017). The End of Moore’s Law: Opportunities for Natural Computing? New Generation Computing, 35(3), 253-269.
Rink, D. R., & Swan, J. E. (1979). Product life cycle research: A literature review. Journal of Business Research, 219-242.
Rowley, J., Baregheh, A., & Sambrook, S. (2011). Towards an innovation-type mapping tool. Management Decision, 49(1), 73-86.
doi:10.1108/00251741111094446 Schumpeter, J. (1934). The theory of economic
development. Harvard Economic Studies. SEMI. (2015, May 5). Fifty Years of Moore’s Law Made
Possible by Equipment and Materials Suppliers. Retrieved May 27, 2018, from Semi.org: http://www.semi.org/en/node/55936 SEMI. (2016, March). Why moore matters. Retrieved
September 3, 2018, from SEMI: http://www.semi.org/en/node/55026
Shahmarichatghieh, M., Tolonen, A., & Haapasalo, H. (2015). Product life cycle, technology life cycle and market life cycle; similarities, differences and applications. MakeLearn & TIIM 2015 conference. Toknowpress. Retrieved from
http://www.toknowpress.net/ISBN/978-961-6914-13-0/papers/ML15-222.pdf
Stebbins, R. A. (2011). Exploratory Research in the Social Sciences. SAGE Publications, Inc.
doi:10.4135/9781412984249
Suarez, F. F. (2004). Battles for technological dominance: an integrative framework. Research Policy, 2, 271-286. doi:10.1016/j.respol.2003.07.001
Teece, D. J. (1986). Profiting from technological innovation: Implications for integration, collaboration, licensing and public policy. Research policy, 15(6), 285-305.
doi:10.1016/0048-7333(86)90027-2
Ultratech. (2004). Annual report 2004. Retrieved September 3, 2018, from
http://files.shareholder.com/downloads/UTEK/637 7574040x0xS1104659-04-7074/909791/filing.pdf Ultratech. (2016). Annual report 2016. Retrieved September
3, 2018, from
http://www.annualreports.com/Company/ultratech-inc
USPTO. (2015, October). General information concerning patents. Retrieved January 14, 2018, from https://www.uspto.gov/patents-getting- started/general-information-concerning-patents#heading-2
Venkatraman, N., & Ramanujam, V. (1996). Measurement of Business Performance in Strategy Research: A Comparison of Approaches. Academy of
Management Review, 11(4), 801-814. Verhoeven, D., Bakker, J., & Veugelers, R. (2013).
Identifying ex ante characteristics of Radical Inventions through patent-based indicators. SSRN Electronic Journal. doi:10.2139/ssrn.2382485 WIPO. (n.d.). Patent Drafting Manual. Retrieved January
14, 2018, from
http://www.wipo.int/edocs/pubdocs/en/patents/867/ wipo_pub_867.pdf
Yin, R. K. (1981). The Case Study Crisis: Some Answers. Administrative Science Quarterly, 26, 58-65. Yin, R. K. (1994). Case Study Research: Design and
9. Appendix
9.1. SEMI infographic
9.2. Product life cycle
Figure 11 - Technology Life Cycle s-curve adapted from (Lumen, n.d.)
9.3. Patent analysis
9.3.1. Overview data
Figure 13 - Overview of patents per IPC sections
Figure 14 - Overview of patents per IPC section
0 50000 100000 150000 200000 250000 300000 350000
16852
102609
20409
819 319 6515
318524
181828
Count of IPC per IPC section
Table 7 - Overview variables used in (previous) patent analysis
Variable Measurement
NB_CITING_DOCDB_FAM Number of forward citations related to the patient’s family.
GENERAL_IPC4 If a patent is cited by subsequent patents that belong to a wide range of fields the measure will be high,
whereas if most citations are concentrated in a few fields it will be low (for IPC4) (Hall et al., 2001).
GENERAL_IPC6 If a patent is cited by subsequent patents that belong to a wide range of fields the measure will be high,
whereas if most citations are concentrated in a few fields it will be low (for IPC6) (Hall et al., 2001).
ORIGINAL_IPC4 Measured in the same way as the “GENERAL” variable except regarding the amount of citations made
by the patent itself (for IPC4) (Hall et al., 2001).
ORIGINAL_IPC6 Measured in the same way as the “GENERAL” variable except regarding the amount of citations made
by the patent itself (for IPC4) (Hall et al., 2001).
NEW_FUNCTIONALITY_IPC4 New Functionality regards the extent to which an invention provides substantially new functional
capacities (for IPC4).This indicator counts the number of new pairwise combinations of technological
classes a patent is assigned to (Verhoeven et al., 2013).
NEW_FUNCTIONALITY_IPC6 New Functionality regards the extent to which an invention provides substantially new functional
capacities (for IPC6). This indicator counts the number of new pairwise combinations of technological classes a patent is assigned to (Verhoeven et al., 2013).
NEW_ORIGIN_IPC4_FULL New Origins reflects the extent to which an invention builds on different technological knowledge and
principles compared to common practice (for IPC4). The indicator measures the number of new technological class pairs created through the backward citations of a patent (Verhoeven et al., 2013).
NEW_ORIGIN_IPC6_FULL New Origins reflects the extent to which an invention builds on different technological knowledge and
principles compared to common practice (for IPC6). The indicator measures the number of new
technological class pairs created through the backward citations of a patent (Verhoeven, Bakker and Veugelers, 2013).
NEW_IMPACT_IPC4_FULL New impact regards to inventions that relate for the first time two previously disconnected technological
fields. The indicator counts the number of new combinations of technology classes created by citations from other patents to the focal patent (for IPC4) (Verhoeven et al., 2013).
NEW_IMPACT_IPC6_FULL New impact regards to inventions that relate for the first time two previously disconnected technological
fields. The indicator counts the number of new combinations of technology classes created by citations from other patents to the focal patent (for IPC6) (Verhoeven et al., 2013).
9.3.2. Assumptions
The first three assumptions of the one-way MANOVA are #1 there are two or more dependent variables, #2 the independent variable is categorical with two or more independent groups and #3 and there is independence of observations. The patent data meets these assumptions because #l there are eleven dependent variables, #2 the independent variable is “company_name2” which consists out of four categorical independent groups namely companies/categories “ASML”, “Canon”, “Nikon” and “Ultratech”. #3 The observations are all independent (Laerd Statistics, 2018).There are six more assumptions, which will be listed and discussed below, to be met. However, as stated by Laerd Statistics (2018) it is not uncommon in the real world for the data you have collected to violate (i.e., fail) one or more of these six other assumptions, this just means different ways to proceed.
Assumption #4: There should be no univariate or multivariate outliers. There are outliers in the data, as assessed by inspection of the boxplots (see figures 74 – 83 in appendix), however it was decided to include the outliers in the analysis anyway since they are not data entry errors and represent the data.
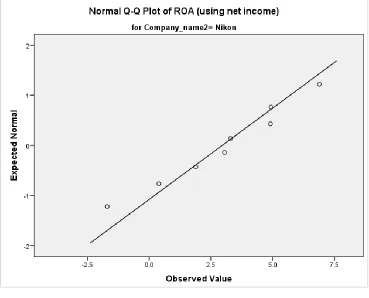
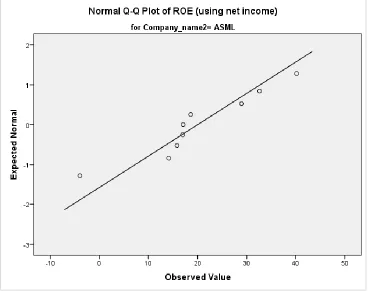
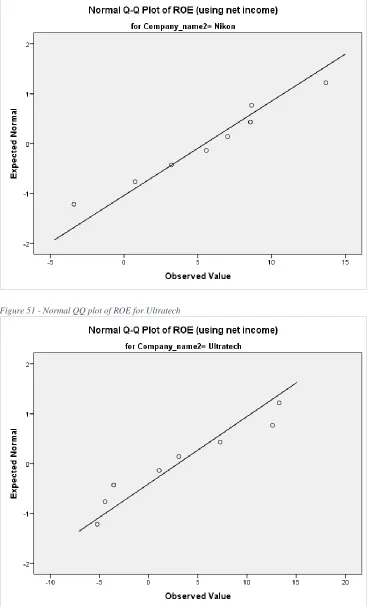
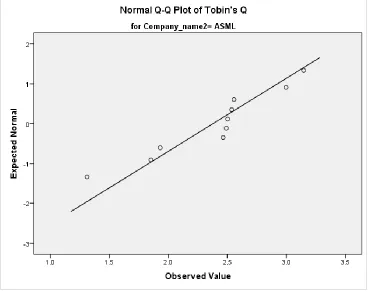
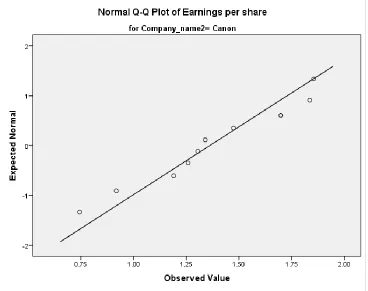
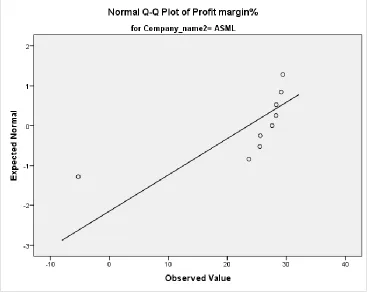
Assumption #5: There needs to be approximate normality. Most of the variables show approximate normal distribution, some of the variables show a little less approximate normal distribution. As the one-way MANOVA is fairly robust to deviations from normality it was decided to proceed. (see figures 31-73 in the appendix)
Assumption #6: There should be no multicollinearity. There was no multicollinearity, as assessed by Pearson correlation (see table 11 in the appendix)