UTHM
ISSN 2229-8460 Volume 4 No.2/December 2012
Editorial Board iii Preface iv
CONTENTS
1. High Pressure Processing of Honey: Preliminary Study of Total Microorganism Inactivation and Identification of Bacteria M.F. Noor Akhmazillah, M.M. Farid and F.V.M. Silva
2. Genetically Modified Mosquito: Myth and Reality Teh Su Yean, Koh Hock Lye and Yeap Kiew Lee
3. Kenaf Core Particleboard and Its Sound Absorbing Properties Mohamad Jani Saad and Izran Kamal
4. Numerical Solution of Mixed Convection Flow about a Sphere in a Porous Medium Saturated by a Nanofluid: Brinkman Model Leony Thamand Roslinda Nazar
5. Arsenic(III) Immobilization on Rice Husk
Malay Chaudhuriand Mohammed Ali Mohammed
6. Numerical Computation of Maximum Shear Stress Intensity for a Nearly Circular Crack Subject to Shear Loading
Koo Lee Feng, Nik Mohd Asri Nik Long, Eshkuvatov Zainidin Kand Wong Tze Jin
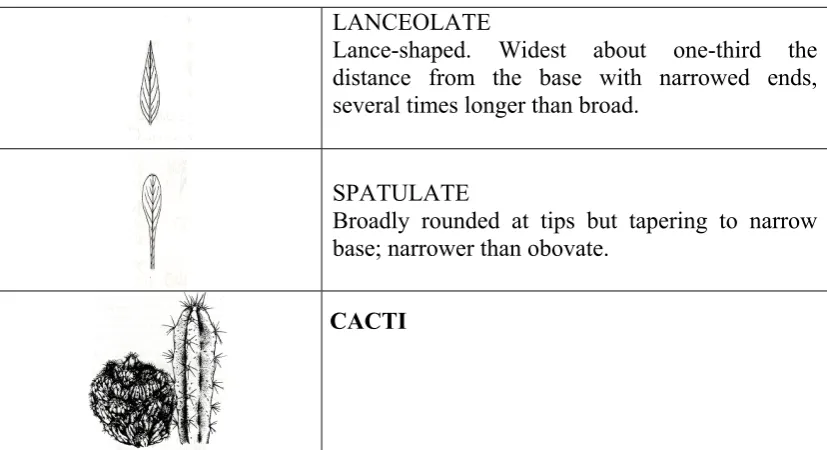
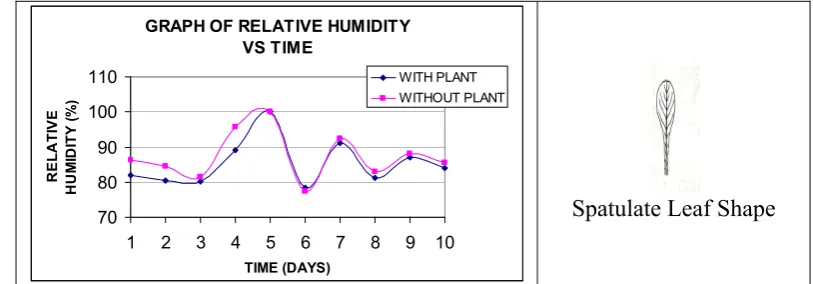
7. A Study on Plant Selection for Green Building Design Izudinshah Bin Abd. Wahab and Lokman Hakim Bin Ismail
8. A Rank Test on Equality of Population Medians Pooi Ah Hin
9. Epoxidation of Palm Kernel Oil Fatty Acids Michelle Ni Fong Fong and Jumat Salimon
1-12
13-22
23-34
35-46
47-54
55-64
65-78
79-86
Regression Models
Mohd Saifullah Rusiman, Robiah Adnan, Efendi Nasibov,
Kavikumar Jacob
11.Thermal and Solutal Mixed Marangoni Boundary Layers with Suction or Injection Effects
Noraini Ahmad, Seripah Awang Kechiland Norma Mohd Basir
JOURNAL OF SCIENCE AND TECHNOLOGY
EDITOR-IN- CHIEF Zaidi Embong
Universiti Tun Hussein Onn Malaysia
EDITORIAL BOARD
Rozaini Roslan, Universiti Tun Hussein Onn Malaysia Mohd Arif Agam, Universiti Tun Hussein Onn Malaysia
Mohd Ambar Yarmo, Universiti Kebangsaan Malaysia Azman Jalar, Universiti Kebangsaan Malaysia Abdul Khamim Ismail, Universiti Teknologi Malaysia
YH Taufiq Yap, Universiti Putra Malaysia Ali Mamat, Universiti Putra Malaysia Mohd Shukri Hassan, Jabatan Kimia Malaysia
FOREWORD
The Journal of Science and Technology is a biannual refereed journal which publishes original research papers in areas of science and technology. Research areas include conventional subjects such as Physics, Mathematics, Biology, Chemistry and Computer Science. Papers relating directly or indirectly to all aspects of these fields are welcome. The journal is intended to provide a forum for expression of new ideas, as well as a place for exposition of these areas of knowledge.
We would like to thank the authors for submitting their papers to this journal. We are grateful to the referees for their work in ensuring the high quality of the submissions. Finally, we would like to thank the UTHM Publisher’s staff for their help to make this issue possible.
For article submission, please direct to:
Zaidi Embong Editor-in-Chief
Journal of Science and Technology Universiti Tun Hussein Onn Malaysia
1
High Pressure Processing of Honey:
Preliminary Study of Total
Microorganism Inactivation and
Identification of Bacteria
M.F. Noor Akhmazillah1,2*, M.M. Farid1, F.V.M. Silva1
1Department of Chemical and Materials Engineering, University of Auckland, Private Bag 92019
Auckland 1142, New Zealand.
2 Department of Chemical and Bioprocess Engineering, Faculty of Civil and Environment Engineering, UniversitiTun Hussein Onn Malaysia, 86400 Parit Raja,
BatuPahat, Johor, Malaysia.
*Corresponding email: nmoh311 @aucklanduni.ac.nz
Abstract
Due to the demand for better quality and safety food as it provides health benefits, the study of innovative high pressure processing (HPP) is currently one of the most interesting researches in food processing and preservation. As an alternative to classical thermal processing, HPP has potential to produce high quality foods that are microbiologically safe with ‘fresh-like’ characteristics and improved functionalities. In present work, the use of HPP will be investigated for its ability to inactivate bacteria spores, the heat resistance microbes. Preliminary results show that it is possible to use HPP to inactivate microorganisms present in high sugar content foods, particularly in Manuka honey. Further investigation will be carried out to find an optimal combination of treatment pressure, temperature and time. This project will generate a new approach in honey processing which can guarantee the safety of honey without a compromise on its quality and natural freshness.
2
1. INTRODUCTION
Honey is the world's primary sweetener and nature’s original sweetener prepared by honey bees. Honey has been used as a food for at least 6000 years. The popularity of honey is largely due to it being a natural sweetener evolved from the nectar mainly consisting of glucose and fructose. The honey in the nutshell is flower nectar which has been collected, regurgitated and dehydrated by honey bees to enhance its nutritional properties and ready to be consumed by humans. The consumption of honey is on the rise due to the unique combination of components in honey which makes it a prized addition to the diet. According to Food and Agriculture Organization of the United Nations (FAO), total honey production in 1961 was 0.7 million tonnes and it was steadily increased to about 1.5 million tonnesin 2009.The demand for high quality honey is attracting a lot of attention as it provides health benefits and has been shown to possess antimicrobial, antiviral, antiparasitory, anti-inflammatory, antioxidant, antimutagenic and antitumor effects [1]. Diseases prevention through consumption of honey is probably due to the presence of more than 181 substances with a wide range of health promoting phytochemicals, some with antioxidant properties. Honey antioxidant compounds include phenolic acids, flavonoids [2] and amino acids. The importance of these honey bioactive compounds and antioxidants on human health therefore generates a great interest in honey processing research.
Although consumption of honey has remarkably increased in the last years all over the world, the safety of this product is not regularly assessed. One common problem faced by honey producers is its deterioration in quality with storage due to fermentation. Yeasts are spoilage microorganisms of concern in honey and have been reported to grow to very high numbers [3]. Saccharomyces cerevisiaewas found as the dominant yeast fermenting honey, even at the limited level of water available. It is also known as osmophilic or sugar tolerant yeast because it can withstand the low water content (around 16 - 21 %) and high sugar concentration in honey. Food grade, honey with a very high yeast count (more than 100 000 CFU/g) is not likely to be marketable [3]. With respect to medical health applications, yeast count must be less than 500 CFU/g.
3
causes degradation of bioactive compounds which could affect the quality of the honey. Phenolic compounds were reported as the main honey bioactive compounds which would be negatively affected by the thermal treatment.
High pressure processing (HPP) is a non-thermal treatment which have an optimal effect on product quality and capable to inactivate microorganisms in various food matrices [4]. Although past research has proven that HPP can inactivate most microorganisms such as Escherichia coli, Salmonella sp., Listeria and Vibrio
pathogens without additional heat processing in various food matrices [3], it is not known yet if HPP can inactivate bacterial spores and yeasts especially in high sugar content foods. Hence the effect of HPP on inactivation kinetics of bacterial spores should be carried out. There has been no research on the potential application of HPP to obtain higher quality of honey with ‘fresh-like’ characteristics and improved functionalities.
Besides, a combination of HPP and heat has been used to investigate the efficiency of bacterial spore inactivation [5]. Although HPP is termed a nonthermal process, there is a relationship between pressure and temperature in physical compression due to the adiabatic heating caused by fluid compression at high pressure can cause significant temperature distribution throughout the treated food.
Therefore, it is of paramount importance to establish processing conditions which not only can inactivate the spore forming bacteria and yeasts but also be able to preserve the nutritional quality and bioactive compounds present in honey. This research aims at developing the optimum condition of pressure, temperature and processing time for the inactivation of spore forming bacteria and yeasts to ensure the best honey quality and extended shelf life.
This paper reports pre experimental results of HPP inactivation of total microorganism in Manuka honey at different pressure levels and at different treatment time. The identification of bacterial spore which dominantly found in Manuka honey was also investigated.
2. MATERIALS AND METHODS
2.1 Honey Sample and Packaging
4
Honey of 2 g, in duplicate, were packed in 5 cm x 5 cm transparent plastic film pouches (Cas-pak plastic vacuum pouch, New Zealand) and thermosealed under vacuum. The plastic film is made of cast polypropylene for excellent transparency and heat sealing qualities which can withstand temperatures up to 125 °C.
2.2 High Pressure Processing Equipment
The HPP unit used in this research was 2L- 700 Laboratory Food Processing System (Avure Technologies, Columbus, Ohio, USA). The equipment consists of a 2-L cylindrical shape pressure treatment chamber, water circulation, a pumping system and the control system operated through a computer with software supplied by the manufacturer. Distilled water was used as the medium in the chamber where the honey samples were placed. The equipment can operate at maximum pressure and temperature of 600 MPa and 90 °C, respectively.
2.3 Thermal Treatment
The water bath used for thermal treatment in this research was Water Bath W28 (Grant Instruments (Cambridge, Ltd, England). The capacity of tank is 28 litres and made from stainless steel with an easy to clean, solvent resistant plastics outer case. The control units, which are mounted on a bridge plate, offer digital temperature setting and display. This provides powerful stirring to ensure good temperature uniformity throughout the bath. Each bath can be fitted with a pump allowing temperature controlled liquid to be circulated through external apparatus. The consistent temperatures control over the range 0 to 99.9 °C. For the treatment, the vacuum-sealed samples were placed into the tank fully submerged in the distilled water. In this experiment, the temperature of 60 °C, 70 °C and 80°C were chosen considering the standard temperatures to which honey is exposed in industrial liquefaction and pasteurization processes which is 45 °C and 80°C, respectively [6].
2.4 Preparation of Agar Plates
5
2.5 Microbial Enumeration
The microbial enumeration in honey samples was determined as for enumeration of yeasts and moulds. Two grams of each sample was mixed and homogenized with 18 mL of saline water (8.5 g/L) to prepare the initial dilution which is used as the mother dilution. A serial dilution 1/100 to 1/100000 of sample was done. Then, 1 mL of each dilution was inoculated onto PDA agar plates were incubated by spread-platting technique. PDA was used for total microbial counts. The spread-platting was done in duplicate for each series of dilution. The inoculated plates were compute using colony counter (Suntex Colony Counter 570, Taiwan). Only plates presenting 30 – 300 colonies were used for analysis. The colonies were counted as CFU/g.
2.6 Microbial Inactivation in Manuka Honey by HPP and Thermal
Treatment
After vacuum-packing the samples, the pouches were subjected to HPP (except for the control samples) within pressure range of 250 MPa to 450 MPa, temperature between 20° C to 60 °C and processing time between 3 min to 40 min. These ranges were chosen based on the previous works carried out with honey as well as other high sugar food such as fruit jam. Two replicates of honey samples were carried out for the pressure, temperature and time as designed by Design Expert 8.0.1. The treatment time only includes the holding time and does not include the come up time and the decompression time. Pressure come up times were approximately 1.5 min to reach the desired pressure and the decompression time was < 20 s. The adiabatic heating was observed during pressurization phase. A slight decrease in the chamber temperature was observed in particular at higher pressure. The temperature of the pressure medium (distilled water) during pressure treatmentwas measured using a thermocouple. After treatment, the samples were immediately in cooled ice water before the microbial enumeration. For the thermal treatment, the vacuum-sealed samples submerged in the hot distilled water. All the honey samples were taken from the same honey batch.
2.7 Identification of Bacteria in Manuka Honey
6
3. RESULTS AND DISCUSSION
3.1 Microbial Inactivation in Manuka Honey by HPP and Thermal
Treatment
Twenty different experimental conditions (pressure, temperature and time) were tested according to Response Surface Methodology design. The results were analysed using Design Expert 8.0.1 software. Five from 20 runs were found to have incomplete inactivation of microorganism in the samples tested.
Treating samples at 300 MPa showed microbial survivors particularly at lower temperature 30 °C, regardless of treatment time, as tabulated in Table 1. However, the microorganisms were totally inactivated when the temperature increased up to 50 °C. The same pattern was found for treatment at 350 MPa. As comparison with Run 1 (350 MPa, 25 °C, 20 min), increasing temperature up to 40 °C with the same pressure and time (as represented in Run 9 – Run 14) shows total inactivation of the microorganisms present in honey samples. Treatment at 270 MPa and 40 °C for 20 min (Run 6) gave the lowest inactivation of microorganism as compared to other treatments. The result also shows that the pressure of more than 350 MPa and temperature above 40 °C is needed to inactive microorganism present in Manuka honey.
Table 1:Log of microorganism (CFU/g honey) in unprocessed Manuka honey after HPP treatments at different pressure, temperature and time conditions.
7
Figure 1 showed the relationship between pressure and temperature. Increasing the treatment temperature as well as the treatment pressure will reduces the total microorganisms present in the samples.
Figure 1: 3-D graph of interaction between treatment temperature and pressure using HPP
Thermal treatment with higher temperature (above 50 °C ) was performed. The temperature of 60 °C, 70 °C and 80°C were chosen considering the standard temperatures to which honey is exposed to in industrial liquefaction and pasteurization processes which is 45 °C and 80 °C, respectively [6]. The result obtained shows that as temperature increases, the microorganism levels decrease, even though only a slight decrease in the microorganism numbers was observed particularly at lower temperature, 60 °C. As expected, a higher temperature leads to more microbial inactivation. The log of microorganism survival and their reduction in Manuka honey after being treated at three different temperatures for 30 min were tabulated in Table 2. As shown in the table, the reduction of microorganism counts after treatment at 60 °C, 70 °C and 80 °C were not significant. In addition, the effect of increasing temperatures on the reduction of total microorganism count was also not apparent.
8
From both HPP and thermal treatment preliminary test, it clearly shows that thermal treatment gave a minor effect on the microbial inactivation as compared with HPP treatment. This has been proven when 60 °C was applied in thermal treatment, the applied heat was not sufficient to inactivate all microorganism (with 3.8 ± 0.01 log CFU/g of microorganism survival), but when 350 MPa was applied in combination with 60 °C, the microorganism in the samples were not detected.
This preliminary result suggests, by using mild heat in combination with high pressure, a higher quality safe and durable honey can be produced. Based on the amount of microorganism surviving after thermal treatment at 80 °C (with 3.5 ± 0.01 log CFU/g), it is necessary to find out what is the species of microorganism present in the samples. The next section was then discuss on the identification of bacterial species.
3.2 Identification of Bacterial Spore in Manuka Honey
The ability of microorganism to survive after heat treatment, even at higher temperature (80 °C for 30 min), leads to the hypothesis that the microorganisms present in Manuka honey were spore forming bacteria. The hypothesis made was based on the characteristics of the bacterial spores which are resistant to high temperature as noted by previous works [3,8]. The bacterial spores are highly resistant to heat compared to vegetative cells due the endospore content.
The identification of microorganism present in Manuka honey started with cultivation of microorganism on Potato Dextrose Agar (PDA) after heat treatment of samples. The plates were then incubated at 25 °C for 5 days. After 5 days incubation, the white and creamy with round shape colonies were observed on the plate agar as shown in Figure 2.
Figure 2: (a) Microorganism colonies found in Manuka honey samples after treated at 80 °C for 30 min and (b) the colonies were well grown on the Potato Dextrose
9
The investigation proceeded with a general observation on the shape and size of the bacteria. The colonies were viewed under light microscope by putting drops of distilled water on a glass with needle tip of colony. The glass was then covered on top and under microscope with a drop of emission oil to get a clearer image. The shape and size of colony viewed under light microscope were shown in Figure 3. It was found that the microorganism were in rod-shape, elongated chain with the size of more than 4 µm. [7] revealed the bacteria size was in range from 0.2-2 µm in width or diameter, and up to 1-10 µm in length for the nonspherical species. Thus, this observation gives a clear assumption that the microorganisms were from bacteria due to the size. Regarding to the shape, the observation of rod-shaped with 4- 6 µm long in size, make a closer to the prediction that the bacteria found was in genus
Bacillus. [7,9] reported the word bacillus (plural bacilli) is used to describe any rod-shapedbacterium and the size of bacillus of about average size 2.0 to 6.0 m long.
Figure 3: The structure of colony viewed under light microscope (a) shape of the microorganism from the colonies cultivated on the PDA. Small picture shows the clear image of the rod-shaped with elongated chain (b) size of the colonies found
were in the range of 4- 6 µm long.
Polymerase Chain Reaction (PCR) technique was then performed together with DNA sequencing in order to get the DNA sequence of targeted bacteria and compare to other known sequences, using BLAST program. This will result in the identification of bacteria genus and species.
10
Figure 4: (a) Commercial DNA Yeasts Markers, (b)commercial DNA Bacteria Markers
Figure 4 (a) shows a Commercial DNA Yeasts Markers (1kbplus) in Lane 1, meanwhile Lane 2, 3, 4 and 5 were empty with no bands. Meanwhile, Figure 4 (b) shows another gel electrophoresis using commercial DNA Bacteria Markers (1kbplus) with no positive control this time as it is known they were most probably bacteria. Lane 2 and 3 shows a band showing that the target DNA sequences were compatible with bacteria DNA.From the PCR using 16S primers which amplify the ribosomal DNA from the colonies found on the plates, the sequences have been aligned and were run through a program called BLAST found on NCBI. This gave the result of the colony being a Bacillus, most likely the species cereus. The same finding was reported in Moroccon honey [10] and Ibadan honey [11]. They found that most of the samples tested were found from genus Bacillus. In addition, most of the 94 % spores found in commercial honey samples were from genus Bacillus and predominant species was B. cereus [12].
4. CONCLUSIONS
11
Acknowledgement
The financial support from The Ministry of Higher Education of Malaysia and UniversitiTun Hussein Onn Malaysia (UTHM) is gratefully acknowledged. The support of Prof Richard Gardner and Whitney from School Biological Sciences, The University of Auckland is also much appreciated.
REFERENCES
[1] Alvarez-Suarez, J., et al. (2010) Contribution of honey in nutrition and human health: a review. in Mediterranean Journal of Nutrition and Metabolism, Vol. 3. No.1pp. 15-23.
[2] Socha, R., et al. (2011) , Phenolic profile and antioxidant properties of Polish honeys. International Journal of Food Science & Technology. Vol. 46.No.3.pp. 528-534.
[3] Snowdon, J.A. and D.O. Cliver (1996), Microorganisms in honey. International Journal of Food Microbiology, Vol. 31No.1-3.pp. 1-26.
[4] Butz, P., High Pressure: Minimal Processing. (2010) Encyclopedia of Agricultural, Food, and Biological Engineering, New York.
[5] Norton, T. andSun D.W (2008), Recent Advances in the Use of High Pressure as an Effective Processing Technique in the Food Industry. Food and Bioprocess Technology. Vol.1.No..pp. 2-34.
[6] Escriche, I., et al., (2009) Influence of simulated industrial thermal treatments on the volatile fractions of different varieties of honey in Food Chemistry.Vol. 112No. 2.pp. 329-338.
[7] Gould, G.W and Hurs., A. The Bacterial Spore, (1969), London and New York.
[8] Nakano, H., et al.,(1992). Detection of Clostridium botulinum in natural sweetening. International Journal of Food Microbiology. Vol 16. No.2.pp. 117-121.
[9] Miutrka, B.M. Methods of Detection and Identification of Bacteria,
12
[10] Naman Malika, Faid Mohamed and El Adlouni Chakib (2005). Microbiological and Physico-Chemical Properties of Moroccan Honey in International Journal of Agriculture & Biology. Vol. 7.pp. 773- 776.
[11] Adenekan, M.O, Amusa, N.A., Lawal, A.O and Okpeze,V.E. (2010)in Physico-Chemical and Microbiological properties of Honey Samples Obtained from Ibadan. Journal of Microbiology and Antimicrobials.Vol.2 pp. 100-104.
[12] Kokubo, Y., Jinbo, K., Kaneko, S. and Matsumoto. Prevalence of Spore
13
Genetically Modified Mosquito:
Myth and Reality
Teh Su Yean1,*, Koh Hock Lye2 and Yeap Kiew Lee2
1School of Mathematical Sciences, Universiti Sains Malaysia, 11800 Penang, Malaysia.
2School of Civil Engineering, Universiti Sains Malaysia, Engineering Campus, Seri Ampangan, 14300 Nibong Tebal, Penang, Malaysia.
*Corresponding email: [email protected]
Abstract
Sterile Insect Technique (SIT) has been applied successfully in some agricultural pest control programs in the past, but in many cases, success has not been sustainable in the long run. Various attempts have been made to duplicate this limited success SIT application in agriculture to other areas of applications, particularly in vector control. For example, a recent mosquito control program has been initiated in Malaysia to eliminate dengue-mosquitoes Aedes aegypti by releasing large amount of genetically modified GM male mosquitoes into the field to outcompete the wild male mosquitoes. Field experimental data that has been made available in the literature is limited, rendering it difficult to make independent assessment on its short-term efficacy and long-term sustainability of this GM control strategy. This paper presents a preliminary assessment of the effectiveness of GM mosquito in controlling dengue mosquito population by means of model simulations via DEER (Dengue Encephalitis Eradication Routines). Preliminary results indicate negative conclusion regarding the effectiveness of GM mosquitoes in controlling wild A. aegypti population over the long-term. Essentially, significant reduction of wild mosquito population is possible only if large over-flooding ratios are applied. Further, repeated releases must be maintained over an infinite time horizon to continue to sustain low population of mosquitoes. Major difficulty remains to be resolved. In particular, in-depth cost-benefit analysis on this control program is essential to ensure long-term institutional and social support.
14
1. INTRODUCTION
Dengue virus is transmitted to human and female mosquitoes through the bites of female Aedes aegypti mosquitoes. Dengue has been endemic in Malaysia since 1902. In year 2010, around 43,500 dengue fever cases have been reported with 128 fatalities in Malaysia. Effective prevention strategies could reverse these trends, and vector control aimed at vector reduction and interrupting transmission is seen as a key component of such strategies in the absence of effective vaccine for dengue fever. One such vector control method is the Sterile Insect Technique (SIT). SIT is a species-specific and environmentally nonpolluting method of insect control that relies on the release of large numbers of sterile insects [1,2]. Mating of released sterile males with wild females leads to a decrease in the female’s reproductive potential. This eventually would lead to the local elimination or suppression of the pest population if sterile males are released in sufficient numbers over a sufficient period of time. Highly successful, area-wide SIT programs have eliminated or suppressed a range of major veterinary and agricultural pests around the world.
Large rearing facility can produce around 2 billion sterile male Mediterranean fruit flies per week (~20 tons/week). For these agricultural pests, SIT is a proven cost-effective strategy for eradication or suppression of target populations, or to protect areas against invasion or re-invasion. For mosquitoes, the situation is less clear. Field trials in the 1970s and 1980s demonstrated that SIT could also be made to work against mosquitoes, even with the technology then available [3,4]. Recent advances suggest several potential improvements over the methods available in the past. Most current SIT programs use radiation to sterilize the insects. However, it has proven difficult to irradiate mosquitoes to near-complete sterility without significantly weakening them. The field release of a genetically modified (GM) mosquito version of the sterile insect technique (SIT) for Aedes aegypti to eliminate the dengue-mosquitoes is recently experimented in Malaysia. The GM mosquitoes being used in these field experiments are Aedes aegypti OX513A produced by Oxitec.
15
2. DEER MODEL
The in-house simulation model DEER for mosquitoes is developed based upon adaptation of the concepts contained in the mathematical model (1) – (6) for SIT proposed by Esteva and Yang [8]. The mosquito population is divided into six compartments A, Fs, Ff, Fu, M and MT (Figure 1). The compartment A consists of
immature aquatic form of the mosquito. The adult wing female mosquitoes are divided into three compartments, while the males are divided into two compartments, as required by the concept of SIT. One compartment consists of unmated single females, which is denoted by Fs. Some of these single unmated females remain
unmated and therefore remain in Fs, while the remaining singles are mated. The
mated females are further divided into two compartments. Those that are fertilized are moved into compartment denoted by Ff, while the unfertilized females are moved
to the compartment Fu.
The male mosquitoes are divided into two compartments in order to facilitate modeling the competition between the wild and GM male mosquitoes. Natural male mosquitoes form members of the compartment denoted by M. Finally, the GM male mosquito is grouped into compartment denoted by MT. This set of compartment
notations will be used in this paper. For example, the per capita mortality rates of the immature aquatic form, unmated single females, mated fertilized females, mated unfertilized females, natural male and GM male mosquitoes are denoted by A, s, f,
u, M and T, respectively. Other rate constants in this model include the
development rate of aquatic forms , the mating rate of natural mosquito , the number of winged GM males released per day , the oviposition rate of winged fertilized females , the carrying capacity of aquatic forms C, the proportion of aquatic forms that becomes winged females r, the proportion of winged GM males that are released in adequate places p and the proportion of effective mating rate of winged GM males q. The parameter T = pq represents the mating rate of winged
16
Figure 1: Compartments in DEER model for GM mosquitoes
A F C A dt dA A
f ( )
1
(1)
s s T s T T T s s F M M F M M M MF A r dt
dF
(2) f f T s f F M M MF dt dF (3) u u T s T T u F M M F M dt
dF
(4)
M A r dt dM M
(1 ) (5)
T T
T M
dt
dM
(6)
Table 1: Parameter values used for simulation study [8]
A s f u M T
0.05 0.05 0.05 0.05 0.1 0.1
r C pq
5.0 0.075 0.5 1.0 600 0.7
A
F
fF
uM
M
F
s
1r
17
3. RESULTS AND DISCUSSION
3.1 Isolated Release Site
We first consider the case in which the release site is assumed to be completely isolated from its neighbors, with no possibility of wild mosquito recruits coming from neighborhood regions. This scenario is unlikely to prevail. This model scenario represents the most optimal situation for the local success of GM experiments. We consider a one-off release of GM male mosquitoes at simulation time with peak mosquito population. Various one-off release proportions (MT/F) in increasing order
of 1, 10, 100 and 1000 are considered to facilitate the assessment of impact of larger amount of GM release. The proportion MT/F represents the ratio of the GM male
mosquito population to the present total population of female mosquitoes in the simulation site. For example, the proportion MT/F = 1 indicates that the population of
GM males released is equal to the present total population of female mosquitoes; while MT/F = 10 indicates that the population of GM males released is ten times the
present total population of female mosquitoes. We use the number of aquatic forms scaled to the carrying capacity as a measure of mosquito population.
Figure 2 shows the simulated proportion of aquatic form to its carrying capacity (denoted by A/C). Simulation results indicate that a large one-off release of GM male mosquitoes (of the order of hundreds times the present female mosquito population) will quickly decrease the number of aquatic forms. This is so because most of the aquatic offspring come from female mosquitoes that have mated with GM male mosquitoes, and these will die during the aquatic phase before they can develop into mature form. Hence, the adult form will be decimated. However, without continuous release of GM male mosquitoes after the one-off release, the GM male mosquitoes released into the wild will eventually die. The residual wild mosquito population in the enclosed site will then recover to their normal population levels in the absence of GM males. Of course the time taken to recover to the natural wild population level varies with the one-off release rates. The higher the one-off release rates, the longer will be the time taken to recover to the wild natural state, as higher one-off release rates would decimate the wild population further.
18
Figure 2: Proportion A/C subject to various one-off release at time t = 10 days
Figure 3: Proportion A/C subject to various continuous release rate
3.2 Natural Release Site
19
Figure 4 demonstrates the scaled female mosquito population distributed over the distance of 10 km, at five increasing time steps t1 to t5. At each location, the population increases with time, until it reaches the steady state at t5. Further, at steady state, the female population gradually decreases near to the computational boundaries, where the conditions are not favorable to mosquitoes. To eradicate the wild mosquito population in this habitat, GM male mosquitoes are released continuously at the location X = 5 km at the rate of 0.75 MT/F/day. Figure 5 depicts
the spatial distribution of GM male mosquitoes at steady state condition, indicating rapid decrease of GM male population away from the release site.
Figure 4: Spatial distribution over time of female mosquitoes in the absence of GM males
Figure 5: Spatial distribution of GM males with a continuous release (0.75
MT/F/day) at X = 5 km
20
the release site, the wild populations are hardly affected. The population levels would depend on several key parameters involved in the population dynamics. Yet these key parameters are not accurately known. These simulation results would indicate that the strategy of GM male release to control natural mosquito population is not sustainable in the long run.
Figure 6: Spatial distribution over time of female mosquitoes subject to continuous release of GM males (0.75 MT/F/day) at X = 5 km
4. CONCLUSION
In summary, the proposed GM mosquito release program is not a viable strategy to eradicate natural A. aegypti mosquitoes. Significant reduction of wild mosquito population is possible only if large over-flooding ratios are applied. Further, repeated releases must be maintained over an infinite time horizon to continue to sustain low wild mosquito population. Major difficulty remains to be resolved. In particular, in-depth cost-benefit analysis on this control program is essential to ensure long-term institutional support.
Acknowledgement
21
REFERENCES
[1] Dyck, V., Hendrichs J. and Robinson, A., eds. (2005). Sterile insect technique: principles and practice in area-wide integrated pest management. Dordrecht, Springer
[2] Knipling, E. (1955). Possibilities of insect control or eradication through use of sexually sterile males. Journal of Economic Entomology 48, 459-462
[3] Benedict, M.Q. and Robinson, A.S. (2003). The first releases of transgenic mosquitoes: an argument for the sterile insect technique. Trends in Parasitology 19, 349-355. PMID:12901936 doi:10.1016/S1471-4922(03)00144-2.
[4] Klassen W. and Curtis C. (2005). History of the sterile insect technique, In: Dyck V, Hendrichs J, Robinson A, eds. Sterile insect technique: principles and practice in area-wide integrated pest management. Dordrecht, Springer 3-36.
[5] CAP (2010). Memorandum-Malaysia’s GM Aedes mosquito planned release: ethical, legal and human rights concerns. Consumers’ Association of Penang, 59 p.
[6] Koh, H.L., Teh, S.Y., DeAngelis, D.L. and Jiang, J. (2011). Infectious diseases: surveillance, genetic modification and simulation. In: Disaster Management and Human Health Risk Proceedings of the Disaster Management II.
[7] WHO/TDR (2010). Progress and prospects for the use of genetically-modified mosquitoes to inhibit disease transmission. Report on planning meeting 1: Technical consultation on current status and planning for future development of genetically-modified mosquitoes for malaria and dengue control, 4-6 May 2009, Geneva, Switzerland. WHO/TDR publications10.2471/TDR.10.978-924-1599238. ISBN 978-92-4-159923-8.
[8] Esteva, L. and Yang, H.M. (2005). Mathematical model to assess the control of Aedes aegypti mosquitoes by the sterile insect technique. Mathematical Biosciences 198, 132-147.
23
Kenaf Core Particleboard and Its
Sound Absorbing Properties
Mohamad Jani Saad1,* and Izran Kamal2
1Rice and Industrial Crops Research Center, Malaysian Agriculture Research and Development Institute (MARDI) 43400 Serdang, Selangor Darul Ehsan 2Advanced Processing and Design Programme, Forest Research Institute Malaysia
(FRIM), 52109 Kepong, Selangor Darul Ehsan
*Corresponding email: [email protected]
Abstract
In this study, kenaf (Hibiscus cannabinus) core particleboards as insulation boards were manufactured. The boards were fabricated with three different densities i.e. 350 kg/m3, 450 kg/m3 and 550 kg/m3 at urea formaldehyde resin (UF) loadings of 8%, 10% and 12% (w/w) based on the dry weight of the kenaf core particles. The fabricated boards were evaluated for its noise acoustical coefficients (NAC) by following the ASTM E1050-98 standard requirements. The study revealed that boards with higher kenaf fiber loading and UF loading gave less NAC.
24
1. INTRODUCTION
In recent years, natural fibers are increasingly being used in many products such as biocomposite products, automotive lining components as well as acoustic abruption barriers. In Malaysia, there is plenty of agricultural waste like coconut trunk (Cocos nucifera), rice straw and husk (Oryza sativa) and oil palm trunk and empty fruit bunch (Elaies guineensis). Researches have revealed that actually these wastes are not really wastes because they can become sources of natural fibers. The natural fibers obtained from the wastes can be modified into useful products with technologies. There are a lot of advantages possessed by natural fibers such as: renewable, non-abrasive, cheaper, abundance and less health and safety concern during handling and processing [1, 2]. The findings have evoked a mindset that everything that we thought wastes are actually useful and should not be thrown away just like that. We just have to find ways to modify them to something more useful.
Researches to find alternative materials to be utilized in the making of acoustical panel especially in the reduction of noise level have been extensively conducted. The common acoustical panels are made from synthetic fibers such as glass fiber and known to be hazardous to our health as well as to the environment. Fabrication of products from the material is also quite expensive and costly. Due to that, more attention has been given to natural fibers as alternative materials in order to produce products with a combination of high acoustic and thermal properties but with less impact to the environment and human health. Natural fibers are chosen to be alternative materials because they have very low toxicity which is good to protect the environment [3].
Previous researches have confirmed that there are some natural fibers which have high potential to be applied as alternative materials of sound absorbing materials. Paddy straw was reported suitable for acoustic panel because of its high elasticity and porosity [4, 5]. A single layer acoustical panel from paddy husk reinforced with sodium silicate showed that the optimum sound absorption coefficient happened at higher silicate content under high range frequencies [6]. Coconut coir has shown good sound absorption under higher frequencies but inferior performance was observed under lower frequencies. An oil palm fibre has showed the high noise absorption due to its higher density [2, 7].
25
as the two types of fibers it has i.e. bast (outer part) and core (inner part) which can be utilized as raw materials for the production of paper products, building materials, absorbents, textiles and livestock feed [10]. Kenaf is able to reach a height of 3 to 5 m within a period of 3 to 5 months, depending on the environment condition of the place it is planted. Kenaf is able to supply between 12 and 25 t/ha of biomass annually, when it is planted under warm and wet conditions [10].
The kenaf core is light and porous, having a bulk density of 0.10-0.20 g/cm3. It can be crushed into light-weight particles. Currently, kenaf core has received less attention compared to bast in paper and bio composite industries, even though numbers of researches have revealed that kenaf core is useful to produce insulation composites [10, 11], medium-density particleboards [12, 13], fire retardant-treated particleboards [12,13,16], polymer composite [21], thermo-acoustic applications and sound barriers (17-18).
Until now, urea formaldehyde resin (UF) remains as one of the most popular resins in composites industry despite the introduction of many advanced resins. The advantages that this conventional resin possesses are low cost, ease of use under a wide variety of curing conditions, low cure temperature, water solubility, and resistance to microorganisms and to abrasion, hardness, and excellent thermal properties (19).
In this study, kenaf core was used because it is low density and has absorbency advantage. The kenaf core was used to produce kenaf core particleboards. The particleboards then were tested for their acoustical property (the sound absorption coefficients) with regards to different resin content to fabricate the particleboards.
2. MATERIALS AND METHODS
2.1 Materials
Four-month old kenaf were harvested at the Kenaf Research Plot of MARDI Serdang, Selangor, Malaysia. Only kenaf stalks of the harvested kenaf were brought to the workshop for further processing. The kenaf core fibers were separated from the bast fibres using a decorticating machine. The separated kenaf core is in chip form. Then the kenaf core chips were flaked to a particle size of between 2-3 mm using Pallmann PHT 120/430 knife ring flaker. The particles were then dried in an oven at a temperature of 700C for two days to achieve 5% moisture content (MC).
26
hardener and 1% (wt) of wax to prevent the produced composites from absorbing moisture excessively from the surrounding.
2.2 Sample Preparation
The kenaf core particles were mixed with the resin using a blender machine. Three percentages of resin loadings were used to mix with the particles separately i.e. 8%, 10% and 12%. Each of the resin loading was based on the oven dry weight of the kenaf core particles. The targeted board densities were 350 kg/m3, 450 kg/m3 and 550 kg/m3. The particles and the resin were mixed approximately in the blender for 5 min to ensure that the particles are evenly mixed with the resin.
After the mixing process, the kenaf particles were brought out from the mixer and were scattered in a rectangular-shaped former with a dimension of 340 x 340 mm, which was first placed on a caul plate covered with a teflon fiber sheet. The furnish ( kenaf particles + resin) was pre-pressed in the cold press at a pressure of 35 kg/cm2 and subsequently pressed in the hot press machine model Taihei to 12 mm thickness at a temperature of 1700C for 6 min. And then, the particleboards were exposed to the surrounding to reduce the temperature of the pressed particleboard and encourage the resin to cure.
Two different diameters in a circle shape were cut from kenaf particleboard and used to cover the full frequency range. Sample with 100 mm diameter was used to measure the frequency range from 125-1600 Hz and 28 mm diameter was used to measure the frequency range of 1200-6000 Hz.
Figure 1: The circle shape of kenaf particleboard for NAC test
2.3 Testing procedures
27
To determine the acoustical property of the composites, the sound absorption coefficients were determined by the impedance tube method in accordance with ASTM E1050-98. The test was done by placing a loudspeaker at one end of an impedance tube and the other end of the tube was placed with the testing sample. The loudspeaker generates broadband, stationary random sound waves. The sound waves propagate within the tube strike between the sample and the sound source and they are reflected as standing wave interference pattern on the computer screen. The acoustic absorption coefficient (α) is defined as the ratio of the acoustic energy absorbed by the PB (Iincident – Ireflected) to the acoustic energy incident (Iincident) on the surface and it depends on the frequency range. The frequency range for testing was 125 – 6000 Hz. The equipment used for the test was as in Figure 1.
Figure 2: The impedance tube gadget for acoustic analysis
3. RESULT AND DISCUSSION
3.1 Effects of Resin Loading
28
0
0.1
0.2
0.3
0.4
0.5
0.6
0.7
Noi
se Absorpt
ion
Cooeficient (NAC)
U550-8
U550-10
U550-12
Figure 3: Sound Absorption Coefficient versus Frequency of Kenaf Core Particleboard at a Density of 550 kg/m3 with different UF loading
0
0.1
0.2
0.3
0.4
0.5
0.6
0.7
Noise Absorption
Cooeficient (NAC)
U450-8
U450-10
U450-12
Figure 4: Sound Absorption Coefficient versus Frequency of Kenaf Core Particleboard at Density of 450 kg/m3and Variable UF loading
0
0.1
0.2
0.3
0.4
0.5
0.6
0.7
Noise Absorpt
ion
Coo
eficient (
NAC)
U350-8
U350-10
U350-12
29
UF loading at 8% showed the best NAC (0.41) compared to the other UF loading at the frequency of 2000 Hz. As for UF loading at 12%, the maximum mean NAC value (0.63) was reached at the frequency of 3000 Hz. Meanwhile, for 4000 Hz frequency, only boards fabricated with 10% UF loading were able to reach the highest mean NAC value (0.23-0.36). There was no mean NAC values recorded for all boards when the frequency was increased from 5000 to 6000 Hz.
Figure 4 demonstrated that the higher UF loading at 12% exhibited the higher NAC (0.1-0.2) in the lower frequency compared to the other UF loadings but then it became constant in the NAC range of 0.2-0.24 in the medium frequency (1000 Hz – 2000 Hz). Meanwhile, UF loading at 8% showed the optimum NAC (0.66) at the 3000 Hz and the mean NAC value remained high (0.29-0.37) at 4000 Hz until 6000 Hz.
There were same values revealed in the low frequency among the three UF loadings as in Figure 5. In the medium and high frequencies which are 2000 Hz until 6000 Hz, UF 10% gave the highest mean NAC value followed by UF 8% and UF 12%.
Kenaf fiber tested with NAC test was found to increase its NAC value from the low frequency (100 Hz – 800 Hz) until it reached the optimum NAC of 0.91 in the frequency range of 1000 Hz – 1600 Hz and later its NAC decreased and maintained around 0.83-0.84 in the range of 2000 Hz – 5000 Hz [3].
3.2 Effects of Kenaf Loading
The effects of kenaf core loading to the NAC value are presented in Figure 6, 7 and 8. Generally, Figure 6 (all boards manufactured with 8% UF loading) have exhibited that boards with the lower kenaf loading are the best noise absorbers. Both low and high frequencies have demonstrated that kenaf boards at 350 kg/m3 density was having the best mean NAC value compared to kenaf boards with densities at 450 kg/m3 or 550 kg/m3. Similar trend was observed in Figure 7 and 8 for boards of 10% and 12% UF loading, respectively.
30
0.1
0.2
0.3
0.4
0.5
0.6
0.7
Noi
se Absorpt
ion
Cooeficient (N
AC)
U550-8
U450-8
U350-8
Figure 6: Sound Absorption Coefficient versus Frequency of Kenaf Core Particleboard at UF Loading of 8% and Variable Board Density
0.1
0.2
0.3
0.4
0.5
0.6
0.7
N
ois
e Abs
orption
C
oeeficient (NAC)
U550-10
U450-10
U350-10
Figure 7: Sound Absorption Coefficient versus Frequency of Kenaf Core Particleboard at UF Loading of 10% and Variable Board Density
0.05
0.1
0.15
0.2
0.25
0.3
0.35
N
ois
e A
bs
orption
C
oeeficien
t (N
A
C
)
U550-12
U450-12
U350-12
31
Fiberboard, particleboard and plywood have shown a decrease of NAC value as the frequency increased due to their specific characteristic of absorbing sound in the low frequency range but reflecting sound in the middle and high frequency ranges [20].
Commercial insulation materials are made of glass fiber, glass foam and others toxic materials which are noxious to human beings and cause environmental problem. Kenaf core PB can solve this problem. It was not noxious, product that can be renewable and biodegradable.
Sound absorption coefficient of rice straw – wood particle composite boards are higher than other wood – based materials in the 500-8000 Hz frequency range, which is caused by the low specific gravity of composite boards, which are more porous than other wood – based materials [20].
4. CONCLUSIONS
This study shows by using the impedance tube test method to determine noise absorption coefficients of kenaf core particleboards have been successfully carried out. Influence of UF adhesive and the kenaf content were detected on the boards. Results show the NAC of board containing of 8% and 10% are found the best noise absorber rather than 12% UF loading. It was found in the low, medium or even in the high noise frequencies. Board at the 350 kg/m3 density absorbed more noise might be due to its better porosity behavior which able to reduce noise interference
REFERENCES
[1] Abdul Razak, M.A., Khoo, K.C., and Khozirah, S. 1988. Prospects and Potential Of The Oil Palm Trunk as a Source Of Lignocellulosic Raw Material, The Malayan Forester, Vol 51(3):164-175.
[2] Zulkifli, R., Mohd Nor, M.J., Ismail, A.R., Nuawi, M.Z., Abdullah, S., Mat Tahir, M.F., Ab Rahman, M.N.2009. Comparison properties between coir fibre and oil palm fibre. European Journal of Scientific Research. Vol. 33, No 1, pp 144-152.
32
[4] Christina E., Mediastika. 2007. Potential of Paddy Straw as Material Raw of Acoustic Panel. Architecture Dimension, Vol 35, No 2. Pp 183-189.
[5] Christina E., Mediastika. 2008. Paddy Straw as Walling Panel. Architecture Dimension, Vol 36, No 1. Pp 20-27.
[6] Fahmi, R. 2006. Develop single layer acoustic sample made of paddy husk and normal absorption characteristics. Institut Teknologi Bandung: Undergraduate Theses.
[7] Zulkifli R., et al. 2009. Effect of perforated size and air gap thickness on acoustic properties of coir fiber sound absorption. European Journal of Scientific Research. Vol. 28, No 1, pp 242-252.
[8] Xue, Y., Du,Y., Elder, S., Devin, S., Horstemeyer, M., and Zhang, J. 2007.
Statistical Tensile Properties of Kenaf Fibres and Its Composites, 9th International Conference on Wood & Biofiber Plastic Composite, 22 May 2007, Mississippi State University, Available online: http://www.forestprod.org/woodfiber07xue.pdf.
[9] Charles, L.W., Venita, K.B., and Robert, E.B., 2002. Kenaf harvesting and processing. ASHS Press, Alexandria, VA.
[10] Charles, W., and Bledsoe, V.K., 2001. Kenaf yield components and plant composition. National symposium on new crops and new uses.Sunnyville ave, USA.
[11] Sheikkariem, A.R. 2000. Properties of particle-based panels from kenaf, wood, and sugarcane residues bonded with modified adhesive systems. M.S. dissertation, P: 10-41. Lousiana State University library, Baton Rouge, LA.
[12] Charles, W., R. Charles, B. Robert and B. Judy. 1998. Production properties
of industrial Grade kenafparticleboard.http://www.nal.usda.gov/ttic/tektran/data/000009/15/0000
091567.html.
[13] Grogoriou, A., C. Passialis and E. Voulgaridis. 2000. Experimental particleboard from kenaf plantations grown in Greece. Holz als Roh-und Werkstoff, 58: 309-314.
[14] Izran, K., Zaidon,A., Abdul Rashid, A.M., Abood, F., Mohamad Jani, S., 2009a. Fire Propagation and Strength Performance of Fire Retardant-Treated
33
[15] Izran, K. Abdul Rashid, A.M.,Mohd Nor, M.Y., Khairul, M., Zaidon, A. and Abood, F. 2009b. Physical and Mechanical Properties of Flame Retardant-Treated Hibiscus cannabinus Particleboard, Journal of Modern Applied Science 3(8):1-8.
[16] Izran, K., Zaidon, A., Abdul Rashid, A.M., Abood,F., Mohd. Nor, M.Y., Nor Yuziah, M.Y., MohdZharif, A.T and Khairul, M. 2009c. Potential of Flame Retardant-Treated Hibiscus cannabinus Particleboard as Furniture Input, poster presented at Seminar on Wooden Furniture Industry, Forest Research Institute Malaysia.
[17] Xu, J., Sugawara, R., Widyorini, R., Han, G., Kawai, S. 2009. Manufacture and properties of low density binder less particleboard from kenaf core. Journal of Wood Science. Vol 50: 62-67.Tormos, D.R., Romina, Fernandes, A. R., Vicente, S.J. 2007. Proposal an empirical model for absorbent acoustical materials based in kenaf. 19th International congress on acoustics. Madrid, Spain.
[18] Anthony, H.C., 1996 Urea formaldehyde adhesives resins. Forest Product Laboratory,USDA Forest Service.
35
Numerical Solution of Mixed
Convection Flow about a Sphere in a
Porous Medium Saturated by a
Nanofluid: Brinkman Model
Leony Tham1, Roslinda Nazar2,*1 Faculty of Agro Industry and Natural Resources, Universiti Malaysia Kelantan, 16100 Pengkalan Chepa, Kota Bharu, Kelantan, Malaysia
2School of Mathematical Sciences, Faculty of Science & Technology, Universiti Kebangsaan Malaysia, 43600 UKM Bangi, Selangor, Malaysia
*Corresponding e-mail: [email protected]
Abstract
In the present study, the steady mixed convection boundary layer flow about a solid sphere with a constant surface temperature and embedded in a porous medium saturated by a nanofluid has been investigated via the Brinkman model for both the assisting and opposing flow cases. The resulting system of nonlinear boundary layer equations in the form of partial differential equations is solved numerically using an implicit finite-difference scheme known as the Keller-box method. Numerical results are obtained and discussed for the skin friction coefficient, local Nusselt number, local Sherwood number, velocity profiles, temperature profiles and nanoparticle volume fraction profiles. These results are presented for different values of the governing parameters, namely the mixed convection parameter and the Darcy-Brinkman parameter. It is found that the boundary layer separates from the sphere for some negative values of the mixed convection parameter (opposing flow). Increasing the mixed convection parameter delays the boundary layer separation and the separation can be completely suppressed for sufficiently large values of the mixed convection parameter.
36
1. INTRODUCTION
The “nanofluid” term was defined as the dilution of nanometer-sized particles (smaller than 100nm) in a fluid such as water, ethylene glycol and oil [1]. According to Khanafer et al., as the diluted nanoparticles size is extremely small, they can easily flow smoothly through the microchannels, and could improve the thermal conductivity and convective heat transfer coefficient compared to the base fluid only, and as such, nanofluids are widely used as coolants, lubricants and heat exchangers [2]. The utility of a particular nanofluid as a heat transfer medium can be established by modelling the convective transport in such nanofluid [3]. Meanwhile, Buongiorno and Hu considered a study on the convective transport in nanofluids and concluded that turbulence is not affected by the presence of the nanoparticles [4]. A comprehensive study on the nanofluids characteristics had also been well documented by Das et al. [5].
Convective heat transfer in porous medium is important in thermal engineering applications, such as geophysical thermal and insulation engineering, chemical catalytic reactors, ceramic processes, fiber and granular insulations and petroleum reservoirs. Many studies have been performed by Nield and Bejan [6] and Ingham and Pop [7], which focused on the free and mixed convection in porous media based on Darcy’s law and Forschheimer’s law, an extended Darcy’s law models. However, as Darcy’s law neglected the viscous force involved in convection heat transfer, and is only valid for slow viscous flow, that is with Reynolds number less than 1 cases, as such, Brinkman [8] introduced another Darcy’s extended law, the Brinkman model, which suggested that the momentum equation for a porous medium flow with a high permeability must be reduced to the viscous flow limit and advocated that classical frictional term to be included in the Darcy’s law. Further, the Brinkman model for the forced convection over an impermeable heated plate embedded in a porous medium was studied by Vafai and Tien [9] and they pointed that the viscous effect on the surface and the bulk viscous forces are equally important. Nazar et al. [10] considered the Brinkman model for the mixed convection boundary layer flow from a horizontal circular cylinder embedded in a fluid-saturated porous medium, and concluded that the results for the Brinkman model differed significantly than the results for Darcy’s law model, and the increased of the Darcy-Brinkman parameter led to the decreased of the surface heat transfer and the skin friction coefficient.
37
2. ANALYSIS
Consider the steady mixed convection boundary layer flow about an impermeable solid sphere of radius a embedded in a porous medium filled with a nanofluid. It is assumed that the constant surface temperature of the sphere is Tw, while the constant
ambient temperature is T∞, where Tw> T∞ for a heated sphere (assisting flow) and Tw
< T∞ for a cooled sphere (opposing flow). It is also assumed that the velocity of the external flow (inviscisd flow) or the local free stream velocity is Ue(x), where x is the
coordinate measured along the surface of the sphere starting from the lower stagnation point. It is assumed that the nanoparticles are suspended in the nanofluid using either surfactant or surface charge technology. We consider a porous medium whose porosity is denoted by φ and permeability by K. Under these assumptions along with the Oberbeck-Boussinesq approximation and the basic equations for the steady flow, we obtain the following boundary layer equations for the problem under consideration in dimensionless[12] form:
( ) ( ) 0, ru rv x y
(1)
3
3 sin ,
u u
Nr x
y y y y
(2)
2 2
2 ,
u v Nb Nt
x y y y y y
(3)
2 2
2 2 ,
Nt
Le u v
x y y Nb y
(4)
with the boundary conditions
0, 0, 1, 1 at 0,
( ), 0, 0 as ,
e
v u y
u u x y
(5)
where we assume that ue(x) = (3/2)sin x. Here and are the dimensionless
temperature and nanoparticle volume fraction, respectively, r(x) is the radial distance from the symmetrical axis to the surface of the sphere, Γ is the Darcy-Brinkman parameter, Le is the Lewis number, λ is the mixed convection parameter, Nr is the buoyancy ratio parameter, Nb is the Brownian motion parameter and Nt is the thermophoresis parameter, which are defined as
( )( )
, , , ,
( ) (1 )
( ) ( ) ( ) ( )
, ,
( ) ( )
p f w
m
f B f w
p B w p T w
f m f m
C C
Ra
Da Pe Le Nr
D Pe T T C
c D C C c D T T
Nb Nt
c c T
38
with f / , Da = K/a2 and Ra = (1-C∞)gKβ(Tw-T∞)a/(νf αm) being the porosity,
the Darcy and the modified Rayleigh numbers for the porous medium, respectively, and νf is the kinematic viscosity of the fluid. It is worth mentioning that λ > 0 is for
the assisting flow (Tw > T∞), λ < 0 for the opposing flow (Tw < T∞) and λ = 0 corresponds to the forced convection flow.
Integrating equation (2) with the boundary conditions (5) at y → ∞, introducing the stream function ψ, which is defined such that u / y and
v / x , and introducing the variables x r x f x y( ) ( , ), ( , ), ( , ), x y x y
we obtain 3 3 3 sin ( ) , 2
f f x
Nr
y y x
(7)
2 2
2 ,
f f
f Nb Nt x
y y y y y y x x y
(8)
2 2
2 2 ,
Nt f f
Le f Le x
y y Nb y y x x y
(9)
with the boundary conditions
0, / 0, 1, 1 at 0,
/ (3 / 2) sin / , 0, 0 as .
f f y y
f y x x y
(10)
It is worth mentioning that when Nr,Nb and Nt are all zero, equations (8) and (9) involve just two dependent variables, namely f and , and the boundary-value problem for these two variables reduces to the corresponding problem of the mixed convection boundary layer flow about a sphere embedded in a fluid-saturated porous medium using the Darcy-Brinkman model (The boundary value problem for then becomes ill-posed and is of no physical significance).
Quantities of practical interest are the skin friction coefficient Cf , the local Nusselt number Nu and the local Sherwood number Sh, which are defined as
2
C , , ,
( ) ( )
w w m
f
m w B w
a q a q
Nu Sh
U k T T D C C
(11)
where , ,w qw and qm are the wall shear stress, the wall heat flux and the mass heat flux from the surface of the sphere, respectively, which are given by
0 0 0
, , ,
w f w m m B
y y y
u T C
q k q D
y y y
(12)
39
2
1/2 1/2 1/2
2
(PrPe )Cf x f ( ,0),x Pe Nu ( ,0), x Pe Sh ( ,0),x
y y y
(13) where Pr f / m is the Prandtl number for the porous medium.
3. RESULTS AND DISCUSSION
Equations (7) to (9) subject to the boundary conditions (10) have been solved numerically for different values of the parameters , Le and , and at some streamwise positions x, using an efficient implicit finite-difference scheme known as the Keller-box method along with the Newton’s linearization technique as described by Cebeci and Bradshaw [13] for both the assisting (0) and opposing (0) flow cases. The skin friction coefficient ( Pr 1/ 2)
f
Pe C , the local Nusselt number
1/ 2
Pe Nu, the local Sherwood number 1/ 2
Pe Sh, the velocity profiles f y( ), the temperature profiles ( )y , and the nanoparticles volume fraction profiles ( )y , have been obtained for the following range of parameters: mixed convection parameter,
1
(assisting flow), Daryc-Brinkman parameter, Lewis number, Le2, 6 and
10, Brownian number, Nb0.5, buoyancy ratio parameter, Nr0.5, and thermophoresis parameter, Nt0.5, at different positions x. It seems that the values of the parameters considered usually exist in geophysical and engineering applications [14].
Some values of the skin friction coefficient, 1/2
( PrPe )Cf, the local Nusselt number, Pe1/ 2Nu, the local Sherwood number Pe1/ 2Sh, are given in Tables 1 to 3
for some values of Le2, 0.1, Nb0.5, Nr0.5, Nt0.5 and various values
of . These tables show that the boundary layer separates from the sphere for some values of 0 (opposing flow). Increasing delays separation and the separation can be completely suppressed in the range 0 x 120o
for sufficiently large values of . A value of 0( 0) is found below which the boundary layer solution is not
possible. The actual value of s( 0) which first gives no separation is difficult to determine exactly as it has to be found by successive integration of the equations. However, the numerical solutions indicate that the value of s which first gives no separation lies between 2.99 and 3.
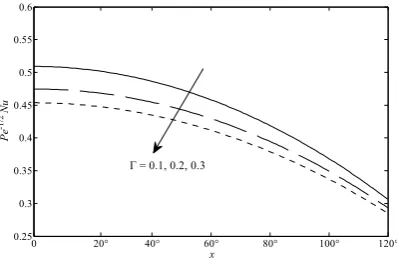
Our objective is to observe the influence of the parameters and Le on the heat, mass and fluid flow characteristics, and thus we will present the results in figure forms for the above parameters effect. Figures 1 and 2 show the variations of the skin friction coefficient, ( Pr 1/2)
f