Radially Distributed Instabilities and Nonlinear Process to
Generate Pressure Variation in a Torus Plasma
Naohiro KASUYA and Masatoshi YAGI
1)Research Institute for Applied Mechanics, Kyushu University, 6-1 Kasuga-kouen, Kasuga, Fukuoka 816-8580, Japan
1)National Institute for Quantum and Radiological Science and Technology, 2-166 Omotedate, Obuchi, Rokkasho, Aomori
039-3212, Japan
(Received 14 May 2016/Accepted 17 January 2017)
Distributed instabilities can successively change one after another to give accelerated radial propagation. The response of the linearly unstable distributed instabilities is identified in a gradual evolution phase as well as in a phase just after impact of modulation. Global nonlinear simulations of drift-interchange modes in helical plasmas are carried out with source modulation using a reduced MHD model. Conditional average of long time-series data with the modulation period reveals characteristic responses of the plasma. Smaller-scale variations comparable to the micro-temporal scale in this simulation are also included in the gradual evolution phase. The correlation analysis shows that the evolution of the mean pressure is strongly correlated with the strength of the nonlinear coupling. The evaluation of the energy balance to decompose the energy transfer into contribution from each three-wave coupling clarifies that a single mode coupling at each location has the dominant contribution to the smaller-scale pressure evolution in spite of self-organized mechanism with a wide range of comparable magnitude modes. Comparison of mode amplitudes does not define the dominant one, so identification of the active mode is useful for understanding the causality. This selection suggests the mechanism that gives the spreading effective in the quasi-steady state as for the ballistic propagation in the self-organized critical state.
c
2017 The Japan Society of Plasma Science and Nuclear Fusion Research
Keywords: turbulence spreading, self-organization, global simulation, nonlinear coupling, energy transfer, source modulation, torus plasma
DOI: 10.1585/pfr.12.1303005
It is widely recognized that simple diffusive mod-els are not adequate to describe the transport phenomena in torus plasmas [1]. To capture the nature of the trans-port, there are several experiments to observe plasma non-diffusive responses [2–4]. In particular, the modulation experiments in the Large Helical Device (LHD) have re-vealed several unresolved problems, such as a hysteresis in the dependencies of turbulence and transport on the mean pressure gradient [4], and abrupt increase of core temperature associated with edge cooling [5]. A long-range fluctuation with a scale size comparable to the minor radius is observed in the modulation experiment, whose origin is not yet clarified [6]. We have investigated the dynamics of the global pressure profile by use of an ex-tended reduced MHD model in helical plasmas to study the transport mechanisms, and have observed propagation, responding to the core heat modulation [7]. The turbulent spreading is known as the successive response of radially distributed micro-instabilities to give accelerated propaga-tion [8–10]. The successive responses of localized modes to large perturbations have been revealed, however, non-linear mechanism exists to sustain the self-organized crit-ical level [11, 12]. Therefore, the role of the modes in the saturated state must be clarified, i.e., whether the lead-author’s e-mail: [email protected]
ing marginally unstable mode at each location can act as a leader by overcoming the extinguishment by the non-linear sustainment in the saturated state. For that pur-pose, combination of the turbulence simulation and statis-tical analysis (conditional averaging [4]) is used. Fluctu-ations include random evolutions, and conditional averag-ing is applied to eliminate the randomness and extract the characteristic plasma response. Repetitive modulation of a pressure source term is used as the trigger for the con-ditional averaging. In this article, a response mechanism of the mean pressure (poloidally and toroidally homoge-nous component with temporal variation) is investigated by evaluating the energy balance in the nonlinear global simulation. Drift-interchange instability is calculated in a helical plasma, which is localized near the rational surface withk⊥a <100, whereais the minor radius, and also in-cludes drift wave properties. Mode coupling process simi-lar to drift wave turbulence can be considered in spite of its larger spatial scale. Not only the rapid response to impact of the source change as in [7] but also the whole period of the modulation is analyzed, which reveals that the lead-ing modes plays the role for leadlead-ing the pressure temporal variation, though there exist several modes that have the same level of nonlinear energy transfer. Note that what we analyze is the response to the modulation, so some typical
c
2017 The Japan Society of Plasma
variations remain after the averaging (not everything are smoothed out). The selection of the leading nonlinear cou-pling with the micro-scale evolution can be an important indicator to describe the variation with sustainment of the self-organized state.
For dynamical simulations, a simulation code has been developed to calculate the electromagnetic nonlinear saturation in toroidal helical plasmas with a circular cross-section [13]. Toroidal coordinate (r, θ, ζ) is used, where the position atr = 0 represents the center of the circular cross-section. A set of reduced MHD equations of drift-interchange instability is solved to obtain time evolutions of 3 fields; stream function u, ζ component of the vec-tor potential Aand total pressure P. The reduced MHD model to describe the interchange mode in helical plas-mas [14] is extended to include a drift wave instability by including the diamagnetic terms in the conduction equa-tion [13]. The model is used as the fundamental one in-cluding global and localized modes, nonlinear couplings with the Reynolds stress, and collisional transport pro-cesses, and the details are described in [7]. The instabil-ities can drive heat fluxes to contribute to the pressure vari-ation. The modes are localized at their resonance magnetic surfaces, and the mode width∼0.1ais larger than that of typical micro instabilities in torus plasmas, which can be induced with combination to the drift wave mechanism in a helical plasma. The E×B nonlinear couplings between the radially-distributed instabilities have the common fea-ture in torus plasmas, so we use this as the target to investi-gate the spreading, though there is difference in the spatial scales. Recently turbulence simulations using gyro-kinetic models can show good quantitative agreement to experi-ments for transport in torus plasmas [15–17], but a global simulation for a long-time series with non-adiabatic elec-trons, which is necessary for our research, is still difficult due to its large computational costs in helical plasmas [18], so we use the fluid model in this article.
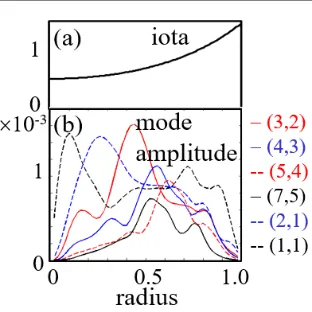
To clarify the dynamical response, source modulation is investigated. Here, the parameter set as same in [7] is used. The magnetic configuration is given by the rotational transformιin helical plasmas, which is the inverse of the safety factor, as in Fig. 1 (a). With this profile the insta-bility driven by the magnetic curvature distributes as in Fig. 1 (b). This represents the mode amplitudes, and the heat flux driven by them is more localized as shown in Fig. 11 in Ref. [7]. The responses of the modes are inves-tigated with source modulation. For the modulation, the additional source is switched on and offcyclically, which exists mainly near the center of the plasma in the region with 0 < r/a < 0.3. The modulation cycle is set to be 1000τA, which is close to the energy confinement time, whereτA=R/VAis the Alfvén time,VAis the Alfvén ve-locity, andRis the major radius. There exist large pres-sure fluctuations, so superposition of source modulation cycles (conditional averaging) is applied to eliminate ran-dom fluctuations. The averaging over 40 cycles is carried
Fig. 1 (a) Rotational transform profile and (b) distribution of the mode amplitudes. Radial profiles of the temporal aver-aged mode amplitudes are shown in (b).
Fig. 2 Response to the modulation. Time evolutions of (a) the applied source amplitude, and (b) the mean pressure gra-dient atr/a =0.6 are shown. The gradient is obtained by the conditional average with the source modulation period. The periods A and B in panel (b) represent the phase with rapid change just after the source modulation and the gradual evolution phase, respectively.
out in this analysis, which is sufficient for convergence [7]. Figures 2 (a)–(b) show the time evolutions of the pressure source at the center, and the mean pressure gradient at
r/a=0.6. At this observation position withr/a>0.5, the direct source change is negligibly small. Both micro-scale (comparable to the transit time by the phase velocity of the mode 50τs∼60τA, whereτsis the ion acoustic transit time) and meso-scale (several times larger than the former) tem-poral evolutions can be extracted from the simulation data. Only the variation with the micro-scale is the target in this article.
To clarify the variation mechanism, the balance of the terms in the model equation is decomposed into each con-tribution. The evolution equation of the internal energy of the (m,n) component is given as
∂EPmn
∂t =
1 2C
dr3Pmn∗
−αC∂∇⊥
2A
∂ζ +αC ∂Ψ0
∂r
∂∇⊥2A
r∂θ +η⊥∇⊥
2P
mn
TE LN1 LN2 LN3
+Smn+
u,P
mn
,
Fig. 3 Time evolution of the energy balance terms in Eq. (1) at
r/a=0.6.
where [ ] is the Poisson bracket,S is the source term,m
andn are the poloidal and toroidal mode-number, andα,
C, Ψ0, η⊥ are defined in [7]. Here, t is normalized by
τA. The 1st, 2nd and 3rd terms in the right hand side of Eq. (1) come from linear contributions by parallel deriva-tive (LN1,LN2) and diffusion (LN3). The 4th term is from the source (ST), which only contains the (m,n) = (0,0) component in this case. The 5th term is the nonlinear con-tribution from convective derivative (NL). We focus on the nonlinearities from the Reynolds stress, and nonlinear terms from the Maxwell stress are not included in the cal-culations, which is known to have little effect in the lowβ case [19, 20]. Figure 3 shows the time evolution of the en-ergy balance of the (m,n)=(0,0) component atr/a=0.6. After the additional source is switched on att = 0, the evolution of the left hand side of Eq. (1) (TE) increases from negative to above zero after a time delay∼40τAfor propagation of the source increase in the plasma central re-gion [7]. The source contribution (ST) is positive, and LN (summation of LN1-3) and NL are negative for the whole of the duration, so ST is the drive for the pressure profile formation, however the temporal variation of ST is much smaller than that of TE. The correlation coefficient be-tween two time-series datapandq
C(p,q)= i
(p(i)−p¯) (q(i)−q¯)
i
(p(i)−p¯)2
i
(q(i)−q¯)2
, (2)
is used for the evaluation, where ¯prepresents the temporal average ofp. The correlation between TE and NL is larger (correlation coefficient 0.8) than that between TE and LN (correlation coefficient 0.0), so the temporal variation is dictated by the nonlinear contribution from NL, which cor-responds to the transport driven by the instabilities to mod-ify the pressure profile. The time evolution indicates that NL and LN are anti-phased with each other, and the corre-lation analysis shows NL is preceding LN withδt =3τA. This is why the pressure variation appears, and the time delay, much smaller than the transit time, corresponds to the duration for adjustment to sustain the saturated level.
The important role of the nonlinear term is confirmed
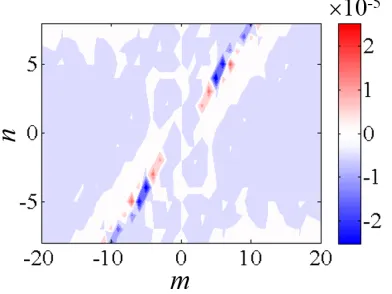
Fig. 4 Nonlinear contribution to theP00component. The
aver-aged contributions NL are decomposed into each (m,n) component atr/a=0.6.
Fig. 5 Time evolution of the nonlinear contribution to theP00
component. (a) Total nonlinear contribution atr/a=0.6 and (b) those of prominent modes in Fig. 4 are shown.
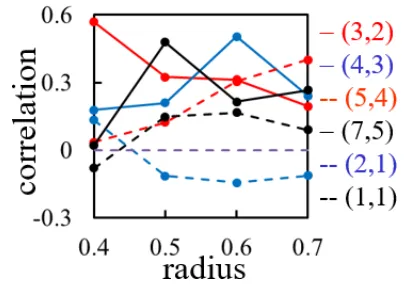
Fig. 6 Radial profiles of the correlations of nonlinear contribu-tions to theP00component. The correlations between the
total contribution and those from individual modes are shown.
modes (the second most correlation coefficient is 0.3 with mode (m,n) =(7,5)). The dominant mode couplings for the smaller-scale evolution are different depending on the radial positions, and is not simply the largest amplitude mode at each position. Figure 6 shows the radial profiles of the correlations. There is a single dominant mode at each position, whose resonant position locates nearby. How-ever, atr/a=0.5, for example, the dominant one is mode (m,n) = (7,5), though the largest amplitude one is mode (m,n) = (3,2). This is because the mode is possible to be driven passively by nonlinear couplings with the other modes. This is similar to the case of the heat flux; there exists a mode that does not drive the heat flux [7].
In summary, global nonlinear simulations of drift-interchange modes in helical plasmas are carried out to clarify the mechanism of the evolution of mean pressure. Conditional average with the modulation period is used to extract the characteristic response of the plasma, and fluc-tuations in the phase gradually approaching to the steady state is also analyzed. The evaluation of the energy bal-ance confirms that nonlinear variation is sustained by a wide range of excited modes. It is found that a single lin-early unstable mode at each location has the dominant con-tribution to the smaller-scale pressure evolution. Linearly unstable modes can induce nonlinear modification of the pressure profile by a modulational process, and the pro-file modification is flattened by the linear diffusion term. There is a time delay of the linear response, so the pro-file modification appears. The time evolution is led by the dominant mode, so identification of the active mode is use-ful for understanding the causality in the evolution. The distributed instability has been known to affect the acceler-ated propagation by the turbulence spreading mechanism, and is found to be effective in a gradual evolution phase as well as in a phase just after a large modulation.
In the simulation there exists another characteristic frequency in the broad band spectrum, which has the longer time-scale than the smaller turbulent time-scale.
The oscillation is induced by coupling with the magnetic curvature term, and also appears in the evolution of the mean pressure. It is possible to act as a nonlinear chan-nel for energy redistribution. The oscillation is electro-magnetic, which accompanies with variation of the posi-tion of a magnetic axis. Change of the magnetic config-uration can affect both neoclassical [21] and turbulent [22] transport in the wide region of the plasma, so the effect should be evaluated. For explanation of experimental re-sults of non-local responses, importance of effects in the phase space is pointed out [23]. The model adopted in this article is a simplified one, and inclusion of such effect by applying a gyro-kinetic model is left for future works.
The authors acknowledge discussions with Prof. K. Itoh, Prof. S.-I. Itoh, and Prof. S. Inagaki. This work is supported by JSPS KAKENHI Grant Number JP24760703 and JP16K06938, by the collaboration pro-gram of NIFS (NIFS15KNST082, NIFS16KNXN323, NIFS13KOCT001) and of RIAM of Kyushu University. Some numerical simulations were carried out on the Helios Super Computer System at Computational Simulation Center of International Fusion Energy Research Center.
[1] K. Idaet al., Nucl. Fusion55, 013022 (2015). [2] K. Gentleet al., Phys. Rev. Lett.74, 3620 (1995). [3] P. Mantica, P. Galli, G. Gorini, G.M.D. Hogeweij, J. de
Kloe, N.J. Lopes Cardozo and RTP Team, Phys. Rev. Lett.
82, 5048 (1999).
[4] S. Inagakiet al., Nucl. Fusion53, 113006 (2013). [5] N. Tamuraet al., Nucl. Fusion47, 449 (2007). [6] S. Inagakiet al., Nucl. Fusion54, 114014 (2014). [7] N. Kasuya, S. Sugita, S. Inagaki, K. Itoh, M. Yagi and S.-I.
Itoh, Plasma Phys. Control. Fusion57, 044010 (2015). [8] T.S. Hahm, P.H. Diamond, Z. Lin, K. Itoh and S.-I. Itoh,
Plasma Phys. Control. Fusion46, A323 (2004).
[9] O.D. Gürcan, P.H. Diamond, T.S. Hahm and Z. Lin, Phys. Plasmas12, 032303 (2005).
[10] X. Garbet, Y. Sarazin, F. Imbeaux, P. Ghendrih, C. Bourdelle, O.D. Gürcan and P.H. Diamond, Phys. Plasmas
14, 122305 (2007).
[11] P.H. Diamond and T.S. Hahm, Plasma Phys. 2, 3640 (1995).
[12] B.A. Carreras, D. Newman, V.E. Lynch and P.H. Diamond, Phys. Plasmas3, 2903 (1996).
[13] N. Kasuya, S. Sugita, M. Sasaki, S. Inagaki, M. Yagi, K. Itoh and S.-I. Itoh, Plasma Fusion Res.8, 2403070 (2013). [14] M. Wakatani, Stellarator and Heliotron Devices(Oxford
University Press, Oxford, 1998).
[15] X. Garbet, Y. Idomura, L. Villard and T.-H. Watanabe, Nucl. Fusion50, 043002 (2010).
[16] M. Nunami, T.-H. Watanabe, H. Sugama and K. Tanaka, Phys. Plasmas19, 042504 (2012).
[17] T. Görler, A.E. White, D. Told, F. Jenko, C. Holland and T.L. Rhodes, Phys. Plasmas21, 122307 (2014).
[18] P. Helander, T. Bird, F. Jenko, R. Kleiber, G.G. Plunk, J.H.E. Proll, J. Riemann and P. Xanthopoulos, Nucl. Fu-sion55, 053030 (2016).
[19] P.H. Diamond, S.-I. Itoh, K. Itoh and T.S. Hahm, Plasma Phys. Control. Fusion47, R35 (2005).
Rasmussen, Phys. Plasmas12, 052515 (2005). [21] S. Murakamiet al., Nucl. Fusion42, L19 (2002).
[22] T.-H. Watanabe, H. Sugama and S. Ferrando-Margalet,