Original Research Article
A cross-sectional study on malnutrition in elderly using mini nutrition
assessment scores in an urban slum
Sharon S. Sonawane
1*, Varsha A. Varghese
2, John Paul J. Moses
3INTRODUCTION
The global demographic shift entails fundamental social, economic and development challenges and opportunities, not the least of which is the increasing priority to satisfy the needs of older persons while enabling them to have longer, healthier and more productive lives. The global share of older persons (aged 60 years or over) increased from 9.2 per cent in 1990 to 11.7 per cent in 2013 and will continue to grow as a proportion of the world
population, reaching 21.1 per cent by 2050. Presently, about two thirds of the world’s older people live in developing countries.1 According to 2011 Census, 8.6% population in India is elderly.2
Older persons are specifically susceptible to malnutrition as there are many practical issues encountered in providing adequate nutrition. With increasing age, though both lean body mass and basal metabolic rate declines, that leads to reduction in energy requirement, the
ABSTRACT
Background: The global demographic shift presents new challenges regarding health of elderly. Nutrition in elderly affects their immunity and functional ability. Most cases of malnutrition in elderly go under-reported. Hence, this study was conducted to study malnutrition in elderly using MNA score with the aim to find out the prevalence of malnutrition in elderly and study its associated factors in an urban slum in the field practice area of parent medical college.
Methods: Study was conducted in 120 elderly (>60 years) study participants. A pre-tested semi-structured questionnaire consisting of information on lifestyle, somatic, functional, social factors and Mini Nutrition Assessment (MNA)questionnaire was administered to assess the nutritional status of the elderly. Descriptive statistical measures like percentage, mean, standard deviations and inferential statistical measure like chi square were calculated.
Results: Among 120 elderly study participants, 83 (69.17%) were females, 37 (30.83%) were male and their mean age was 67.21 (±6.27) years. 40 (33.33%) had malnutrition, 65 (54.17%) were at risk of malnutrition and 15 (12.5%) had satisfactory nutrition. Medication use, socio-economic status and marital status showed significant association with malnutrition in elderly.
Conclusions: The high prevalence of malnutrition and risk of malnutrition in elderly necessitates appropriate preventive and corrective measures like detailed evaluation, regular follow-up and dietary interventions to be undertaken to deal with malnutrition in elderly.
Keywords: Malnutrition, Elderly, MNA score 1
Department of Community Medicine, 2Resident Medical Officer, B.J Government Medical College, Pune, Maharashtra, India
3
Department of Family Medicine, Christian Medical College, Vellore, Tamil Nadu, India
Received: 16 May 2019
Accepted: 03 July 2019
*Correspondence:
Dr. Sharon S. Sonawane,
E-mail: [email protected]
Copyright: © the author(s), publisher and licensee Medip Academy. This is an open-access article distributed under the terms of the Creative Commons Attribution Non-Commercial License, which permits unrestricted non-commercial use, distribution, and reproduction in any medium, provided the original work is properly cited.
necessity for other vital nutrients rises.3 Nutrition in elderly affects their immunity and functional ability.4-6 Factors like feeding difficulty, reduced mobility, psychological distress, being widowed, illiteracy, caring for children, poverty, and poor access to health and social services make elderly more vulnerable for malnutrition.7 Several studies have shown that malnutrition among elderly can cause increase in morbidity and mortality.8 Most cases of malnutrition in elderly go under-reported. There is no gold standard for estimating malnutrition among the elderly.9 Body mass index (BMI; weight [kg]/height [m]2) predicts disease risk both in those termed underweight and in those who are obese. The WHO categorizes underweight as BMI <18.5, normal 18.5-24.9, overweight 25-29.9, obese 30-30.99, and extreme obesity >40. However, BMI may be unreliable in the presence of confounding factors such as edema or ascites, and may not identify significant unintentional weight loss if used as a single assessment.10-12 Furthermore, reliable measurement of height can be difficult in the elderly because of vertebral compression, loss of muscle tone, and postural changes.10,13 Mini Nutrition Assessment (MNA) is a widely used international questionnaire to evaluate the nutritional state of elderly with high sensitivity (98.9%), specificity (94.3%) and diagnostic accuracy (97.2%). It closely correlates with biochemical (albumin, prealbumin, transferrin levels, and lymphocyte numbers) and anthropometrical markers (measuring of subcuticular fat and arms circumference) that were verified by a number of clinical studies on wide sets of geriatric patients.14-16 However, in India, very few community studies were conducted to estimate malnutrition among elderly using MNA. Hence, this study was conducted to find out the prevalence of malnutrition and study its associated factors using Mini Nutrition Assessment (MNA) score.
METHODS
Study design
This was a cross sectional study done in the urban slum located in the field practise area of Topiwala National Medical College, Mumbai from January 2017 to July 2017
Inclusion and exclusion criteria
Individuals > 60 years old and who gave the consent were included in the study.Individuals > 60 years old who had undergone any surgery in last 1 month, individuals > 60 years old who have undergone bilateral above knee amputations or bilateral above-elbow amputation were excluded from the study.
Sample size
Sample size was calculated by using the formula [n=(z2)P(100-P)/d2], where P=expected prevalence, z=z
statistic for level of confidence, d=allowable (absolute) error. Taking prevalence of malnutrition among elderly as 17.9 % based on a previous study,absolute precision of 7% and a confidence interval of 95%, sample size was calculated to be 120.21 Primary sampling unit was households. Total number of households in the field practise area of the Urban Health Centre was obtained from the register after which, systematic random sampling was employed to select the households. An individual >60 years of age was the study unit and was recruited into the study randomly from the selected households. Households which were locked even after three visits were excluded from the study.
Study tool
Data was collected after taking written informed consent by using a pre-tested semi-structured questionnaire consisting of close and open ended questions. Nutritional status was assessed with the MNA, a validated questionnaire for older individuals.18 The questionnaire comprises 18 questions clustered in four sections: Anthropometric assessment (weight, height, and weight loss); general assessment (living situation, medicine use, and mobility); dietary assessment (number of meals, food and fluid intake, and autonomy of feeding), and subjective assessment (self-perception of health and nutritional status). A maximum score of 30 can be obtained. A score below 17 indicates malnutrition, a score of 17-23.5 indicates a risk of malnutrition, and a score of 24 or higher indicates a satisfactory nutritional status.
Possible factors associated with malnutrition were classified as lifestyle, somatic, functional, and social factors. Lifestyle characteristics included smoking and alcohol consumption. Somatic characteristics included medication use, co-morbidity, and use of walking aid. Functional characteristics included activities of daily life (ADL) and instrumental ADL (IADL). Social factors included socioeconomic status, education, marital status, pension, and living alone.
Parameters measured were weight, height, BMI, calf circumference and mid-arm circumference.
Statistical analysis
The data was entered in Microsoft Excel and analysed using SPSS 20 statistical software. Descriptive statistical measures like percentage, mean and standard deviation were calculated. An inferential statistical measure like Chi square was applied.
RESULTS
risk of malnutrition (MNA score 17–23.5) and15 (12.5%) had satisfactory nutrition (MNA score ≥24) (Table 1). Majority elderly participants belonged to 60 to 69 years age group, out of which 28 (23.33%) were malnourished and 50 (41.67%) were at risk of malnutrition.
Malnutrition and risk of malnutrition was slightly higher in females compared to males. 28 (23.33%) out of 57 (47.50%) study participants belonging to socio-economic class V were having malnutrition. Malnutrition was higher in individuals with none or only primary level education (Table 2).
Table 1: Distribution of study participants as per sex and nutritional status according MNA score.
Sl. no. Parameter Total (n) Percentage (%)
1. Sex Male 37 30.83
Female 83 69.17
2. Nutritional status
according to MNA scores
Malnourished (MNA score <17) 40 33.33 At risk of malnutrition (MNA score 17–
23.5) 65 54.17
Satisfactory nutrition (MNA score ≥24) 15 12.50
Table 2: Distribution of nutritional status in elderly according to socio-demographic characteristics.
Sl. no Socio-demographic variable
Nutritional status according to MNA score
Total N (%)
Malnourished N (%)
At risk of malnutrition N (%)
Satisfactory nutrition N (%)
1. Age group
(years)
60 to 69 28 (23.33) 50 (41.67) 9 (7.50) 87 (72.50) 70 to 79 11 (9.16) 13 (10.83) 6 (5.00) 30 (25.00) 80 to 89 0 (0.00) 1 (0.83) 0 (0.00) 1 (0.83) 90 to 99 1 (0.83) 1 (0.83) 0 (0.00) 2 (1.66)
2. Sex Male 12 (10.00) 18 (15.00) 7 (5.83) 37 (30.83) Female 28 (23.33) 47 (39.17) 8 (6.67) 83 (69.17)
3.
Socio-economic status
Class III 9 (7.50) 32 (26.67) 12 (10.00) 53 (44.17) Class IV 3 (2.50) 4 (3.33) 3 (2.50) 10 (8.33) Class V 28 (23.33) 29 (24.17) 0 (0.00) 57 (47.50)
4. Education
Illiterate 13 (10.83) 17 (14.17) 1 (0.83) 31 (25.83) Primary 16 (13.33) 24 (20.00) 4 (3.33) 44 (36.67) Secondary 5 (4.17) 10 (8.33) 2 (1.66) 17 (14.16) Higher secondary 4 (3.33) 5 (4.17) 5 (4.17) 14 (11.67) Graduate 2 (1.66) 9 (7.50) 3 (2.5) 14 (11.67)
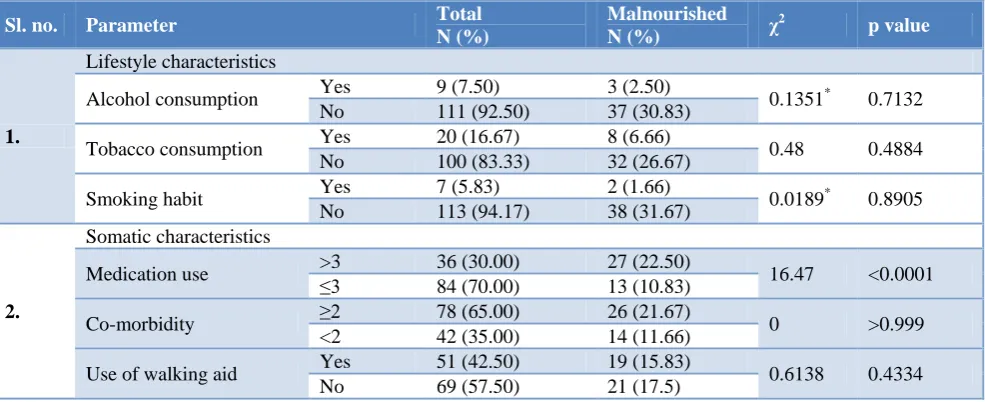
Table 3: Associations between lifestyle characteristics, somatic characteristics, functional characteristics and malnutrition in elderly.
Sl. no. Parameter Total
N (%)
Malnourished
N (%) χ
2
p value
1.
Lifestyle characteristics
Alcohol consumption Yes 9 (7.50) 3 (2.50) 0.1351* 0.7132 No 111 (92.50) 37 (30.83)
Tobacco consumption Yes 20 (16.67) 8 (6.66) 0.48 0.4884 No 100 (83.33) 32 (26.67)
Smoking habit Yes 7 (5.83) 2 (1.66) 0.0189* 0.8905 No 113 (94.17) 38 (31.67)
2.
Somatic characteristics
Medication use >3 ≤3 36 (30.00) 27 (22.50) 16.47 <0.0001 84 (70.00) 13 (10.83)
Co-morbidity ≥2 78 (65.00) 26 (21.67) 0 >0.999 <2 42 (35.00) 14 (11.66)
Use of walking aid Yes 51 (42.50) 19 (15.83) 0.6138 0.4334 No 69 (57.50) 21 (17.5)
Sl. no. Parameter Total N (%)
Malnourished
N (%) χ
2
p value
3.
Functional characteristics
ADL independent No 7 (5.83) 7 (5.83) 11.85* 0.0006 Yes 113 (94.17) 33 (27.50)
IADL independent No 11 (9.17) 8 (6.66) 6.618* 0.0101 Yes 109 (90.83) 32 (26.67)
* With Yates correction.
Table 4: Associations between social factors and malnutrition in elderly.
Sl.
no. Social factors
Total N (%)
Malnourished
N (%) χ
2
p value
1. Education Higher secondary and above 28 (23.33) 6 (5.00) 2.329 0.1270 Up-to higher secondary 92 (76.67) 34 (28.33)
2. Socio-economic
status
Class I, II, III 53 (44.17) 19 (15.83)
11.42 0.0007 Class IV and V 67 (55.83) 21 (17.50)
3. Marital status Married 61 (50.83) 11 (9.17) 13.07 0.0003 Single/ widowed/ divorced 59 (49.17) 29 (24.16)
4. Pension Yes 13 (10.83) 2 (1.66) 1.305* 0.2533
No 107 (89.17) 38 (31.67)
5. Living alone No 1 (0.83) 1 (0.83) 0.1261* 0.7226
Yes 119 (99.17) 39 (32.50)
* With Yates correction.
Lifestyle characteristics like alcohol consumption, tobacco consumption and smoking habit did not show significant association with malnutrition in elderly. Somatic characteristic of medication use showed significant association with malnutrition in elderly (p<0.001). Both ADL (activities of daily living) and ILDL (instrumental activities of daily living) studied as functional characteristics were significantly associated with malnutrition in elderly (p=0.0006 and p=0.0101 respectively) (Table 3).
Among the demographic factors studied, socio-economic status (p=0.0007) and marital status (p=0.0003) showed significant association with malnutrition in elderly (Table 4).
DISCUSSION
In the present study among 120 elderly population, using the MNA score, 40 (33.33%) had malnutrition (MNA score <17) and 65 (54.17%) were at risk of malnutrition (MNA score 17–23.5). There are very few studies done so far in India to study malnutrition in elderly using MNA Score. Study by Kritika et al. showed that 20.8% of the elderly were malnourished and 43.7% were at risk of malnutrition as per MNA scores.17 A slightly low prevalence, i.e., 14 % of malnutrition and 49% at risk of malnutrition was shown by Vedantam et al.19 A lower prevalence of malnutrion (11%) and higher prevalence of at risk of malnutrition (62%) among the elderly was shown by Baweja et al in Western Rajasthan as compared to our study.20 Prevalence of malnutrition among elderly was found to be 17.9% and about 58.8% were at risk of malnutrition in a study by Krishnamoorthy et al.21 A
study done in Spain showed lower percentages of malnutrition and at risk of malnutrition (4.3% and 25.4% respectively) in elderly.22
In the present study, lifestyle characteristics like alcohol consumption, tobacco consumption and smoking habit did not show significant association with malnutrition in elderly, which is similar to the findings of the study by Mathew et al.9 However, many other studies showed statistical significance with lifestyle characteristics and malnutrition in elderly.
Somatic characteristic of medication use showed significant association with malnutrition in elderly in our study. However, no such association was seen by Mathew et al.9 in their study. In our study, no significant association was observed between higher co-morbidity and malnutrition as well as between use of walk aid and malnutrition which were consistent with findings reported by Mathew et al.9 Functional characteristics like ADL (activities of daily living) and ILDL (instrumental activities of daily living) showed significant association with malnutrition in elderly in our study which were consistent with findings reported by Mathew et al.9 We observed that higher medication use and dependence for daily living activities pose greater risk of malnutrition for the geriatric population. Hence, primary care givers and peripheral health workers should be appropriately trained to identify such at risk cases and take the required preventive and corrective dietary measures.
which is consistent with findings by Mathew et al.9 We observed that lower socioeconomic status compared to higher socioeconomic status and single/widowed/divorced compared to married increase the risk of developing malnutrition in geriatric population due to various reasons like low purchasing power, lack of resources to make proper dietary choices and lack emotional support from spouse. These findings will help policy makers to focus on the important contributory factors and develop programmes for prevention, early diagnosis and treatment of malnutrition in elderly. Our study has several strengths. In this study we have used a validated questionnaire to elicit the prevalence of malnutrition and studied various possible factors that can affect malnutrition in elderly. However, there were certain limitations in the current study. Since this was cross-sectional study, establishing cause–effect relationship was not possible. As the study was done in smaller geographical region, it will be difficult to generalise it to other areas. Also, our data collection was dependent on the response of individual person and their relatives. This could have led to both under and over reporting of co-morbidities.
CONCLUSION
The prevalence of malnutrition in elderly is very high. There are several factors associated with risk of malnutrition in geriatric population. The present study suggests malnutrition is a multi-factorial condition associated with socio-demographic, somatic and functional status. Thus, we recommend that a multi-disciplinary approach including nutritional screening, early diagnosis and treatment and interventional dietary approaches be developed in this context. Further research is required to guide the policy makers to take appropriate action in context to malnutrition in elderly.
ACKNOWLEDGEMENTS
Authors would like to thank the study participants and the departmental staff for their help.
Funding: No funding sources Conflict of interest: None declared
Ethical approval: The study was approved by the Institutional Ethics Committee
REFERENCES
1. The United Nations: World Population Ageing 2013. Available at: https://www.un.org/en/ development/desa/population/publications/pdf/agein g/WorldPopulationAgeing2013.pdf. Accessed on 20 April 2017.
2. Central Statistics Office, Ministry of Statistics and Programme Implementation, Government of India: Elderly in India 2016. Available at: http://mospi.nic.in/sites/default/files/publication_rep
orts/ElderlyinIndia_2016.pdf. Accessed on 7 Dec 2018.
3. WHO: Nutrition for older persons. Available at: http://www.who.int/nutrition/topics/ageing/en/index 1.html. Accessed on 11 July 2017.
4. Lesourd B. Nutrition: A major factor influencing immunity in the elderly. J Nutr Health Aging. 2004;8:28-37.
5. Stuck AE, Walthert JM, Nikolaus T, Büla CJ, Hohmann C, Beck JC. Risk factors for functional status decline in community-living elderly people: A systematic literature review. Soc Sci Med. 1999;48:445-69.
6. Galanos AN, Pieper CF, Cornoni-Huntley JC, Bales CW, Fillenbaum GG. Nutrition and function: Is there arelationship between body mass index and the functional capabilities of community-dwelling elderly? J Am Geiatr Soc. 1994;42:368-73.
7. Kikafunda JK, Lukwago FB. Nutritional status and functional ability of the elderly aged 60 to 90 years in the Mpigi district of central Uganda. Nutrition. 2005;21:59-66.
8. Kalaiselvi S, Arjumand Y, Jayalakshmy R, Gomathi R, Pruthu T, Palanivel C. Prevalence of under-nutrition, associated factors and perceived nutritional status among elderly in a rural area of Puducherry, South India. Arch Gerontol Geriatr. 2016;65:156-60.
9. Mathew AC, Das D, Sampath S, Vijayakumar M, Ramakrishnan N, Ravishankar SL. Prevalence and correlates of malnutrition among elderly in an urban area in Coimbatore. Indian J Public Health. 2016;60:112-7.
10. Balcombe NR, Ferry PG, Saweirs WM. Nutritional status and well-being. Is there a relationship between body mass index and the well-being of older people? Curr Med Res Opin. 2001;17:1-7. 11. McKinlay J. Nutritional assessment: Identifying
patients’ needs. J R Coll Physicians Edinb. 2004;34:28-31.
12. Campillo B, Paillaud E, Uzan I, Merlier I, Abdellaoui M, Perennec J, et al. Value of body mass index in the detection of severe malnutrition: Influence of the pathology and changes in anthropometric parameters. Clin Nutr. 2004;23:551-9.
13. World Health Organization. Physical status: The use of and interpretation of anthropometry. Report of a WHO Expert Committee. Geneva: WHO; 1995. 14. Kagansky N, Berner Y, Koren-Morag N, Perelman
L, Knobler H, Levy S. Poor nutritional habits are predictors of poor outcome in very old hospitalized patients. Am J Clin Nutr. 2005;82:784-91.
15. Ruiz-López MD, Artacho R, Oliva P, Moreno-Torres R, Bolaños J, de Teresa C, et al. Nutritional risk in institutionalized older women determined by the mini nutritional assessment test: What are the main factors? Nutrition. 2003;19:767-71.
nutritional markers and the mini-nutritional assessment in 155 older persons. J Am Geriatr Soc. 2000;48:1300-9.
17. Kritika, Shikha D, Semwal J, Vyas S, Juyal R, Sati HC. Nutritional status and associated comorbidities among the elderly in Doiwala Block, Dehradun. Indian J Comm Health. 2014;26(Suppl S2):197-203. 18. Guigoz Y, Lauque S, Vellas B J. Identifying the elderly at risk for malnutrition. The mini nutritional assessment. Clin Geriatr Med. 2002;18:737-57. 19. Vedantam A, Subramaniam V, Rao NV, John KR.
Malnutrition in free living elderly in rural South India: Prevalence and risk factors. Public Health Nutr. 2010;13:1328-32.
20. Baweja S, Agarwal H, Mathur A, Haldiya KR, Mathur A. Assessment of nutritional status and related risk factor in community dwelling elderly in Western Rajasthan. J Ind Acad Geriatr. 2008;4:5-13.
21. Krishnamoorthy Y, Vijay ageetha M, Kumar SG, Rajaa S, Rehman T. Prevalence of malnutrition and its associated factors among elderly population in rural Puducherry using mini-nutritional assessment questionnaire. J Family Med Prim Care. 2018;7:1429-33.
22. Cuervo M, Garcia A, Ansorena D, Sanchez-Villegas A, Martinez-Gonzalez M, Astiasaran I, et al. Nutritional assessment interpretation on 22,007 Spanish community-dwelling elders through the Mini Nutritional Assessment test. Public Health Nutr. 2009;12(1):82-90.