Original Research Article
Assessment of glycaemic control among self-reported cases of diabetes:
an observation of a PPP model project
Jagruti Prajapati
1*, Jaydip Oza
2, B. B. Patel
3, Sunil R. Avashia
3INTRODUCTION
In India with more than 62 million diabetic individuals currently diagnosed with the disease which indicates the quickly growing epidemic of Diabetes.1,2 Highest number of diabetes mellitus cases were reported from India (31.7 million) followed by China (20.8 million) and the United States (17.7 million) in year 2000. According to Wild et al, the prevalence of diabetes is predicted to increase by
double globally from 171 million in 2000 to 366 million in 2030 and the increase will be maximum in India.3 It is predicted that by 2030 diabetes mellitus may affect up to 79.4 million individuals in India, which will be again more than China (42.3 million) and the United States (30.3 million).4 Looking to the current projections, India may face the huge disease burden due to diabetes in future. Many factors are affecting the prevalence of diabetes in the country, identification and effective
ABSTRACT
Background: Sociodemographic determinants of diabetes such as age, sex and socioeconomic status play a major role in diabetes outcome. It was necessary to design a research project to address this. The aim of this study is to determine the prevalence of diabetes and its sociodemographic factors such as age, gender, residential area, economic status and a level of education in the project districts.
Methods: The cross sectional study was carried out in the project districts named Ahmedabad, Dahod and Valsad. Urban, rural and tribal population are above 30 years of age from different districts were covered to collect data on socio economic back ground and status of diabetes. Random blood sugar was measured by glucometer and glycosylated haemoglobin (HbA1c) by the HbA1c analyzer.
Results: Proportion of male and female participants were near to equal. Percentage of self reported cases of diabetes (including controlled and uncontrolled) was 14.07% in urban areas while it was 5.24% in rural areas. Pre diabetes detection rate was more in rural area. During screening 11.83% of pre diabetes cases were identified. Difference between controlled and uncontrolled diabetes among illiterate and literate groups was statistically not significant.
Conclusions: This preliminary observational study included more than 51000 participants visiting primary and community health centres from three districts of Gujarat. The public private partnership model helped in systematic approach towards screening and data collection. The study reported prediabetes cases higher than global prevalence. More controlled studies are required to define the mandatory screening protocol in resource constrained settings.
Keywords: Constraint settings, Mandatory screening, Protocols in resource
1Department ofCommunity Medicine, GMERS Medical College, Gandhinagar, Gujarat, India 2
NPCDCS, State NCD Cell, Gandhinagar, Gujarat, India
3Commissionerate Health, Gandhinagar, Gujarat, India
Received: 16 November 2017
Revised: 14 December 2017
Accepted: 15 December 2017
*Correspondence:
Dr. Jagruti Prajapati,
E-mail: [email protected]
Copyright: © the author(s), publisher and licensee Medip Academy. This is an open-access article distributed under the terms of the Creative Commons Attribution Non-Commercial License, which permits unrestricted non-commercial use, distribution, and reproduction in any medium, provided the original work is properly cited.
preventive and control measures may revert or halt the rise in the prevalence of diabetes.
Previously diabetes was known as disease of affluence but now there are evidences that it is also prevalent in low socio economic class. According to WHO, more than 80% of people with diabetes live in low- and middle-income countries. In developed countries most people with diabetes are above the age of retirement, whereas in developing countries those most frequently affected are aged between 35 and 64. Various sporadic studies have been conducted in India, but there isn’t any national representative data on diabetes. Socio demographic determinant of diabetes like Age, Sex, Socio economic status play major role. Diabetes is particularly increasing among the marginalized and the poor.5 According to NFHS-3, self reported prevalence of diabetes in the age group of 35-49 was 2.1% among women and 2.7% among men suggesting substantial gaps in the awareness.6
In Gujarat, there is no representative data on Diabetes which reflect demographic and social distribution of diabetes in community. Quantifying the prevalence of DM and the number of people affected by diabetes, now and in the future, is important in permitting national planning and allocation of resources. The present study is based on a Public Private Partnership (PPP) model project between Govt. of Gujarat and Novo Nordisk
Education Foundation named Changing Diabetes
Barometer Project. The aim of this study was to determine the control of blood sugar level among self-reported cases of diabetes.
Objectives
To assess the blood sugar level among self-reported cases of diabetes (controlled/ uncontrolled)
To detect the socio demographic risk factors for Diabetes Mellitus (such as residential area, sex, level of education and economic status).
To assess the pre diabetes detection rate.
METHODS
Study design
Data from Changing Diabetes Barometer Project were used in this analysis. The cross sectional survey was carried out in three project districts named Ahmedabad, Dahod and Valsad. Ahmedabad covers urban and rural population while Dahod and Valsad are having mainly tribal inhabitants. Socio economic background and status of the diabetes of self reported cases at the camp as well as Primary Health Center and Community Health Centers are collected over the period of two year (from 1st June 2012 to 31st May 2014). Only the persons aged 30 years and above were considered eligible for the study. Information like Sex, Income, Social Class, Education and Random Blood Sugar (RBS), Fasting Blood Sugar
(FBS), Post Prandial Blood Sugar (PPBS) values were collected in standard format designed for the project and the same was entered online in project website (www.cdbindia.in) time to time. The groups based on geographical location, socioeconomic class, literacy and
glycemic status were compared. Glycosylated
hemoglobin (HbA1C) was measured of diabetic patients to know their controlled status. The person was defined as controlled diabetic and uncontrolled diabetic depending upon their HbA1C value.
Methods of measurement
1. Random Blood Glucose was measured by
glucometer and glucostrips using capillary blood. 2. HBA1C was measure by nephelometer (calibrated
and standardized) using venous blood sample.
Table 1: Diagnostic criteria and classification of diabetes depending upon the blood sugar level.7-8
FBS (mg/dl) PPBS (mg/dl)
New case of
diabetes7 ≥126 ≥200 Pre diabetic7 ≥110 to <126 >140 to <200
HbA1c PPPG Controlled
diabetes8 ≤7% ≤180 mg/dl Un controlled
diabetes8 >7% >180 mg/dl
Other criteria9
Economically Weaker Segment/Low income Group (EWS/LIG): Family income is INR <2, 00,000 per annum
Middle Income Group (MIG): Family income is between IRN 2,00,000 to 4,00,000 per annum
High Income Group (HIG): Family income is INR > 4,00,000 per annum
Exclusion criteria
Persons below the age of 30 years attending camps and OPD in primary health centers/ community health centers were excluded from the study.
Limitation of study
Though the data were collected from the self reported cases so it may not represent whole state as well as result cannot be generalized.
RESULTS
were reported. Percentage of total diabetes cases both Controlled as well as uncontrolled are more in urban areas then rural areas. New Diagnosed diabetes cases are nearly equal. 11.24% Prediabetes cases were identified in
the present study. Pre diabetes detection rate is more in rural area. This difference is statistically significant (X2 = 913.76, Df=4, p<0.00) (Table 2).
Figure 1 (A and B): Sex and area wise distribution of study population. Table 2: Percentage distribution of study population for urban and rural variable.
Back ground variable
Controlled diabetes (%)
Uncontrolled diabetes (%)
Newly diagnosed diabetes (%)
Pre diabetes (%)
Non diabetes (%)
Total population
Urban 5.95 8.12 2.39 8.23 75.31 8234
Rural 2.15 3.09 2.52 11.83 80.41 43056
Table 3: Percentage distribution of study population for gender variable.
Back ground variable
Controlled diabetes (%)
Uncontrolled diabetes (%)
Newly diagnosed (%)
Pre diabetes (%)
Non diabetes (%)
Total population
Male 3.1 4.63 2.88 11.41 77.98 22818
Female 2.48 3.31 2.2 11.12 80.89 28472
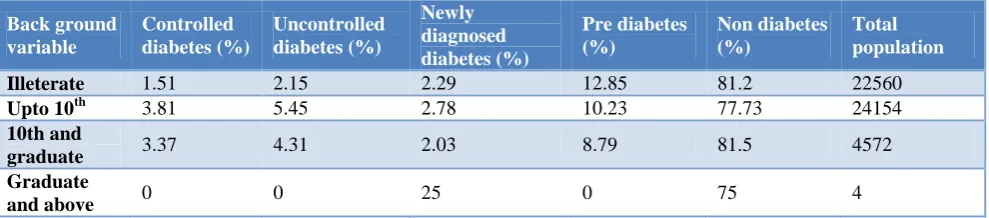
Table 4: Percentage distribution of study population for literacy variable.
Back ground variable
Controlled diabetes (%)
Uncontrolled diabetes (%)
Newly diagnosed diabetes (%)
Pre diabetes (%)
Non diabetes (%)
Total population
Illeterate 1.51 2.15 2.29 12.85 81.2 22560
Upto 10th 3.81 5.45 2.78 10.23 77.73 24154
10th and
graduate 3.37 4.31 2.03 8.79 81.5 4572 Graduate
and above 0 0 25 0 75 4
Newly diagnosed diabetes and Pre diabetes detection rate is almost equal in male and female while total diabetes case including Controlled and Uncontrolled diabetes percentage are more in male as compared to female. This difference is statistically significant (X2=1997.30, df=1) (Table 3).
Pre diabetes detection rate was more in illiterate as compared to literate individual. There was not much difference in newly diagnosed diabetes percentage in all
educational classes. Uncontrolled diabetes cases were 5.45% in individual who are literate up to 10th standard which was higher in comparison with other educational classes. Difference between uncontrolled and controlled diabetes among illiterate and literate group is statistically not significant. (X2=0.15, df=1) (Table 4).
Total cases of Diabetes including Control as well as Uncontrolled were more in High Income Group as compared to other group. Percentage of control and
uncontrolled diabetes case was 1.9% and 2.83% in Lower Income Group which was much lower than High income
group. This difference is statistically significant (X2=494.7, df =1) (Table 5).
Table 5: Percentage distribution of study population for background variable (socio economic status).
Back ground variable
Controlled diabetes (%)
Uncontrolled diabetes (%)
Newly diagnosed diabetes (%)
Pre diabetes (%)
Non diabetes (%)
Total population
EWS/LIG 1.9 2.83 2.36 11.34 81.57 38095
MIG 5.16 6.98 2.92 11.03 73.91 13031
HIG 10.97 7.74 2.58 7.74 70.97 155
DISCUSSION
Presence of 3.93% of uncontrolled cases of diabetes shows the poor glycemic control on the diabetes patients. Strategic action plan would require to prevent the complications due to diabetes and to reduce the premature mortality due to diabetes which is one of the target under the sustainable development goal.
11.24% of pre-diabetes cases were identified due the screening. Government of India’s current strategy under NPCDCS is also focused on the screening for common NCDs including diabetes in the community. Screening will help to diagnose the diabetes in early stage. All the prediabetes cases would undergo the confirmative diagnosis, so that early treatment can be initiated and complication can be prevented.
Participation of Male and Female was near to equal (56% Male and 46% Female). The data collected was self reported case and those who have reported actively at the Camps, Urban health Centers, Primary health Centers or Community Health Centers. Only 16% of the total participants were from the Urban areas while others were from rural areas. This difference might be because of the easy accessibility of the laboratory, private practitioners and hospitals in urban areas. Indian urban population has access to reliable screening methods and anti-diabetic-medications, such health benefits are not often available to the rural patients.
Percentage of self reported cases of diabetes was 14.07% in urban area while it was 5.24% in rural areas. Similar difference in self reported cases were found in a study done by Mohan et al in south India.10 New diagnosed cases was almost equal in current study while pre diabetes detection rate was 11.83% in rural area and 8.23% in urban area. In various study pre diabetic cases were found in the range of 7% to 11%.11
One larger study conducted in urban and rural surveillance locations in Northern, Southern, Eastern and Western/Central India identified an OR of 3.0 (95% CI 2.5 to 3.7) for self-reported diabetes for those with graduate-level education versus those without formal schooling.10 In this study there is no significant
association found between literacy and glycaemic control.
Social and behavioral determinants of health
(socioeconomic status, life stress, and sense of belonging) are also important in type 2 diabetes.12 In this study pre diabetes detection rate is lower in high socio economic group but controlled and uncontrolled cases are higher.
Though health facilities are available more in urban area, uncontrolled diabetes cases are more may be because of lack of awareness regarding disease and its complication as well as failure of treatment adherence, diet and level of stress due to fast and comparative lifestyle in urban areas
CONCLUSION
There is a difference between confirmed cases of diabetes and pre diabetes cases among urban & rural population. Disproportionate allocation of health resources between urban and rural areas needs to be addressed in diabetes control interventions.
Treatment adherence, healthy diet and follow up treatment of diabetes will be the key aspects for adequate glycemic control among the diabetics.
Uncontrolled diabetes will result into the end organ damage. Current study shows the large numbers of uncontrolled cases of diabetes where detected. Strategies should focus on health education of Diabetics for treatment compliance.
HBA1C is the gold standard test to measure the glycemic control over the last three months. Public health institution should be strengthening to ensure the availability of HbA1C test at least at district level.
Policy should be made to ensure uninterrupted supply of anti-diabetic drugs to the health institution and within the reach of people.
Further study can be planned to see the role of socio economic determinants for Diabetes over the glycemic control. This may help to design interventions for prevention and control of diabetes.
Funding: No funding sources Conflict of interest: None declared
Ethical approval: The study was approved by the Institutional Ethics Committee
REFERENCES
1. Joshi SR, Parikh RM. India - diabetes capital of the world: now heading towards hypertension. J Assoc Physicians India. 2007;55:323–4.
2. Kumar A, Goel MK, Jain RB, Khanna P, Chaudhary
V. India towards diabetes control: Key issues. Australas Med J. 2013;6(10):524–31.
3. Wild S, Roglic G, Green A, Sicree R, King H. Global prevalence of diabetes-estimates for the year 2000 and projections for 2030. Diabetes Care. 2004;27(3):1047–53.
4. Whiting Dr, Guariguata L, Weil C, Shawj. IDF Diabetes atlas: Global estimates of the prevalence of diabetes for 2011 and 2030. Diabetes Res Clin Pract. 2011;94:311–21.
5. Report on causes of deaths in India 2001-2003. Office of the Registrar General of India, Govt. of India, 2010.
6. International Institute for Population Sciences, Macro International. National Family Health Survey (NFHS-3) 2005-06: India. Mumbai: IIPS; 2007.
7. NPCDCS operational Guideline, Ministry of Health
& Family welfare, Government of India 8. International Diabetes Federation, 2007
9. Ministry of Housing and urban poverty alleviation, Govt. of India (www.mhupa.gov.in)
10. Mohan V, Mathur P, Deepa R, Deepa M, Shukla DK, Menon GR, et al. Urban - Rural difference in prevlance of self reported Diabetes in India, WHO ICMR Indian NCD Risk factor surveillance, Diabetes Res Cli Pract. 2008;80(1):159-68
11. Ramachandran A, Snehalatha C, Latha E,
Manoharan M, Vijay V, Impacts of urbanization on the life style and on the prevalence of diabetes in Native Asian Indian Population, Diabetes Res Cli Pract. 1999;44(3):207-13.
12. Maddigan SL, Feeny DH, Majumdar SR, Farris KB,
Johnson JA. Understanding determinants of health in type 2 diabetes. Am J Public Health. 2006;96(9):1649–55.