This is an Open Access article licensed under a Creative Commons Attribution-NonCommercial-ShareAlike 4.0 International License (https://creativecommons.org/licenses/by-nc-sa/4.0/ ), which permits unrestricted Non Commercial use, distribution and reproduction in any medium, provided the original work is properly cited.
Published by Oriental Scientific Publishing Company © 2018
Detection of Hard Exudates Based on
Morphological Feature Extraction
SHILPA JOSHI
and P. T. KARULE
Department of Electronics Engineering, YCCE, Nagpur University, Nagpur, India, 441110, India. *Corresponding author E-mail: [email protected]
http://dx.doi.org/10.13005/bpj/1366
(Received: December 28, 2017; accepted: January 08, 2018)
ABSTRACT
In diabetic patients, the chances of vision loss are higher. These issues related to vision can be diagnosed using diabetic retinopathy. It is one of the very important diseases amongst all retinal pathologies. One of the simplest changes observed on the eye due to diabetes is lesions in yellow or white color i.e. hard exudates (EX). It appears bright in fundus images and hence it is the most important to detect using image processing algorithm. In this work the proposed algorithm used is based on morphological feature extraction. Post processing techniques are required to separate out EX from other bright artefacts such as cotton wool spot and optic disc. The performance evaluation
of the proposed algorithm shows the sensitivity of 96.7%, specificity 85.4% and accuracy of 91%
on image level detection on Diaretdb1 database and achieved higher accuracy on publicly available
e-ophtha EX retinal image database in terms of lesion level detection. It is computationally efficient
as an automated system to assist the ophthalmologist. Early detection of hard exudates is crucial for diagnosing the stages of diabetic retinopathy to prevent blindness.
.
Keywords: Fundus Images, Hard Exudates, Diabetic Retinopathy, Morphology, Bright Lesions, Feature Extraction.
INTRODUCTION
The appearance of EX lying superficially
on the fundus image is one of the most clinical symptoms of diabetic retinopathy (DR). Bright lesions abnormalities progression in disease DR leads to visual loss. Intra retinal fatty EX are also signs of coexistent retinal edema. Exudates are associated with vascular damage. This leakage causes bright yellow patches having variations in size and shapes. For the automatic diagnostic system, the digital nature of these bright lesions proves useful in DR screening. Automatic exudates
detection has a challenging task due to significant
spatial illumination and color variations along with the poor contrast of fundus images.
Several works have been proposed to separate exudates from the fundus background. Overall image segmentation approaches for exudates has based on thresholding, clustering, mixture
modelling, region growing, morphology, classification
techniques and many others. Usually exudates detection approaches start with preprocessing and
removal of the optic disc. Any of the first detection
belonging to the class of exudates. Finally, selection or classification procedure is applied based on features computed on each candidate results in only exudates. Machine learning methods are used for this last step.
One of the simplest segmentation approaches for exudates detection is thresholding. However due to low contrast between exudates and other artefacts of retinal background as well as uneven intensity variation of exudates in different retinal images the automatic selection of threshold is a challenging task. Noise removal thresholding was adopted by Philips et al. with 87% sensitivity1
whereas image intensity thresholding proposed by Ege et al. with 99% sensitivity2. Global and adaptive
thresholding applied by Garcia et al. with logistics regression for both lesion based and image based
criteria using different types of classifier such as
radial basis function neural network, support vector machine and multilevel perceptron on the database
of 117 images with sensitivity of 100%, specificity
92.59% and 97.01% accuracy for image based criteria and 88.14% sensitivity and positive predictive value 80.72% for lesion based criteria3.
A combined method of fuzzy c-means clustering, normalization and enhancement with
different types of the classifier proposed by Osareh
et al. in terms of back propagation, SVM and scaled conjugate gradient used to train the neural network by applying lesion based and image based criteria on retinal images4. A combination of
moat operator, thresholding and recursive region growing segmentation used to detect features of non-proliferative DR. Exudates detection rate of
sensitivity and specificity was 88.5% and 99.7% on
a small database of 30 images5. The same approach
of recursive region growing and adaptive intensity thresholding followed by Usher et al6 with 95.1%
sensitivity. A combination of Gaussian derivative filters, thresholding and k nearest neighbours classification employed by Niemeijer et al. to distinguish between bright lesions such as exudates, cotton wool spots or drusen7. In these types of classifications better and larger training set of quality
annotations may increase the system performance. K-means clustering approach along with Morphology on 89 numbers of images proposed by Biyani et al. 8.
In exudates detection process, the green component of color RGB model enhanced by following preprocessing criteria by Foracchia et al9. A powerful mixture model technique and a
dynamic thresholding used for better segmentation of exudates was presented by Sanchez et al. Post processing applied to detect bright elements. Edge strength map obtained using kirsch operator and morphological reconstruction based on algorithm parameter value used to reduce the number of false positive. This study processed on 106 images using image based and lesion based criteria10. The
main confounding feature i.e. drusen not handled as it is absent in the images database referred to check the algorithm performance. Based on thirty locally evaluated features and twelve contextual features, posterior probability map was computed to obtain the area under ROC curve from 0.84 to 0.92 for 144 images. The main issue for obvious lesions was that as compared to appearance information, contextual information was redundant in the technique developed by Sanchez et al11.
Diabetic Macular Edema (DME) diagnosis proposed by Giancardo et al. on the basis of
classification for single feature vector with 3 different
types of analysis. The first type was exudates probability map computed by using median
filtered normalization technique with morphological
reconstruction. The second type was color analysis based on histogram equalization and the third type was wavelet decomposition analysis. Three different classification strategies such as probalistic i.e. Naïve Bayes, Geometric i.e. SVM and tree based i.e. Random forest algorithm applied on HEI-MED database images. This technique was not directly comparable as it was for DME diagnosis and not for DR and it was types of lesion based detection
12. Two scale exudates candidate extraction done
by Zhang et al. in which large exudates candidates using morphological reconstruction phenomenon and small exudates candidates by means of the
morphological top hat. Finally, classification based
on candidate characterization using contextual and textural features performed by random forest algorithm13.
grey level. Morphological reconstruction used to find the contours of exudates candidates after the optic disc removal. The distinction between hard and soft exudates was not possible with the proposed algorithm of Walter et al14. Morphological
compact tree approach presented by Ghaffar et al15 was only 78% accurate detection for hard
exudates. The algorithm improvement for accurate exudates detection can be possible by adding
more specific features to the system as employed
by Sopharak et a16. To identify possible exudates
regions combination of grayscale morphology, a large set of descriptors for each candidate pixel and selection of more relevant features to train naïve
Bayes classifier was proposed by Harangi et al.
to obtain 63% sensitivity, 85% positive predictive value17. Multiscale morphology process, dynamic
thresholding, locally evaluated features, watershed
retinal region growing and SVM classifier proposed
by Fleming et al. to classify candidate exudate18.
The proposed algorithm addresses the automated detection of EX through the aspects of preprocessing, exudates segmentation based on mathematical morphology and post processing.
This work is related to clear segmentation of hard exudates among the exudates types.
MATERIALS AND METHODS
In automatic EX detection due to high similarity in appearance between EX and optic disc,
the first difficulty arises is the accurate elimination
of optic disc. Based on these criteria, extract the regions which possibly contain the EX to reduce
the computational time. The fig. 1 shows the flow of
proposed algorithm.
Preprocessing
In color fundus images among different types of bright lesions, EX appears as compact irregular paths may be in ring structures or isolated small dots. In this study simple, digital imaging approaches are applied to perform exudates detection.
Since the original images are color images which are combined with three R, G, B bands
as shown in fig. 2 (a). It has been observed that
exudates appear more contrasted in the green
channel, so for further processing by suppressing other two channels, the green channel image is used. By using the eroded image as a baseline image morphological reconstruction is used to get
more refinement of candidate region which is defined
as
RG(q)=Max (Min (M(q), k), f(q))) ...(1)
Where M is the marker Image, k is the kernel and f is the source image.
In morphology based approaches an important factor which plays a vital role in the processing of images is the tuning structural parameter that is applied. In this work, a line structuring element is used as it is more isotropic and
computationally efficient. To get the morphological
resultant image, subtract reconstructed result from green channel image. Due to intensity variance of adjacent pixels normalization is next necessary preprocessing step. The result is as shown in
fig 2 (b). Then convert it into binary form using thresholding for α1 to α2 range of values are
performed for each possible candidate regions
followed by noise removal step as shown in fig 2 (c).
Optic Disc Removal
The next step is to remove the optic disc using adaptive contrast enhancement. By
maintaining original height to width ratio, resize the
images. With the simple approach of finding the
largest value which returns the row and column indices of image for generating the mask and
subtract it from preprocessed result as shown in fig 2(d) and 2(e). The final segmented result is shown in fig 2(f). Figure 2 shows the stepwise results for
an image.
Bright Structure Removal
As there are several issues responsible for incorrect exudates detection such as some exudates appear very faint related to their immediate surroundings, strong and high contrast vascular structure, other similar artifacts lie in the retina background and noisy elements introduced at the time of the image acquisition process are incorrectly detected as candidate exudates. The success of the proposed algorithm is attributed in terms of features extraction conditions which are applied to the previous output image. The result of this selection
is a binary image. It is a mask for classification
step used for labeling the pixels as exudate and non-exudate. This results in a candidate set which contains exudates but still, there are chances of other bright structure also.
With the proper tuning of range of
parameter values significantly proves the robustness
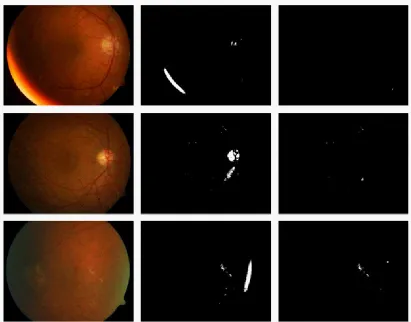
Fig. 3: (a) Original Image- yellowish bright region at the contour boundary (b) Binary Image (c) Final hard exudates Image (d) Original Image- Bright reflection near the optic disc (e) Binary
Image (f) Final hard exudates Image (g) Original Image- greenish regions at the boundary of contour (h) Binary Image (i) Final hard exudates Image
of the proposed algorithm. Find core connectivity or pixel connectivity for all the objects to remove longer blood vessels. The proposed algorithm involves measuring of different properties of the image regions such as orientation, major axis length, minor axis length, eccentricity, centroid and all other shape
parameters. Then define the condition for these
parameters.
Check for the conditions such as aspect ratio less than particular value r, the area greater than the particular value a and perimeter less
than a specified value p. Proper selection of these
conditions has shown all possible candidates of regions of exudates and unwanted component depends on shape has to be removed. Finally, to classify true candidates new feature is introduced
i.e. vein removal term (VRT) related to area-based
classification. The elongated structures are never
the part of the original diagnosis.
In fundus image analysis for the bright structure removal besides the optic disc, is related to uneven contrast with respect to distance from the center to away from the center in the fundus photographs. In fundus images common processing problem arises in the stage of enhancement according to these non- uniform illumination i.e. different features and regions of the fundus are differently illuminated in different locations of the
image. The second case is related to reflection near
the optic disc generally found in fundus of young patients which causes the misleading detection for
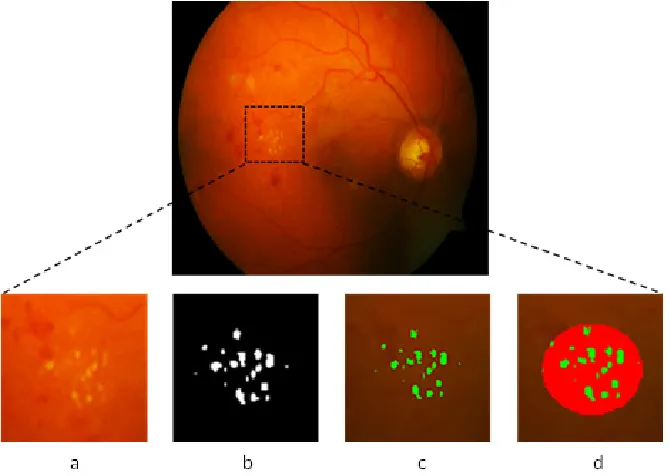
Fig. 4: Original Image marked with exudates present (a) Enlarged version of marked area (b) Detection result of the proposed method (c) Detection result on original image (d) Proposed
method detection (by green) and ground truth (by red) on original image by taking the inferior and superior region of fundus
separately and processed through the newly added feature of the proposed algorithm.
The resultant binary image is separated out in inferior, superior, nasal and temporal region and these different cases of structures are removed from its binary form to find out true exudates detection. Each region is processed through the connected component analysis of the image. The bright reflection generally found in inferior and superior region or near the optic disc area. This misleading structure is removed through this VRT
parameter. Mostly this reflection is due to extreme
eye lens transparency which misleading the exudate detection in inferior and superior regions of the image. To prevent falls detection and to improve the exudate detection accuracy, processed these two regions separately. The VRT parameter is applicable to the bright structures removal other than exudates as shown in following cases.
Case 1: When yellowish bright region is present at the boundary of contour and detected in binary
format as shown in fig. 3 (a) and 3 (b)
Case 2: Bright reflection near the optic disc area detected in binary form as shown in fig 3 (d) and
3 (e).
Case 3: When the greenish regions is present at the boundary of contour and detected in binary form as
shown in fig 3 (g) and 3 (h)
This all bright structures are removed by using proper tuning value of VRT parameter and to achieve true exudate extraction. This VRT parameter is
defined as
...(2)
Where li is long axis length and ls is short axis length and a is area and P is periphery which is distance around the boundary of the EX candidate region.
The proper tuning value as 5 of this VRT parameter results in true candidate exudates
detection. The final resultant image is shown in fig 3
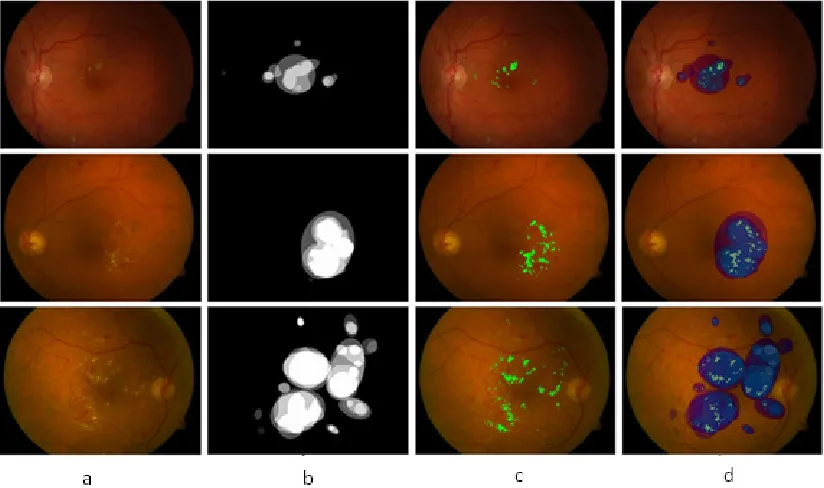
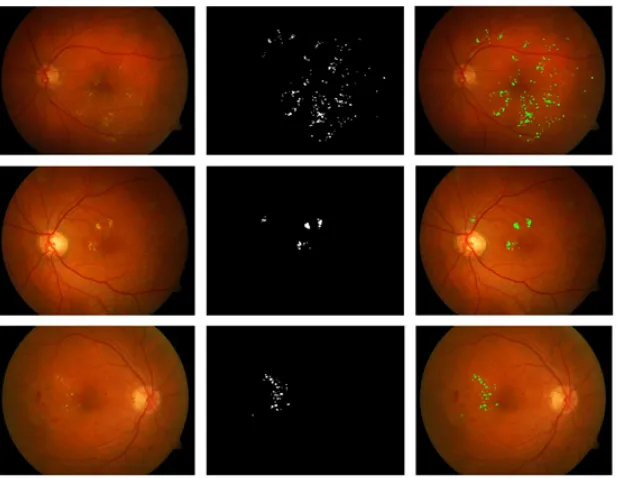
Fig. 6: (a) Original Image (b) Ground truth given by experts in Diaretdb1 database (c) Proposed method results of hard exudates on original Image (d) Experts labelled from Diaretdb1 and
proposed detection result on original image (b1, b2), thresholding and tuning parameter values
(α1, α2, α3, r, a, p) are tested in order to improve
the accuracy in the algorithm performance.
Experimental Results
All parameters in this proposed method are set using the values that have given highest
sensitivity and specificity. This type of approach
Fig. 7: (a) Original Image (b) segmented result on Diaretdb0 database (c) Proposed method results of hard exudates on original Image
Fig. 8: (a) Example of 1440 X 960 size images from e-ophtha EX database (b) proposed
algorithm segmentation result
Fig. 9: (a) Example of 2544 X 1696 size images form e-ophtha EX database (b) Proposed
algorithm segmentation result assists ophthalmologist to identify EX pathology
quickly. This pixel-based evaluation results in quantitative values such as True Positive – correct
classification of exudate pixels. True Negative - correct classification of non-exudate pixels. False Positive- Non-exudate pixels classified wrongly as
exudates pixels. False Negative- Exudate pixels
classified incorrectly as non-exudate pixels.
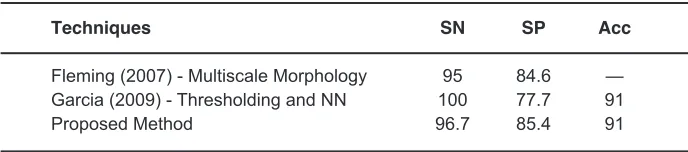
Table 1: Performance comparison of the proposed method with the reported methods
Techniques SN SP Acc
Fleming (2007) - Multiscale Morphology 95 84.6 — Garcia (2009) - Thresholding and NN 100 77.7 91
Proposed Method 96.7 85.4 91
SN-Sensitivity, SP-Specificity, Acc-Accuracy
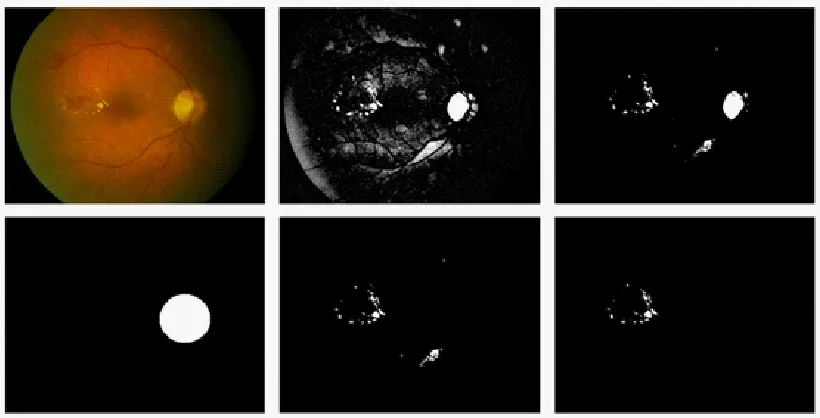
in binary and the segmented output along with the Groundtruth is shown on original image. Fig 5 shows the example of another type of abnormalities such as cotton wool spot (CWS) and hemorrhages (HE) present along with the EX and evaluation of the detection performance of proposed method results in the segmentation of hard exudates.
As shown in fig 5 (a) false candidates such as CWS which are also the bright lesions with the similar appearance are hard to classify with respect to true positive detection of hard exudates.
The efficient way of differentiating between hard
exudates and CWS helps in reducing the number of false positive for automatic identification of particular bright lesions such as hard exudates. With the proposed method false positives are zero
as shown in fig 5 (b). There are other red lesions in
retinal images namely HE closes to hard exudates may be more lightly to be true lesions. The presence
of HE near to hard exudates is also shown in fig 5
(a). Therefore, successful discrimination between red lesions and hard exudates are also important
for the final detection as shown in fig 5 (b).
From these quantities computation of sensitivity and specificity has done. With the proposed algorithm retinal images having hard exudates pathology and normal image without these pathologies have processed. The results show that
successful identification of exudates in abnormal
images and successful recognition of normal images without exudates.
The resultant exudates pixels are compared with ground truth data provided in Diaretdb database db1 having 89 images. The sensitivity of 96.7%,
specificity 85.4% and accuracy of 91% are results in terms of image based classification accuracy
for hard exudates type of retinal pathology. This approach intended to prove helpful for clinicians for recognizing the bright symptoms faster and more easily in diabetic retinopathy screening.
According to our knowledge, these
approach of the specific feature vector in terms of
VRT have never described previously and prove as quite successful. The proposed algorithm obtained
very high specificity which proves that it does not
identify non-exudate pixels as exudates pixels. In 47 of the 89 fundus images of Diaretdb1 database are having diabetic symptoms of hard exudates. The presence of hard exudates are successfully detected in the images having these diabetic signs. The result
is as shown in fig. 6.
The evaluation of proposed algorithm is
as shown in fig. 7 provided on Diaretbd0 database
having 130 images.
The evaluation of proposed algorithm is also provided on Diaretbd0 database having 130 images. In 65 of the 130 fundus images of Diaretdb1 database are having diabetic symptoms of clearly visible hard exudates. The sensitivity of 94.5%,
specificity 83.6% and accuracy of 89% are results in terms of image based classification accuracy on
Diaretdb0 database images for hard exudates type of retinal pathology.
of proposed algorithm is evaluated on e-ophtha EX database in terms of sensitivity 80.5% and accuracy
95%. As specificity calculation is irrelevant due
a large number of true negative pixels from the background. The performance of proposed algorithm is evaluated by calculating F- score value as 0.81. The successful evaluation of the proposed algorithm for detection of hard exudates shows on the images having large variability in shape and contrast for
e-ophtha EX database images in fig. 8 and fig.9
with varying dimensions. Table 1 summarized performance comparison of the proposed method with the reported methods on image level detection.
DISCUSSION
The accurate detection of EX used to assess the progress of DR diseases. The selection of appropriate feature vector to recognize particular objects in an image is a challenging task. The proposed approach is based on simple area based
feature to segment the bright lesion rather than providing a large number of features set to be computed for each lesion. This approach not only reduces the feature set but also make it as simple and easy to give the proper lesion segmentation. Utilization of morphological based methods proves their efficiency in bright patch recognition. The detection accuracy of exudates extraction may improve with the quality of images.
CONCLUSION
A morphological feature extraction approach is established to better distinguish the hard exudates bright structure from all other artefacts in retinal images. The idea of this feature extraction set sound and reasonable results for the detection and analysis. It could be applied to automatic DR screening and grading of the retinopathy diseases based on recognition of hard exudates.
REFERENCES
1. Philips R, Forrester J and Sharp P. Automated detection and quantification of retinal exudates. Graefe’s Archive for Clinical and Experimental Ophthalmology, 23(2): 90–94 (1993).
2. Ege BM, Hejlese L, Larsen OV, Moller B and Kerr M, Screening for diabetic retinopathy using computer based image analysis and statistical classification. Computer Methods. Programs Biomed:165-175. http:// doi.org/10.1016/S0169-2607(00)00065-1,(2000).
3. Garcia M, Sanchez CI, Lopez MI, Abasol D and Hornero R, Neural network based detection of hard exudates in retinal images. Computer Methods and Programs in Biomedicine 93: 9–19, (2009).
4. Osareh A, Mirmehdi M, Thomas B and Markham R, Automated identification of diabetic retinal exudates in digital color images. British Journal of Ophthalmology 87: 1220–1223, (2003).
5. Sinthanayothin C, Boyce J F, Williamson TH, Cook HL, Mensah E, Lal S and Usher D, Automated detection of diabetic retinopathy on digital fundus images. Diabetic Medicine
19(2):105–112, (2002).
6. Usher D, Dumskyj M, Himaga M, Williamson TH, Nussey S and Boyce J, Automated detection of diabetic retinopathy in digital retinal images: a tool for diabetic retinopathy screening. Diabetes Medicine: 84-90, (2004). 7. Niemeijer M, Ginneken VB, Russel S,
Suttorp-Schulten MSA and Abràmoff MD, Automated detection and differentiation of drusen, exudates, and cotton wool spots in digital color fundus photographs for early diagnosis of diabetic retinopathy. Investigative Ophthalmology and Visual Sciences 48(5):2260-67, (2007).
8. Biyani RS and Patre BMA, Clustering Approach for Exudates Detection in Screening of Diabetic Retinopathy,” Proc. Signal and information processing Vishnupuri, India, Int. Conf. IEEE:1-5, (2017).
9. Foracchia M, Grisan E and Ruggeri A, Detection of optic disc in retinal images by means of a geometrical model of vessel structure. IEEE Trans. on Medical Imaging 23(10): 1189–1195, (2005).
on mixture models to detect hard exudates. Medical Image Analysis 13: 650–658, (2009). 11. Sanchez C, Niemeijer M, Isgum I, Dumitrescu
A, Schulten S, Abramoff M and Ginneken B, Contextual computer-aided detection: Improving bright lesion detection in retinal images and coronary calcification
identification in CT scans. Medical Image Analysis, 16(1) :50–62, (2012).
12. Giancardo L, Meriaudeau F, Karnowski T, Li Y, Garg S, Tobin C and Chem E, Exudate-based diabetic macular edema detection in fundus images using publicly available datasets. Medical Image Analysis 16(1), 216–226, (2012).
13. Zhang X, Thibaulta G, Decencierea E, Marcoteguia B and Lay, Exudate detection in color retinal images for mass screening of diabetic retinopathy. Medical Image analysis 18(7):1026-1043. doi;10; 1016/j. media.2014.05.004, (2014).
14. Walter T, Klein JC, Massin P and Erginay A, A contribution of image processing to the diagnosis of diabetic retinopathy – detection
of exudates in color fundus images of the human retina. IEEE Trans. on Medical Imaging 21(10):1236–1243, (2002).
15. Ghaffar F and Uyyanonvara B, Detection of Exudates from Retinal Images Using Morphological Compact Tree. Proc. Int. Joint Conference on Computer Science and Software Engg., Khon Kaen, Thailand IEEE:1-5, (2016).
16. Sopharak A, Uyyanonvara B, Barman S and Williamson TH, Automatic detection of diabetic retinopathy exudates from non-dilated retinal images using mathematical morphology methods.” Computerized Medical Imaging and Graphics 32:720–727, (2008). 17. Harangi B, Antal B and Hajdu A, Automatic
exudate detection with improved Naýve-bayes
classifier.” Proc. Computer-Based Medical
Systems 25th International Symposium Rome, Italy, IEEE: 1–4, (2012).