Comparison of a double compression test for the
prediction of sensory texture attributes of cooked rice to
a single compression test
Arum Han1§, Youngseung Lee2§, Jean François Meullenet1*
1Department of Food Science, University of Arkansas, Fayetteville, AR, USA, 2Department of Food Science and Nutrition, Dankook University, Cheonan-si, Korea
§These authors contributed equally to this study
*Corresponding author:
Jean Francois Meullenet, Department of Food Science, University of Arkansas 2650 N. Young Avenue, Fayetteville, AR 72704. Phone: (479) 575-6822\Fax: (479) 575-6936. E-mail: [email protected]
Received: 06 March 2017; Revised: 19 September 2017; Accepted: 25 September 2017; Published Online: 03 October 2017
INTRODUCTION
Texture defined as “the sensory manifestation of the structure of food and the manner in which that structure reacts to applied force” (Szczesniak, 1987) plays a key role in rice for consumer palatability when consumed as whole grain (Calingacion et al., 2014; Li et al., 2016) although more than ten sensory attributes related to aroma and flavor that characterize rice quality have been identified (Champagne, 2008). As texture is considered as a multidimensional sensory attribute, it can be best perceived and measured by humans (Szczesniak, 1963). Thus, a trained sensory panel would be a useful tool to quantify the texture of cooked rice (Miao et al., 2016). However, training and maintaining a sensory panel is costly, extensive and excessively time-consuming as well as variability between human subjects exists. Therefore, there have been increasing demands in
methods capable of assessing cooked rice texture and a great deal of effort has been devoted to the development of instruments for the prediction of cooked rice texture (Li et al., 2016; Miao et al., 2016).
Instrumental methods found in the literature include the General Foods Texturometer (Okabe, 1979; Szczesniak and Hall, 1974), the Instron Food Tester (Juliano et al., 1981, 1984; Perez and Juliano, 1979, 1981), the Haake Consistometer (Kumar et al., 1976), various uniaxial compression tests (Champagne et al., 1998; Li et al., 2016; Sesmat and Meullenet, 2001), the Ottawa texture measuring system (Meullenet et al., 2000; Perez and Juliano, 1979; Rousset et al., 1995; Sitakalin and Meullenet, 2000), the Kramer shear cell (Juliano et al., 1981), the dynamic rheological testing (Li et al., 2016), and the two-bite instrumental test and Electromyography (Kohyama et al., 2016).
A number of instrumental means to predict cooked rice texture has been reviewed. However, little information has been reported as to a direct comparison for the two typical compression tests (double vs. single) in performance to predict cooked rice texture. This study was aimed at exploring the performance of a double compression (DC) and single compression (SC) test for predicting cooked rice texture and a potential use of Partial Least Square Regression (PLSR) for developing predictive models of specific texture attributes. Four different cultivars of rice stored for 32 weeks were used in this study. A total of 11 texture attributes of cooked rice in five stages were profiled by 7 trained descriptive panelists. Five sensory attributes (manual stickiness, initial cohesion, adhesion to lips, toothpull and hardness) showing significant differences by descriptive panel between rice samples over different storage time were finally predicted. The models by a DC and SC test were robust as well as discriminative and equivalent in performance for predicting texture of cooked rice. Both tests allowed the satisfactory prediction for adhesion to lips and toothpull and the moderate prediction for manual stickiness, initial cohesion and hardness. However, considering that it is routine assessments for rice breeders to predict mechanically rice texture quality, a SC test would have the advantage being less time-consuming over a DC test.
Keywords: Rice; Texture; Double compression test; Single compression test; Partial least square regression
A B S T R A C T
http://www.ejfa.me/Rice is the staple food of many countries and consumed by more than 3 billion people (Ghasemi et al., 2009; Prakash et al., 2005). In today’s global market, it is important for the U.S. industry to better understand rice quality characteristics, in particular textural characteristics. For example, in Japan, cooked rice adhesiveness or stickiness has been used as a quality index to evaluate rice.
Compression tests which require smaller amount of samples than the Ottawa extrusion test using bulk samples have been described by several researchers (Sesmat and Meullenet, 2001). Champagne et al. (1998) employed a double compression (DC) test in texture profile analysis with a Texture Analyzer using a cylindrical plunger to investigate postharvest processing effects on texture of cooked rice variety. A single compression (SC) test using a plunger in conjunction with a tensile testing machine has been used to examine the texture of 10 milled rices (Juliano et al., 1981). However, little information is available regarding a direct comparison of those two compression methods (DC vs. SC) in performance to predict cooked rice texture. Therefore, the objectives of this research were to evaluate (1) the compatibility of a DC and SC test for predicting cooked rice texture and (2) the use of Partial Least Square Regression (PLSR) for developing predictive models of specific texture attributes.
MATERIALS AND METHODS
Samples collection
Four rice cultivars (Bengal, Cypress, Cocodrie, and Francis) were harvested from the University of Arkansas Rice Research and Extension Center. The harvest moisture content (MC) of the rice samples ranged from 18 to 20%. Rice samples were brought to the University of Arkansas Rice Processing Laboratories and cleaned with a Carter-Day Dockage Tester (Carter-Carter-Day Co., Minneapolis, MN). Samples were dried in an equilibrium moisture content chamber (EMC) at 21oC and 50% relative humidity to 12% of MC. The samples were then divided into aliquots for each predetermined storage duration and placed in Ziploc bags, placed in plastic boxes and stored in the same EMC chamber. The samples were pulled for evaluation after 0, 4, 8, 12, 18, 24, and 36 weeks of storage. The storage treatments imposed and various cultivars used were thought to provide enough variation in texture to provide a meaningful comparison of the various instrumental methods studied.
Rough rice was dehulled with a Satake lab huller (THU, Satake, Japan). Then, the samples for the instrumental measurements were milled through a McGill No. 2 for 30 s and those for the sensory evaluation were milled in a
continuous mill (MC-250, Satake, Japan). The degree of milling for the rice samples milled by the McGill No.2 and the continuous mill were set over 90% at the beginning of the storage duration. After that the rice samples were milled using the same conditions.
Size measurements of milled rice kernel
A Satake Rice Image Analyzer (NaiS image checker 30R, Matsushita Electric Works, Ltd.) was used to measure the length, width, and thickness of one hundred intact milled rice kernels for each cultivar (Bengal, Cypress, Cocodrie, and Francis) at each of the storage durations (0, 4, 8, 12, 18, 24 and 36 weeks). The medium grain rice samples were not used for this analysis because the chemical components are significantly different from the long grain rice samples (data not shown) and this difference may have a larger impact on hardness and stickiness than the kernel size.
Sensory analysis
Sample preparation
Rice samples were cooked with a constant rice to water ratio of 1:2.0 (w/w). Three hundred grams of milled rice was cooked in a household rice cooker (SR-W10FN, National, Japan) until the rice cooker switched off automatically to the warm position. Then, rice samples were conditioned for 5 min. The cooked samples were immediately mixed with a plastic rice dipper before being presented to panelists at 75 ± 2oC. Samples were presented in 177-ml preheated glass bowls insulated with styrofoam cups and covered with 125-mm watch glasses labeled with three digit codes.
Sensory methodology
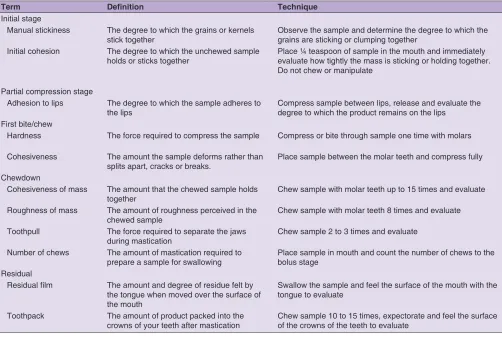
Seven trained panelists with at least two years of experience in descriptive analysis and trained according to the Spectrum methodology (Sensory Spectrum, Chatham, NJ) evaluated 11 texture attributes of cooked rice in five stages. The attributes and their definitions are described in Table 1. Among the texture attributes, manual stickiness, initial cohesion, adhesion to lips, toothpull, and hardness were selected to be subsequently analyzed for this study because the main focus with the instrumental methods were stickiness and hardness, and those sensory attributes mentioned previously besides hardness are mainly considered as related to rice stickiness. Panelists used a computerized sen sory analysis system to record their responses on a 15-point intensity scale using numbers with one significant digit to quantify sensory attributes. References were provided to panelists for specific attributes.
were presented one at a time to the panelists who sat in individual booths featuring incandescent lighting and positive pressure. The panelists evaluated each sample twice on two consecutive testing sessions.
Instrumental texture analysis
Sample preparation
The rice samples were cooked in a household rice cooker/ steamer (ARC – 707, Aroma, China) with 10 g of milled rice and 17 g of water in a 100-ml beaker. The beaker was placed on a screen inside of the rice cooker with boiling water. The sample was cooked under steaming conditions for 30 min, and then the rice cooker was set on its warm position for 5 min before testing. This method was employed to simulate conditions that a breeder may employ to test the texture quality of breeding lines.
Double compression test
A DC test was performed with a Texture Analyzer (TA-XTplus, Texture Technologies Corp., Scarsdale, NY) equipped with the Texture Exponent 32 data acquisition software (Stable Micro Systems Ltd., Surrey, England). For this method, ten intact cooked rice kernels were selected from the beaker and placed on the heavy duty base (TA-90) of the texture analyzer. For each rice cultivar, two aliquots
were cooked and six measurements were taken from each aliquot. The clearance between the flat compression plate (100-mm diameter) and the base was set at 20 mm. A 25-kg maximum load cell was used. The rice samples were compressed twice to a 90% deformation with a test speed of 0.5 mm/s and trigger force of 0.6 N. The data were reported as a force-time curve (Fig. 1) with two major compression peaks obtained from the first and second compression. A total of nine instrumental parameters were extracted from the curve. There was one negative peak for each compression, indicative of adhesive forces. The maximum compression force and the area under the negative portion of the curve for the first compression cycle were taken as instrumental measurements of hardness (H1) and stickiness (A2), respectively. In addition to the parameters mentioned previously, parameters such as T1 (time to compress the original sample to 90% deformation), T2 (time to compress the sample to 90 % deformation), A1, A3, A4, H2, and H3 (Fig. 1) were also used to predict sensory attributes with PLSR. That is, nine instrumental parameters were treated as x variables, while each sensory attribute was as y variables. In this case, PLSR was used to avoid overfitting. Each cultivar at its respective storage duration was cooked twice, and six measurements were taken for each cook.
Table 1: Vocabulary for sensory texture attributes of cooked rice
Term Definition Technique
Initial stage
Manual stickiness The degree to which the grains or kernels
stick together Observe the sample and determine the degree to which the grains are sticking or clumping together Initial cohesion The degree to which the unchewed sample
holds or sticks together Place ¼ teaspoon of sample in the mouth and immediately evaluate how tightly the mass is sticking or holding together. Do not chew or manipulate
Partial compression stage
Adhesion to lips The degree to which the sample adheres to
the lips Compress sample between lips, release and evaluate the degree to which the product remains on the lips First bite/chew
Hardness The force required to compress the sample Compress or bite through sample one time with molars
Cohesiveness The amount the sample deforms rather than
splits apart, cracks or breaks. Place sample between the molar teeth and compress fully Chewdown
Cohesiveness of mass The amount that the chewed sample holds
together Chew sample with molar teeth up to 15 times and evaluate Roughness of mass The amount of roughness perceived in the
chewed sample Chew sample with molar teeth 8 times and evaluate Toothpull The force required to separate the jaws
during mastication Chew sample 2 to 3 times and evaluate Number of chews The amount of mastication required to
prepare a sample for swallowing Place sample in mouth and count the number of chews to the bolus stage Residual
Residual film The amount and degree of residue felt by the tongue when moved over the surface of the mouth
Swallow the sample and feel the surface of the mouth with the tongue to evaluate
Toothpack The amount of product packed into the
Single compression test
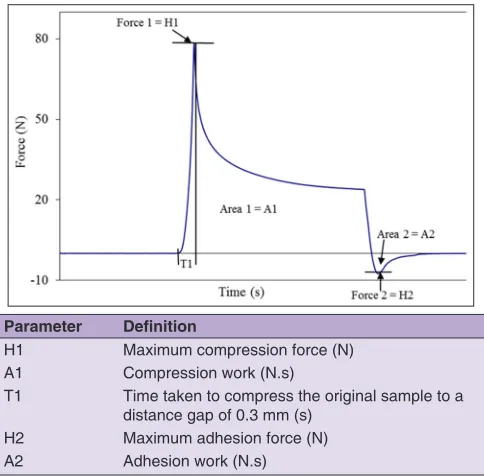
The method for the SC test was similar to that for the DC test with the exceptions that the rice samples were compressed only once, the flat compression plate traveled to a constant bottom gap of 0.3 mm, and that the compression plate was held immobile at the bottom of the compression cycle for 5 s. The flat compression plate (100 mm diameter) was calibrated to a height of 20 mm. Therefore, the flat compression plate traveled to a set distance of 19.7 mm. This SC test with a fixed distance gap was used because it was thought that the shape and size of the cooked rice could affect the trigger point, which for the DC test was set to 0.6N. The crosshead speed for the SC test was set at 5.0 mm/s. The SC test produced a force-time curve with one compression and one adhesion peak (Fig. 2). From this curve, H1 and A2 were used to predict hardness and stickiness respectively. In addition to the instrumental parameters mentioned previously, A1, T1 and H2 were also used to predict sensory attributes with PLSR. For each rice cultivar, two aliquots of rice samples were cooked separately, and six measurements were taken from each aliquot.
Statistical analysis
A correlation analysis between the milled rice kernel size and the instrumental parameters (H1, A2) was performed using PROC CORR in SAS. The PLSR models between the instrumental methods and sensory analysis were determined using the multivariate analysis software Unscrambler (version 7.5, CAMO, Trondheim, Norway). Depending on the sensory attributes, specific instrumental parameters were chosen to determine the PLS regression model. The instrumental parameters that were used from a DC test to predict manual stickiness, initial cohesion, adhesion to lips, and toothpull (which represents stickiness), were T1, A2, H2, T2, and A4 (Fig. 1) while the parameters used from a SC test to predict the sensory attributes related to stickiness were H2 and A2 (Fig. 2). The instrumental parameters that were used to determine the PLSR model for hardness with data from a DC test were A1, A3, H1, H3, T1, and T2. For a SC test, A1 and H1 were used to predict hardness. All the variables were centered and weighted by the reciprocal of their standard deviation (i.e. standardized), giving each variable the same chance to influence the predictive models. A full cross-validation method was used to determine the robustness of the model predicting texture characteristics. Various statistical index was calculated to estimate a model robustness or stability. That is, the coefficient of determination for calibration (R2
cal) and validation (R2val), root mean square error of calibration (RMSEC) and root mean square error of prediction (RMSEP), the ratio of RMSEC and RMSEP (robustness), and discrimination index, all of which are typical assessors that have been Parameter Definition
H1 Maximum compression force for the first
compression cycle (N)
A1 Compression work for the first compression
cycle (N.s)
T1 Time to compress the original sample to 90% deformation (s)
H2 Maximum adhesion during the platen return of the
first compression cycle (N)
A2 Adhesion work for the first compression cycle (N.s)
T2 Time to compress the sample to 90% deformation (2nd compression cycle) (s) H3 Maximum compression force for the second
compression cycle (N)
A3 Compression work for the second compression cycle (N.s)
A4 Adhesion work for the second compression cycle (N.s)
Fig 2. A typical force-time curve by a single compression test with parameters.
Parameter Definition
H1 Maximum compression force (N) A1 Compression work (N.s)
T1 Time taken to compress the original sample to a distance gap of 0.3 mm (s)
H2 Maximum adhesion force (N) A2 Adhesion work (N.s)
reported as model performance indicators (Sesmat and Meullenet, 2001; Sitakalin and Meullenet, 2000). Weighted regression coefficients (WRC) helped determine the most important instrumental variables to predict the various sensory attributes. Large absolute values indicated large importance, while the coefficients closest to zero indicated unimportant variables.
RESULTS AND DISCUSSION
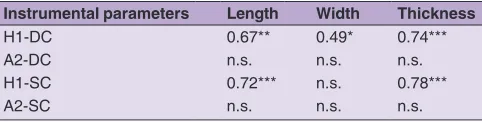
First of all, it was decided to analyze the correlation between the intact milled rice kernel size (length, width, and thickness) and the instrumental parameters of hardness and stickiness, which have been reported to be the most dominant attribute in affecting cooked rice texture (Yu et al., 2017). These correlations were assessed because the cooked rice kernel dimensions could influence the reaction forces observed during instrumental testing. For example, a plump kernel deformed to 90% of its original height would have a greater area of contact with the compression plate than a smaller kernel. The results showed that both length and thickness of milled-rice kernels are significantly and positively correlated with the instrumental hardness measurements, but not with stickiness (Table 2). This is somewhat expected since instrumental stickiness is the adhesive force between the surface of rice and the surface of probe. Thus, the effect of rice sample sizes would be minimal on the stickiness which is assessed when a probe is lifted up again after the rice samples are completely compressed. On the other hand, instrumental hardness measured as a maximal force required to break or deform the rice samples is more likely to be influenced by rice sample sizes. These results imply that milled-rice kernel size can be a factor in measuring the hardness of cooked rice when using uniaxial compression on a set number of kernels. It is interesting to note that kernel size should be considered in this type of analysis and that cultivars of greatly different size may not be adequately compared using compression tests. For this reason, rice kernels were completely randomized for each of the treatments to minimize sample size effects on an instrumental hardness in this study.
Significant differences between rice samples over different storage time were observed for manual stickiness, initial cohesion, adhesion to lips, toothpull and hardness by descriptive panel (data not shown). Prediction of the five sensory attributes mentioned above from multiple instrumental parameters for a DC and SC test was performed using PLSR, respectively. This analysis was undertaken because poor modeling results was expected to obtain using ordinary linear square regression (Lee et al., 2008). As shown in Table 3, various parameters were employed to assess the performance of models established by a DC and SC test, respectively. All the models established were robust showing robustness values very close to 1. Furthermore, although discrimination index values greater than 2.0 have been reported to be discriminative (Lee et al., 2008), manual stickiness, adhesion to lips, and toothpull were found to be more discriminative than other sensory attributes for both compression tests (Table 3).
Manual stickiness (R2
cal = 0.52, R2val = 0.41 for a DC; R2
cal = 0.45, R2val = 0.36 for a SC) and initial cohesion (R2
cal = 0.45, R2val = 0.28 for a DC; R2cal = 0.52, R2val = 0.45 for a SC) were moderately predicted. Meullenet et al. (2000) found sensory stickiness of cooked rice to be well predicted using an extrusion test, showing the RAP (Relative Ability of Prediction values) of 0.76. They attributed the reliable prediction of rice stickiness to the fact that the starch leaching from individual rice kernels was not rinsed after cooking, which was the identical protocol for cooking as in this study. The WRC for predicting manual stickiness from a DC and SC tests were similar, showing that T1, H2, and A2 were the most important predictor, which was positively correlated with manual stickiness. For the prediction of initial cohesion, the A4 obtained from a DC test was the most dominant contributor and negatively correlated with initial cohesion (Table 4). The A4 defined as “a work for the second compression cycle” is not generated for the SC test, but for the DC test, implying that lower R2
val (0.28) and higher robustness values (1.20) might be attributed to this parameter in the DC test.
Adhesion to lips was well predicted using instrumental parameters from a DC test (R2
cal = 0.76, R2val = 0.69) and a SC test (R2
cal = 0.79, R2val = 0.72, Table 3). The WRT to predict adhesion to lips by the DC test showed that T1, H2 and A2 were the most important contributors (Table 4), while the WRT for the SC test showed that the parameter A2 was the most important contributor in predicting adhesion to lips (Table 4). It is encouraging to note that the A2 was one of the most important contributors to predict adhesion to lips by the DC and SC tests, since A2 (work for the first compression cycle) is commonly used as instrumental assessment of cooked rice stickiness. Although the use of additional model Table 2: Correlation coefficients for the correlation between
the milled rice kernel size and the instrumental parameters Instrumental parameters Length Width Thickness
H1-DC 0.67** 0.49* 0.74***
A2-DC n.s. n.s. n.s.
H1-SC 0.72*** n.s. 0.78***
A2-SC n.s. n.s. n.s.
H1-DC: Hardness by a double compression, A2-DC: Stickiness by a double compression, H1-SC: Hardness by a single compression, A2-SC: Stickiness by a single compression. ***P<0.001, **P<0.01, *P<0.05
parameters slightly increased the model statistics from an R2 of 0.72 when using A2 alone to R2 of 0.79 when using additional parameters, the increase in R2 was not drastic (Table 3). Since the models were overall satisfactory for both tests, this indicates that the experimental conditions for the both tests seem to be adequate for measuring rice stickiness. However, it should be noted that there was a discrepancy in T1 between the two tests. The T1 values for the adhesion to lips from a DC and SC test were 0.21 and -0.49, respectively (Table 4). This was because the T1 was calculated in a different manner for the respective test to work on. The T1 for a DT test was defined as “time to compress the original sample to 90% deformation”, while “time taken to compress the original sample to a distance gap of 0.3 mm” was how the T1 in a ST test was calculated (Fig 1 and 2). Negative values in weighted
regression coefficients for instrumental parameters used in the prediction model (Table 4) indicates that as the negative values of instrumental parameters increase, the corresponding sensory attributes to be predicted decrease.
The prediction of toothpull was also improved by the use of multiple regression parameters for both tests (R2
cal = 0.76, R2val = 0.61-0.71). The WRC for predicting toothpull by both tests showed that A2 was the most important contributor. Both toothpull and adhesion to lips were the attributes that were the most well predicted by instrumental parameters. Recall that for a SC test, the compression fixture was held still for 5 s at the bottom of the compression. This holding duration may have had a positive effect on the correlation with adhesion to lips and toothpull. We hypothesize that the holding duration allowed Table 3: Model statistics for predicting sensory texture attributes by instrumental texture parameters using partial least square regression
Instrumental methods Parameter Manual stickiness Initial cohesion Adhesion to lips Toothpull Hardness Double compression R2
cal 0.52 0.45 0.76 0.76 0.59
R2
val 0.41 0.28 0.69 0.61 0.37
RMSEP 0.25 0.53 0.58 0.16 0.38
RMSEC 0.23 0.44 0.51 0.14 0.30
Robustness 1.09 1.20 1.14 1.14 1.27
SD 1.07 1.28 2.06 0.57 0.88
RPD 4.28 2.42 3.55 3.56 2.32
PC 1 2 1 1 5
Single compression R2
cal 0.45 0.52 0.79 0.76 0.44
R2
val 0.36 0.45 0.72 0.71 0.25
RMSEP 0.26 0.42 0.55 0.14 0.40
RMSEC 0.24 0.39 0.47 0.13 0.36
Robustness 1.08 1.08 1.17 1.08 1.11
SD 1.07 1.28 2.06 0.57 0.88
RPD 4.12 3.05 3.75 4.07 2.20
PC 1 1 2 2 2
The instrumental parameters used to predict the sensory attributes are mentioned in statistical analysis. R2
cal: Calibration coefficient of determination, R2
val: Validation coefficient of determination (full cross‑validation), RMSEP: Root mean square error of prediction, RMSEC: Root mean square error of calibration, Robustness: RMSEP/RMSEC, SD : standard deviation of the sensory intensities across all samples for a particular attribute, RPD : discrimination index (SD/RMSEP), PC : The number of principal components chosen in the regression model that explains most of the variation in sensory attributes
Table 4: Weighted regression coefficients for instrumental parameters used in the prediction model
Instrumental tests Parameters Manual stickiness Initial cohesion Adhesion to lips Toothpull Hardness
Double compression T1* 0.17 0.21 0.21 0.17 −1.71
H1 - - - - −2.51
A1 - - - - 3.93
T2 −0.13 −0.08 −0.14 0.25 −0.24
H2 0.18 0.31 0.23 0.33
-A2 0.18 0.34 0.23 0.42
-H3 - - - - −0.51
A3 - - - - -1.30
A4 0.17 −0.51 0.16 0.13
-Single compression T1* 0.22 0.25 −0.49 -0.45 −0.57
H1 - - - - −0.06
A1 - - - - 0.11
H2 0.23 0.24 0.16 -0.02
-A2 0.23 0.25 1.19 1.29
for the sample to more readily adhere to the compression fixture. This could be because the compression platen was stopped at the bottom of the compression cycle, perhaps allowing the rice to more fully adhere to the platen.
Hardness is the sensory attribute which is the most commonly predicted by instrumental methods. The prediction model for hardness by a DC test was moderate (R2
cal = 0.59, R2val = 0.37), while a poor prediction model was obtained for a SC (R2
cal = 0.44, R2val =.25 for a SC). Satisfactory prediction models for the hardness of cooked rice were reported by some other studies. Meullenet et al. (1998) reported the hardness (R2=0.62) and tootpack (R2=0.70) for cooked rice of different varieties were the attributes most effectively predicted by an extrusion test. Sitakalin and Meullenet (2000) also found that the hardness for cooked rice from two cultivars was well predicted (RAP=0.85, 0.74 for each test) using both an extrusion test and compression test. A possible explanation for the poor prediction of hardness by a SC test in this study could be two reasons. First, differences in hardness between rice samples were not large enough so that it would be more difficult to predict hardness from an instrumental test when rice samples exhibit small or no differences. Results from descriptive sensory data indicate that the smallest ranges of scores (data not shown) between rice samples evaluated were reported for hardness. Second, performances of the 2 different tests could be a reason. An extrusion test may have a better performance in predicting cooked rice hardness than a SC test. This result is supported by previous research (Meullenet et al., 1998; Sitakalin and Meullenet, 2000) showing that a forward extrusion test had good potential to predict sensory attributes in cooked rice, especially hardness. The WRC for predicting hardness by a DC test showed that A1 (compression work for the first compression cycle) was the most important contributor (Table 4). This was in agreement with the research by Meullenet et al. (1998) who reported the maximum load and maximum slope were important instrumental parameters for the prediction of food hardness.
CONCLUSIONS
Overall, the models established by a DC and SC test using the PLSR were robust as well as discriminative and equivalent in performance for predicting texture of cooked rice. Both tests allowed the satisfactory prediction for adhesion to lips and toothpull and the moderate prediction for manual stickiness, initial cohesion and hardness. However, considering that it is routine assessments for rice breeders to predict rice texture quality in a mechanical way, a SC test would have the advantage being less time-consuming over a DC test. Results also showed that T1
was one of the major contributors to predict texture attributes of cooked rice, which was in agreement with previous studies.
ACKNOWLEDGEMENTS
This work was carried out with the support of “Cooperative Research Program for Agriculture Science & Technology Development (Project No. PJ011239032016)” Rural Development Administration, Republic of Korea.
REFERENCES
Calingacion, M., A. Laborte, A. Nelson, A. Resurreccion, J. C. Concepcion and V. D. Daygon. 2014. Diversity of global rice markets and the science required for consumer-targeted rice breeding. PLoS One. 9: e85106.
Champagne, E. T., B. G. Lyon, B. K. Min, B. T. Vinyard, K. L. Bett, F. E. Barton, B. D. Webb, A. M. McClung, K. A. Moldenhauer, S. Linscombe, K. S. McKeinzie and D. E. Kohlwey. 1998. Effects of postharvest processing on texture profile analysis of cooked rice. Cereal Chem. 75(2): 181-186.
Champagne, E. T. 2008. Rice aroma and flavor: A literature review. Cereal Chem. 85(4): 445-454.
Juliano, B. O., C. M. Perez, S. Barber, A. B. Blakeney, T. Iwasaki, N. Shibuya, K. K. Keneaster, S. Chung, B. Laignelet, B. Launay, A. M. Del Mundo, H. Susuki, J. Shiki, S. Tsuji, J. Tokoyama, K. Tatsumi and B. D. Webb. 1981. International cooperative comparison of instrument methods for cooked rice texture. J. Texture Stud. 12: 17-38.
Ghasemi, E., M. T. H. Mosavian and M. H. H. Khodaparast. 2009. Effect of stewing in cooking step on textural and morphological properties of cooked rice. Rice Sci. 16: 243-246.
Juliano, B. O., C. M. Perez, E. P. Alyoshin, V. B. Romanov, A. B. Blakeney, L. A. Welsh, N. H. Choudhury, L. L. Delgado, T. Iwasaki, N. Shibuya, A. P. Mossman, B. Siwi, D. S. Damardjati, H. Suzuki and H. Kimura. 1984. International cooperative test on texture of cooked rice. J. Texture Stud. 15: 357-376.
Kohyama, K., N. S. Sodhi, K. Suzuki and T. Sasaki. 2016. Texture evaluation of cooked rice prepared from Japanese cultivars using two-bite instrumental test and electromyography. J. Texture Stud. 47: 188-198.
Kumar, B. M., J. K. Upadhyay and K. R. Bhattacharya. 1976. Objective tests for the stickiness of cooked rice. J. Texture Stud. 7: 271-278.
Li, H., T. M. Prakash, M. A. Nicholson, R. Fitzgerald and R. G. Gilbert. 2016. Instrumental measurement of cooked rice texture by dynamic rheological testing and its relation to the fine structure of rice starch. Carbohydr. Polym. 146: 253-263.
Lee, Y. S., C. M. Owens and J. F. Meullenet. 2008. A novel laser air puff and shape profile method for predicting tenderness of broiler breast meat. Poult. Sci. 87: 1451-1457.
Meullenet, J. F., J. Gross, B. P. Marks and M. Daniels. 1998. Sensory descriptive texture analyses of cooked rice and its correlation to instrumental parameters using an extrusion cell. Cereal Chem. 75(5): 714-720.
Miao, W., W. Lufeng, X. Xiaoyun and P. Siyi. 2016. Evaluation of cooked rice texture using a novel sampling technique. Measurement. 89: 21-27.
Okabe, M. 1979. Texture measurements of cooked rice and its relationship to the eating quality. J. Texture Stud. 10: 131-152. Perez, C. M. and B. O. Juliano. 1979. Indicators of eating quality for
non-waxy rices. Food Chem. 4: 185-195.
Perez, C. M. and B. O. Juliano. 1981. Texture changes and storage of rice. J. Texture Stud. 12: 321-333.
Prakash, M., R. Ravi, H. S. Sathish, J. C. Shyamala, M. A. Shwetha and G. C. P. Rangarao. 2005. Sensory and instrumental texture measurement of thermally processed rice. J. Sensory Stud. 20(5): 410-420.
Rousset, S., B. Pons and C. Pilandon. 1995. Sensory texture profile, grain physico-chemical characteristics and instrumental measurements of cooked rice. J. Texture Stud. 26: 119-135. Sesmat, A. and J. F. Meullenet. 2001. Prediction of rice sensory
texture attributes from a single compression test, multivariate
regression and a stepwise model optimization method. J. Food Sci. 66: 124-131.
Sitakalin, C. and J. F. Meullenet. 2000. Prediction of cooked rice texture using extrusion and compression tests in conjunction with spectral stress strain analysis. Cereal Chem. 77: 501-506.
Szczesniak, A. S. 1963. Objective measurements of food texture. J. Food Sci. 28: 410-420.
Szczesniak, A. S. and B. J. Hall. 1974. Application of the general food texturometer to specific food products. J. Texture Stud. 6: 117-138.
Szczesniak, A. S. 1987. Correlating sensory with instrumental texture measurements-an overview of recent developments. J. Texture Stud. 18: 1-15.