Article
Beyond
Ʌ
CDM: a viable alternative?
Michael Paul Gough
Department of Engineering and Design, University of Sussex, Brighton, BN1 9QT, UK. E-Mail: [email protected]
Abstract. We are encouraged to look beyond ɅCDM as there are no satisfactory explanations for either dark energy or dark matter. A data centred phenomenological approach supports an explanation where dark energy is Holographic Dark Information Energy, HDIE. HDIE explains many effects attributed separately to Ʌ and CDM. HDIE mimics Ʌ with sufficient energy and an equation of state parameter, w= -1.03±0.05 at redshifts z<1.35 to account for accelerating expansion. HDIE is clumped around galaxies at densities that distort space-time, explaining many CDM attributed effects. The present ratio of HDIE/baryons ~2.15, required for the observed expansion history, is equivalent to a dark matter fraction ~68%, consistent with many galaxies. The HDIE/baryon model is based largely on proven physics, provides a common explanation for dark energy and dark matter, and solves the cosmological coincidence problem. At earlier times, z > ~1.35, HDIE was phantom, w = -1.82±0.08, enabling the model to be falsified. HDIE fits Planck dark energy wo-wa plots at least as well as Ʌ, and is consistent with other results that suggest dark energy was phantom at earlier times. A new w-parameterisation is proposed, as the usual CPL parameterisation is biased and unsuitable for distinguishing between HDIE/baryon and ɅCDM models.
Keywords: cosmology; dark energy; dark matter; cosmological constant problem
1. Introduction.
ESA Planck results [1-3] are compatible with a flat universe containing 68.3% dark energy, DE, 26.8% dark matter, DM, and only 4.9% ordinary baryonic matter. In the popular "concordance", or standard model, ɅCDM, the dark components DE and DM are provided by Einstein's cosmological constant,Ʌ, and cold dark matter, CDM, respectively.
The observed accelerating expansion of the universe [4,5] is explained by the action of a DE that exhibits a near constant overall energy density, at least in recent times, and thus has been naturally associated with the cosmological constant, Ʌ, the energy of a vacuum [6-10]. Theoretical attempts to account for the required DE energy density are out by very many orders of magnitude, and even a zero valued cosmological constant is considered more likely than the observed value [8]. The cosmological constant explanation leads us to assume a spatially constant energy density throughout the universe. However, we only know from universe acceleration that total DE increased in near proportion to universe volume over recent times. We do not know how DE is distributed.
Observed galaxy spin profiles and gravitational lensing effects require significantly stronger gravitational effects than can be provided by visible baryon matter alone. These effects have been naturally attributed to DM, an as yet unidentified species of particles that are difficult to observe
as they experience negligible interaction with ordinary matter or electromagnetic radiation. Various explanations for DM have considered a range of possible particle types [11] including: weakly interacting massive particles (WIMPS), neutralinos, asymmetric dark matter, MACHOS, axions, and others. Many techniques are being applied with continually improving sensitivity to search for DM [12], ranging from attempts to directly detect DM particles with large volume detectors in quiet locations, attempts to create DM particles inside high energy particle colliders, and attempts to detect radiation generated when DM particles interact with each other, or annihilate. A small residual excess of gamma rays from the galactic centre [13], initially thought to result from DM annihilation, is now considered to be explained by a population of neutron stars or pulsars [14,15]. Extra-galactic gamma rays studied with 6 years of data from the Fermi Large Area Telescope [16] have shown no evidence for DM. The most sensitive WIMP detectors to date, Xenon100 [17], LUX [18], PandaX-II [19], and PICO-60[20] have all failed to detect any DM particles.
DE and DM represent the core of the ɅCDM concordance model, at a combined 95% of the universe, but satisfactory explanations for both phenomena continue to elude us [21,22]. We are therefore encouraged to consider other possibilities, however radical they may at first appear. Accordingly, in this work we ask the question "do we need dark matter?". We suggest that DE may not be evenly distributed but clumped around the structures of ordinary matter. All of the experimental evidence for DM is based solely on its gravitational effects, via gravitational distortions of space-time [12]. Clumps of DE could also produce DM like effects, since such significant concentrations of energy will distort space-time in exactly the same way as an energy equivalent quantity of matter. In this way we may consider a universe consisting primarily of DE and baryons, without the need to invoke the existence of any exotic DM particle species.
Previously it was assumed that the negative pressure aspect of increasing total DE with increasing volume on the universe scale would not allow DE to become clumped. The form of DE proposed here will be clumped and gravitationally attractive on the local scale of galaxies and galaxy clusters, but will exert an overall repulsive effect in the universe. Note that this approach differs from MOND [23] and Dark Fluid [24] theories in that it does not require any extensions or modifications to gravity theory, nor does it introduce new physics.
One model already shown capable of quantitatively explaining DE is holographic dark information energy, HDIE [25-27], essentially the energy equivalence of the information, or 'entropic energy', carried by the universe's baryons. Every baryon effectively carries bits of information [28] and each bit of information has an energy equivalence [29-34]. In recent times, redshift z<~1, HDIE exhibits a near constant overall energy density, corresponding to an equation of state parameter, w~-1, and compatible with the Planck 2013 data release [1,27]. Such a source of DE is naturally concentrated around the high temperature structures of ordinary matter: stellar heated gas and dust, stars, galaxies, and galaxy clusters. HDIE has been shown to be strong enough to explain DE and, as it is clumped around structures, these locally enhanced energy densities must add significant additional distortions to space-time in the vicinity of those structures to produce effects that mimic DM.
The aim of this paper is to show that an HDIE/baryon model might account for all of the
observations previously attributed separately to Ʌ and CDM. The HDIE/baryon model
replaced with just one phenomenon that has a present energy density quantitatively explained by proven physics.
In sections 2.1 and 2.2 we summarize and update previous HDIE work [27], adding the latest stellar mass density data, to reaffirm that HDIE can explain DE. Section 2.3 extends this DE explanation to show how HDIE might also explain effects previously attributed to DM. Section 2.4 summarises the potential advantages of the HDIE/baryon model over the ɅCDM model. Section 3 then considers the problem of experimentally distinguishing between the two models, identifies limitations of existing data and data parameterisations, and concludes with the suggestion of a simple preferred parameterisation to achieve this distinction.
2. Proposed HDIE/baryon model
2.1 Information energy in the universe.
Landauer [29,30] argued that information is physical with a minimum energy equivalence of
kBTln2 per bit, where kB is Boltzmann's constant and T is temperature. Recent laboratory
experiments [35-37] have indeed confirmed Landauer's principle by clearly demonstrating this minimum quantity of heat is dissipated when information is erased. Landauer's principle is, in effect, just an expression of the second law of thermodynamics, since information and entropy are identical for the same degrees of freedom, with the only difference in measurement units (1bit=ln2 nats). Note entropy or information carried by nature is a scalar field.
Table 1. lists the relevant information components of the universe, together with estimates of the quantity of information, N, associated with each [25-27,38,39], representative temperatures, T, and their resulting information energy, N kB T ln2 contributions.
Information,
N bits
Temperature
ToK
Information Energy
NkB T ln2,Joules
Relics of Big Bang
CMB photons 1088 – 2 × 1089 2.7 3 × 1065 – 6 × 1066 Relic neutrinos 1088 – 5 × 1089 2 2 × 1065– 1067 Relic gravitons 1086 – 6 × 1087 ~1? 1063 – 6 × 1064
Dark matter Cold dark matter ~2 × 1088 <102 ? < 1067
Star formation
1022 stars 1079 – 1081 ~107 1063 – 1065 Stellar heated gas and dust ~1086 ~106-108 ~1069 - 1071
Black Holes
Stellar sized BH 1097 – 6 × 1097 ~10−7 1067 – 6 × 1067
Super massive BH 10
102 – 3 ×
10104 ~10
−14 1065 – 3 × 1067
Universe Holographic bound ~10124 - -
Table 1. Universe information content, temperature, and information energy contributions
We see from Table 1 that stellar heated gas and dust, at 1069-1071 J, makes the largest
information energy contribution to the universe. Although the values of Table 1. are only order of magnitude estimates, we can expect the information energy of stellar heated gas and dust to play a significant role in the universe, since this quantity of energy is of a comparable magnitude to the ~1070 J energy equivalence of the universe's ~1053 kg of ordinary matter.
2.2 HDIE as Dark Energy.
As the universe expanded the energy density of matter fell as a-3, where a is the universe
scale factor (a=1 today and related to redshift, z, by a=1/(1+z) ). In order to explain the observed change from decelerating expansion to accelerating expansion in the second half of the universe's history [1-3], we require a DE of near constant average energy density, with an energy today ~2.15 times the matter energy. Within the uncertainties of the estimates of Table 1. we can see that the information energy contribution from stellar heated gas and dust is roughly of the order of magnitude that could account for DE today. Then, we need to show that, in recent times, HDIE also possesses a near constant average energy density with an equation of state parameter, w ~-1, or a total DE energy that increased as ~a3.
The information energy of stellar heated gas and dust varies over time dependant on just two parameters: information content N, and average temperature T. Here we assume that T will be governed by the extent of star formation, or the fraction of baryons that are now in stars, while
N for any given volume of space is set by a generalised Holographic principle [40-42] as proportional to the bounding area of that space, N α a2. The Holographic principle is well
established for black holes at the holographic bound [43], but is also considered [42] to apply to any region of space, with recent CMB data analysis emphasizing the evidence for a holographic universe [44], even though the universe is many orders of magnitude below the holographic bound (see Table 1.).
In figure 1 we plot a survey of measured stellar mass densities per co-moving volume as a function of scale size, a. The filled symbols [45-61] correspond to data compiled for a recent survey of stellar formation measurements (Table 2 of [62]). A subset of these data was already included in previous HDIE work [25-27], and open symbols [63-74] correspond to those measurements used in that previous HDIE work but not included in this recent survey.
There is a clear growth in star formation with approximately one half of today's stars formed before redshift, z=1.3, and 25% formed after z=0.7. Despite considerable scatter in measured values there appears to be a significant change around redshift, z ~1.35 from a steep gradient in the past to a weaker gradient in recent times. Fitting straight line power laws (red lines, in Fig.1.) to data points either side of z=1.35, we find power law fits of a+1.08±0.16 for z<1.35, and a+3.46±0.23, for
z>1.35.
Then we can assume average baryon temperature, T, is proportional to the fraction of baryons in stars and thus also varied as a+1.08±0.16 for z<1.35. Thus the total stellar heated gas and
dust information energy (αNT ) varied as a+3.08±0.16, corresponding to near constant energy density,
or an equation of state parameter, value w=-1.03±0.05. In comparison, total information energy in the earlier period, z>1.35, varied as a+5.46±0.23, corresponding to a phantom energy with w=
-1.82±0.08.
We see that stellar heated gas and dust in the recent period, z<1.35, could then explain DE, since T closely follows the a+1 gradient that would lead to a total HDIE varying as a+3, to
Fig.1. Review of stellar mass density measurements for co-moving volumes as a function of scale size, a. Plotted lines: two red straight lines, power law fits a+1.08±0.16 , (w= -1.03±0.05) for
z<1.35, a+3.46± 0.23, (w= -1.82±0.08) for z>1.35; black line, the variation that would be required for
It is worth noting some further consequences of an HDIE explanation for DE. Star formation had to have advanced sufficiently before HDIE was strong enough to affect universe expansion. Star formation had also to have advanced sufficiently for the likelihood of intelligent beings evolving to observe an accelerating expanding universe. Then HDIE effectively solves the "why now?" cosmological coincidence problem.
The advent of accelerating expansion has been associated [75,76] with causing a general reduction in galaxy merging, and structure formation, evident in Fig.1 as the stellar mass density gradient changing from a+3.46±0.23 to a+1.08±0.16. Once HDIE was strong enough to initiate acceleration,
this in turn inhibited star formation and consequently limited HDIE itself. We expect this feedback mechanism to naturally cap the star formation gradient around a stable value ~ a+1,
constraining energy density to a constant value around the observed DE energy density. Feedback from HDIE could therefore explain the timing of the change in stellar formation rate around z~1.35, the power law value after z~1.35, and the present ratio of DE energy to matter energy.
It is usually assumed that, if DE energy density remains constant, the resulting continuing acceleration will eventually cause a so called 'big rip' in the universe. In the case of our HDIE explanation, the fraction of baryons in stars will continue to increase as a+1 for the immediate
future, providing constant HDIE energy density. But that fraction, by definition, cannot exceed unity. At later times we expect a falling off in star formation and total star numbers, and therefore leaving us eventually with expansion without acceleration, perhaps more analogous to a ‘slow tear’ than a ‘big rip’.
We conclude this section with a note concerning the application of the laws of thermodynamics to the universe. The first law appears to be violated on the scale of the universe since, in recent times, total DE (whatever the explanation) appears to increase with the expanding universe as ~a3. However, in general relativity DE may increase without seeming to conserve
energy, because of the continual exchange of energy between matter and changing space-time or gravitational field [77]. The anti-de-sitter/conformal field theory (Ads/CFT) correspondence translates a multidimensional space with gravity to another multidimensional space without gravity but with one less dimension [78]. This has led to the suggestion that, by combining the holographic principle with Landauer's principle, in a similar way to the entropic energy of HDIE, the information carried by space-time is equivalent to an entropic force, an entropic or emergent gravity[79,80], which, like HDIE, possibly also accounts for DM attributed effects [80].
The second law, on the other hand, should apply universally. If algorithmic information is also governed by the second law, a simple Gedanken experiment has revealed a further connection between information and universe acceleration [26]. This thought experiment considered the algorithmic information describing the baryons in the whole universe, but also applies to any large co-moving volume. It was easily shown that the observed increasing star formation would have resulted in a decrease in the number of algorithmic information bits if the expansion had not started to accelerate. In order to ensure the 2nd law is satisfied with no decrease in algorithmic information bit number, an approximate extra doubling of universe volume is found to be required, as is indeed observed to have resulted directly from the recent period of acceleration.
2.3 HDIE imitates Dark Matter.
or photons through any of the other fundamental forces. This similarity argues for a common explanation.
HDIE is naturally located where baryons occur at high temperature and density and where HDIE energy densities should be sufficient to add significantly to baryon distortions of space-time. As there is no separate DM component in the HDIE/baryon model, we expect that the location of hot baryons will fully specify where the DM attributed effects will occur.
A high correlation has been found [81, 82] between the observed galaxy radial acceleration and that predicted from baryons, based on a total of 240 galaxies of various morphologies: 153 late-type galaxies, 25 early-type galaxies and 62 dwarf spheroidals. There is very little scatter and this strong empirical relation shows all galaxies studied follow the same radial acceleration relation, showing the dark matter contribution to be fully specified by the baryons. Thus dark and baryonic masses exhibit a strong coupling that is difficult for the ɅCDM model to explain, but would follow directly from the HDIE/baryon model (and possibly also from the MOND model).
Observations of clusters of galaxies [83] show that the brightest galaxies are almost always found in the middle of those locations where gravitational lensing indicates the DM contribution is maximum. Clearly, this property is also consistent with an HDIE explanation since HDIE is proportional to temperature. HDIE also fits with the favoured bottom up hierarchical structure formation with smaller objects forming first and effectively promoting the formation of larger structures, resembling CDM rather than hot DM. In the ɅCDM model gravitational lensing effects are due to higher densities of DM which have led to increased structure formation and brighter galaxies at those locations. In the HDIE/baryon model as galaxies increase in brightness with increasing temperatures, higher entropies, and thus higher HDIE densities lead to both the observed gravitational lensing DM-like effects and further increases in structure formation.
The present universe wide fraction fHDIE~68% required for HDIE to explain the universe
expansion history is then equivalent to an average DM fraction, fDM~68%, a lower value than the fDM~85% of the Planck ɅCDM model [1-3]. It is beyond the scope of this work to survey all
measured fDMvalues of astrophysical objects, ranging from globular clusters containing little DM
to dwarf galaxies dominated by DM. Two random examples illustrate the wide range. One edge-on lensing galaxy was found [84] to have fDM= 25%-35%, while one ultra diffuse galaxy [85] has fDM>99%.
However, a survey [86] of 1.7 x10⁵ massive early-type galaxies z<0.33 yields fDM = 53%-72%
within those galaxies’ effective radius (radius that defines the sphere responsible for one half of the galaxy’s light emission). Another survey of 584 typical star-forming galaxies, z=0.8-1.0 [87] finds fDM= 65±12%. Note the present value HDIE fHDIE~68% lies in the middle of both survey
ranges while ɅCDM fDM~85% lies outside both ranges.
While values of fHDIE should be high in the high temperature baryon objects that we can
observe, universe average fHDIE would have been much lower at earlier times when only a small
fraction of baryons had formed stars. Therefore, we expect observable object fDM values at or
above the universe average fHDIE value for that redshift, effectively setting a lower bound. In
contrast, universe average ɅCDM fDM should have remained constant, independent of redshift,
and we expect observed object fDM values to be distributed approximately evenly about fDM ~85%.
Fig.2. compares these expected values with several galaxy surveys [86-88] and with six early star forming disk galaxies [88]. Note surveys of early star forming galaxies made with the same instruments and analysis techniques, but in two different redshift ranges [88] (purple squares in Fig.2) show that galaxies at z=2.0-2.6 clearly have lower fDM values than those at z=0.6-1.1. Overall,
both survey and individually measured values of fDM show a strong dependence on z, lying closer
Fig.2. Observed fDM compared with average ɅCDM fDM and the HDIE/baryon fHDIE bound. Survey results, square symbols: Dark Blue, 1.7 x10⁵ massive early-type galaxies z<0.33 [86], Light
Blue, 584 typical star-forming galaxies, z=0.8-1.0 [87], Purple, 92 star forming galaxies, z=2.0-2.6 and 106 star forming galaxies, z=0.6-1.1 [88]. Individual galaxies, circle symbols: Red, six early star forming galaxies [88]; Green, Milky Way galaxy [89]. The fHDIE lower bound is calculated from the power law fits to the star formation data of Fig.1, assuming present fHDIE=68%.
Table 1 shows that there is more HDIE associated with stellar heated gas and dust than with the stars themselves. In addition, X-ray measurements have found the majority of baryons exist as warm/hot gas disconnected from stars: in galaxies as spherical haloes at T~106-107 [90]; in the
intracluster medium of galaxy clusters at T~107-108; and in the intergalactic medium at T~105-107.
We can therefore expect information energy contributions from other forms of hot gas to contribute to HDIE besides the contribution from stellar heated gas and dust. The combined distribution of HDIE around a galaxy may more likely resemble the galactic halo than the typical disc or spiral of stars within the galaxy, and thus be similar to the distributions of DM around galaxies required to explain rotation measurements.
Clusters of colliding galaxies are considered to provide some of the strongest evidence for the existence of DM. Optical observations show stars pass through largely unhindered while X-ray observations show the galactic gas clouds, containing the majority of baryons, collide, slowing down or even halting. The location of DM is then identified from lensing measurements [91-93]. A study of the Bullet cluster [91], and of a further 72 mergers [92], both major and minor, finds no evidence for DM deceleration, with the dark mass remaining closely co-located with the stars and structure. Thus DM is found to be not concentrated around the baryon centre of gravity in the galactic gas clouds, and an upper limit is placed on any DM self-interaction. Clearly HDIE could equally explain all of these observations if the dominant contribution to HDIE in these cases were from stellar heated gas and dust that generally passes with the stars straight through.
combination of the HDIE contribution from stellar heated gas and dust with an additional contribution from the intracluster gas, perhaps heated to higher temperatures by shocks.
The spatial distributions of some galaxies and galaxy clusters have been found to exhibit an “assembly bias” [94]. The way in which those galaxies interact with their DM environments appears to be determined not just by their masses but also by their past formation history. This could also be consistent with an HDIE explanation as information/entropy is a result of not just present processes but also the result of the past history of physical processes that operated on baryons.
2.4 Summary of potential advantages of the HDIE/baryon model.
Then the HDIE/baryon model can be seen to possess several potential advantages over the ɅCDM concordance model. The HDIE/Baryon model can:
• Quantitatively account for the present DE energy density value with proven physics, using experimentally proven Landauer's Principle with realistic universe entropy estimates.
• Explain why DE has an overall near constant energy density in recent times by combining star formation measurements with the Holographic principle. The Holographic principle is generally accepted for black holes, but remains only a conjecture for universal application.
• Account in general for many effects previously attributed to DM: galaxy spin anomalies; gravitational lensing; lensing of clusters of colliding galaxies; and galaxy ‘assembly bias’.
• Account for galaxy radial acceleration with DM effects fully specified by baryon location.
• Provide better agreement with measured DM fractions in galaxy surveys.
• Enable an explanation for DM attributed effects without invoking new exotic and practically undetectable particles, and without requiring the new physics required by MOND and dark fluid theories.
• Allow the cosmological constant to take the more likely zero value.
• Solve the cosmic coincidence problem.
• Account quantitatively for the recent change in star formation rate due to DE feedback.
• Reduce a problem of two unexplained phenomena to a single phenomenon.
• Provide an explanation emphasizing ‘simplicity’ (wielding Occam's razor) and ‘naturalness’ (relying on mostly proven physics) with a strong dependence on empirical data [22].
• Significantly reduce our ignorance of the universe. The baryon world which we observe, and are ourselves a part of, would now play a more important role in the universe, representing ~32% of the energy total, while the present and past physical processes acting on that component provide the HDIE information energy component that can account for the remaining ~68% of universe energy.
3. Measurements to distinguish between HDIE/baryon and ɅCDM models.
Given the potential advantages of the HDIE/baryon model listed in §2.4, we should try to satisfy the Popper requirement [95] of predicting the value of a measurement whereby this explanation can be discounted, or falsified. Although the sensitivity of DM detectors [17-20] continues to improve, there is now less confidence that WIMPS, the favoured DM candidate, will ever be found [96]. Of course, should a future detection of particles responsible for DM be confirmed it would clearly refute our explanation, at least as an explanation for DM effects. But we cannot use the on-going failure to confirm a DM particle source as positive support for our explanation - absence of evidence is not evidence of absence. Furthermore, in §2.3 we were only able to explain DM attributed effects by HDIE/baryons in the most general qualitative terms.
Fortunately, the HDIE/baryon model predicts a significant specific phantom DE behaviour,
Friedman [97] found solutions to the Einstein equations [98] that allowed Weinberg [99] to express in equation 1 the Hubble parameter, H(a) in terms of the Hubble constant H0 (present
Hubble parameter value) and dimensionless energy density parameters, Ω, where the present value of each is expressed as a fraction of today’s total energy density so that all Ω terms add up to unity:
(
H(a)/H0
)
2= (
ΩCDM
+
Ωb
)
a
-3+
Ω
r
a
-4+
Ωk
a
-2+
ΩDE a
-3(1+w)(1)
Subscripts: CDM, cold dark matter; b, baryons; r, radiation; k, curvature; and DE, dark energy.
It is usual to assume curvature Ωk is zero, and that the radiation term, Ωr, for some time has
been negligible compared to the total of all matter and DE. Further assumptions inherent in the
ɅCDM and HDIE/baryon models then lead to two different descriptions of universe expansion:
1) the ɅCDM model assumes DE is the cosmological constant, w= -1,
(
H(a)/H
0)
2= (
Ω
CDM+
Ω
b)
a
-3+
Ω
Ʌ(2)
with ESA Planck values: ΩCDM ~ 0.27, Ωb ~ 0.05, and ΩɅ ~ 0.68.
2) the HDIE/baryon model predicts ΩCDM = 0 and a dynamic DE with a time varying
equation of state parameter,
w(a)
,(
H(a)/H
0)
2=
Ω
ba
-3+
Ω
HDIEa
-3(1+w(a))(3)
with accelerating expansion equivalent values: Ωb ~ 0.32, ΩHDIE ~ 0.68, and w(a>0.43) ~ -1.
Planck data [1-3] has shown that the universe is flat so the total energy density today must be close to the critical density, 3H02/ 8πG , or equivalent in energy density to ~6 hydrogen atoms/m3.
Then in the ɅCDM model where the ratios of baryons: DM: DE are 5%: 27%: 68%, respectively, the universe average baryon density should be ~0.3 atoms/m3. However, in HDIE/Baryon model
ratios of baryons: DM: DE are 32%: 0%: 68%, so the average density should be around ~6x higher at ~2 atoms/m3. The adoption of a higher density is encouraged by recent results: the observable
universe has just been found to contain 10 times more galaxies than previously thought [100] and the ESA Gaia spacecraft has shown that even our own galaxy is much bigger than previously thought [101].
At first sight, universe expansion measurements should easily provide a clear distinction between the descriptions of equations (2) and (3). In the HDIE model, DE and hence the universe expansion rate is dependant on structure formation, and, based on the star formation history measurements of Fig.1, we expect the form of w(a) to be such as to provide w= ~ -1.0 for a > ~0.43, ( z< ~1.35), and w= ~ -1.8 for a< ~0.43, ( z> ~1.35). Thus, for the same present ratio of DE to all matter (~2.15), both models behave identically at low redshifts, with the only difference restricted to z>~1.35, where any DE contribution is difficult to measure as it is swamped by the much higher matter energy density at earlier times.
model then continues to fall to 7% at z=2, and 1.6% by z=4, while in the HDIE/baryon model we expect HDIE to fall more rapidly, down to ~3% at z=2, contributing only ~0.25% at z=4. Note that the differences between models in total energy at z=2 and z=4 of ~4% and ~1.35% correspond to differences in Hubble parameter, H(a), of only ~2% and ~0.7%, respectively, requiring very high precision expansion measurements to distinguish between models.
The expansion rate variation over time is determined by combining a number of different measurement types. Unfortunately, most of the non-CMB measurements are restricted to the low redshift range, z<~2, with the vast majority z<~1, while the CMB measurements of Planck and WMAP satellites correspond to a single very high redshift, z~1100, the location of the point of last CMB scattering. Then it will be difficult to distinguish between our two models, as the critical wide intermediate range, ~1.5<z<1100, is sparsely measured.
3.1 Usual CPL parameterisation of w.
Present instrument resolution limits us to assume a simple shape for the w(a) timeline with a description using a minimum number of parameters. Combined datasets are integrated over a wide range of redshifts to find those optimum parameter values. It is usual to denote the present equation of state parameter by wo, with the value at much earlier times denoted by wo+wa. Most
astrophysical datasets, including recent Planck data [1-3], were analysed to deduce cosmological parameters using the simple two parameter 'CPL' form of parameterisation [102] given in equation (4).
w
(
a
) =
w
o+ (1
−a
)
w
a(4)
This parameterisation assumes a smooth, continuous variation of w(a) from wo+wa at very
early times, a<<1, through to wo today, with a midpoint value of wo+ 0.5wa at z=1.
The 2013 and 2015 Planck data releases [1-3] include several dataset combinations where
Planck data have been combined with other types of measurement and analysed using the CPL parameterisation. Those other datasets include: baryon acoustic oscillations (BAO); supernovae SNe1a studies such as the Supernova Legacy Survey, SNLS, and 580 supernova compiled in Union2.1; Galaxy clustering; the Hubble Space Telescope (HST); and WMAP CMB. Marginalised posterior distributions shown by the 68% (2ơ) and 95% (1ơ) likelihood contours for some of these data combinations are re-plotted in Fig. 3. in wo-wa space.
Fig.3, upper plot shows Planck 2013 data release (from Fig.36 of [1]) while the lower plot shows the Planck 2015 data release (from Fig. 28 of [2]). The Planck 2015 data [2,3] includes several improvements in data treatment and calibration over the 2013 data [1]. Besides the cosmological constant (wo=-1, wa =0), we include on Fig. 3. upper plot the quintessence regime, +1≥w≥-1 , the
phantom energy regime, w <-1, and, for completeness, the quintom regimes where, at some point in time, w crossed the value w=-1. We have also shown the HDIE predicted value from this work (§2.2) and from the earlier HDIE publication [27].
In the upper plot we have also plotted the 68% (solid black) and 95% (dashed black) likelihoods common to all three Planck 2013 dataset combinations. We note that both HDIE predicted values lie inside, or very close to, the common 68% likelihood 2ơ region, while the cosmological constant lies just outside even the common 95% likelihood 1ơ region. In the recent
Fig.3. HDIE predictions compared with Planck dataset combination results. 2D marginalised posterior distributions are shown by the 68% and 95% likelihood contours as a function of wo and wafor different dataset combinations. Symbols: white circle, cosmological constant; white square, previous HDIE work [27]; red square, this HDIE work. Upper plot: 2013 results for the three data combinations: Planck+WMAP+BAO; Planck+WMAP+Union2.1; and Planck+ WMAP+SNLS from [1]. The areas bounded by the black dashed line and the black continuous line correspond to the 95% and 68% likelihoods, respectively, that are common to all three dataset combinations.
Lower plot: 2015 results for the three data combinations: Planck TT + lowP +ext; Planck TT + lowP + WL; and Planck TT + lowP + WL + H0 from [2]. Dashed line 95% common likelihood. Refer to Planck results [1, 2] for a full description of these data combinations.
Both groups of dataset plots in Fig.3. have a strong tendency for wa ≤ 0, favouring either a
3.2. Mounting (weak) evidence for phantom Dark Energy.
Here we list measurements that seem to favour a phantom DE. It is important to preface this list by emphasizing that, despite the clear trend for wa ≤ 0 in Fig.3, and the results listed here, no
measurement yet exists that can exclude the cosmological constant to a level greater than 3ơ. Note items (1),(5),(6) & (7) below are directly compatible with the HDIE/baryon prediction.
1) We start by noting that Planck CMB data is not strongly constrained without combining with other data sets. On its own this Planck data yields w=-1.54, +0.62/-0.50 corresponding to a ~2ơ shift into the phantom regime [2], effectively averaging over the whole range 0<z<1100.
2) Some measurements of w may be considered to be inconsistent with a cosmological constant. One survey of 146 Type Ia Supernovae over the range 0.03<z<0.65 when combined with BAO, Planck and H0 finds w=-1.166+0.072/-0.069, inconsistent with w=-1 at 2.3ơ level [103].
3) A wider combination of current and mature DE measurements finds that the value of w strongly depends on the value adopted for the Hubble constant, Ho. That analysis concludes at ≥2ơ confidence: either datasets still contain unaccounted for systematic errors, or Ho < 71km/s/Mpc, or dark energy is phantom, w<-1 [104].
4) Another analysis of similar datasets also implies DE is phantom at 2ơ level: w=-1.15±0.07 with the dataset combination Planck + WMAP + BAO + Union2.1 + HST and w=-1.16±0.06 with the dataset combination Planck + WMAP + BAO + SNLS + HST. [105]
5) A comparison between H0 derived from Planck with that from more direct measurements favours w<-1 at the 2ơ level, and, if DE is dynamic, finds 68% confidence level constraints of wo = -0.81 ±0:19 and wa = -1.9 ±1.1 [106] using the CPL parameterisation.
6) Recent BOSS measurements of quasars in the Lyman α forest [107] provide further support for wa<0 with values in tension with the standard ɅCDM model, and a DE energy density at z=2.4 that is less than the energy density at z=0.
7) The most accurate NASA Hubble measurement of H0 to date [108] is ~8% higher than the value derived from CMB measurement combinations of the Planck consortium [2]. This higher value is also supported by recently released data from the ESA GAIA spacecraft. One likely explanation for this 3.0ơ difference is that it is caused by a dynamic and phantom DE.
3.3. Proposed three parameter description of w.
It has been argued [109] that the usual two parameter CPL parameterisation, by virtue of its simplicity, makes a minimum assumption about the shape of w(a), and, accordingly, has the advantage of being effectively neutral and not biasing the analysis towards any one particular explanation of DE. For these reasons CPL has been widely adopted and has enabled us to make comparisons between widely different measurement techniques and their combined datasets. A number of publications have suggested different parameterisations, often justified on theoretical grounds [110-116], while a case is made below for a simple three parameter parameterisation driven solely by the empirical evidence of the star formation data of Fig. 1.
We note that the BOSS measurements [117] exclude any significant phantom behaviour at low z, clearly restricting DE explanations towards a cosmological constant type behaviour below
z~0.7, with limits to -0.97>w>-1.11 over the range 0.2<z<0.7. On the other hand most of the combined Planck dataset combinations (Fig.3.), although also compatible with the cosmological constant, allow for significant phantom DE. This suggests that, while there is a cosmological constant type of behaviour out to at least z=0.7, there could be a possible phantom behaviour at higher z values, based on the list of §3.2.
w
(
a
) =
w
o+(
w
a/(1+exp((
a−a
t)
/
a
w))) (5)
This description maintains the limits of wo today and wo + wa at much earlier times as in CPL.
In comparison to the slow continuous change provided by CPL, the above four parameter form allows for a much sharper transition between the two values with the transition centered around
at and with the width of transition region set by aw.
Unfortunately, the use of four parameters significantly complicates dataset merging and dataset comparisons. In order to simplify data analysis, we then further assume that the transition is so sharp, aw→0, that we can ignore any variation of the data within that transition region. We justify taking this approach with the power law fits (red lines) to the observed star formation data of Fig.1.
Now the description effectively resorts to an instantaneous transition at at, allowing for the
simpler three parameter description of equation (6).
w(a)
=
wo+
wa,
a<
at;
w(a)=
wo,
a>
at. (6)To illustrate the advantage of using this sharper transition over CPL as a means of
distinguishing between ɅCDM and HDIE/baryon models, we now consider four specific
parameter combinations:
1) Ʌ: wo=-1, wa=0. These parameter values correspond to the cosmological constant, (black lines Figs 1 & 4), closely fitting BOSS data and HDIE at low redshifts, z<1.35, but making a bad fit to HDIE at higher redshifts. Note that the zero value of wa makes this case independent of whether considering CPL or the three parameter description (and independent of at ).
2) CPL wo=-1, wa=-0.45. Assuming wo=~-1, then wa=-0.45 is the most negative value of wa for CPL that still fits BOSS low z data illustrated by the yellow wedge in Fig.4. This description (dashed grey line in Figs. 1 & 4) makes a very poor fit to HDIE at higher redshifts, z>~2.
3) CPL wo=-1, wa=-0.82. Best CPL approximation to HDIE predicted by §2.2 of this work (continuous grey line in Figs. 1 & 4). While closely fitting HDIE at very high redshifts, (wo+wa), and at very low redshifts (wo), this parameterisation makes a poor fit over the important intermediate redshift range: ~2> z >~0.5. Note that this description also does not fit well with BOSS measurements as it lies outside the majority of BOSS measurements (yellow wedge in Fig.4.)
4) Three parameter sharp transition. w = wo = -1.03 at z<1.35 (a>0.43), and w = wo + wa at z>1.35 (a <0.43), where wa = -0.79. These are the specific values that closely describe HDIE values at all
redshifts, as predicted from Fig.1. star formation history (red lines in Figs. 1 & 4). This case also makes a good fit to BOSS measurements, falling completely inside the yellow wedge of Fig.4.
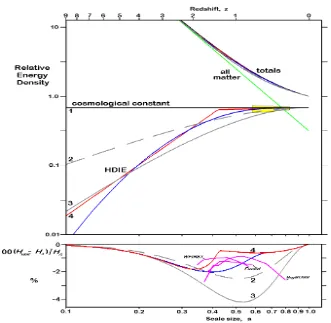
Fig.4. Comparison of parameterisations: energy density contributions and Hubble parameter. Upper plot. Energy densities relative to total today(=1) versus scale size for all matter (green), cosmological constant, case1(black line), and HDIE using fits to stellar mass density data of Fig.1: red line, case 4, power laws, w=-1.03, z<1.35, and w=-1.82 z>1.35; blue line, simple polynomial fit; and grey lines, CPL type behaviour, w=wo+ (1-a)wa , with continuous grey line wo=-1.0, wa=-0.82, case 3, and dashed grey line wo=-1.0, wa=-0.45, case 2. Total energy densities are also shown for all matter plus each DE variation. Yellow shaded area corresponds to the DE limit -0.97>w>-1.11 set by BOSS measurements [117] over the redshift range: 0.2<z<0.7 Lower plot. Corresponding variations in Hubble parameter H(a) for the HDIE fits, cases 2,3,4, plotted as a percentage difference from that expected for a cosmological constant, and compared with the detection resolutions (purple lines) for Euclid[118], WFIRST[119], and BigBOSS[120].
Case:
Fit to HDIE
Fit to BOSS
Fit to Planck
Difference in H(a) relative to Ʌ 1) Ʌ: wo=-1, wa=0 CPL or 3 parm. bad good reasonable --
2) CPL wo= -1, wa= -0.45 bad marginal reasonable easily measured 3) CPL wo= -1, wa= -0.82 poor bad reasonable easily measured 4) 3 parameter fit to HDIE,
wo= -1.03, wa= -0.79, at= 0.43
good good reasonable ~ resolution limit of next missions
In order to better identify measurable differences, Fig.4, lower plot, shows the Hubble parameter values of descriptions 2-4, relative to that expected for a cosmological constant. The polynomial fit to data of Fig.1. is included on the figures (blue line Figs. 1 & 4) for comparison. Recent Baryon Oscillation Spectroscopic Survey (BOSS) measurements of clustering of galaxies [117] are fully consistent with a cosmological constant type of behaviour over the redshift range 0.2 < z < 0.7 to an accuracy of 1%, illustrated by the yellow wedge area in Fig. 4, upper plot. Also plotted on the lower plot are the expected threshold resolutions of three next generation instruments: Euclid [118]; WFIRST [119]; BigBOSS [120].
We summarise our observations of Figs 1, 3 and 4 in Table 2. Case 2 lies midway between the cosmological constant and the HDIE points in Fig. 3. and all four cases make a reasonable fit to the Planck data combinations. Then the three parameter sharp transition, case 4, is the only one to make a good fit to both HDIE data and BOSS measurements. Although this three parameter description provides the best fitting, Fig.4, lower plot, shows that it will be very difficult to distinguish between the two models. The expected difference in Hubble parameter between case 4 and the ɅCDM model lies close to, or below, the resolutions limits of the next generation of DE
instruments. In contrast, cases 2 and 3 would be easily distinguished from ɅCDM by
measurement but neither makes both a fair representation of the HDIE predicted w(a) variation and also fits BOSS data.
CPL has served us well up to the present day but we are now trying to resolve small model differences over a specific redshift range. The four cases considered above show that the continued use of the CPL parameterisation biases interpretation towards a cosmological constant, away from the possibility of an HDIE explanation, and contrary to the usual assumption of CPL neutrality.
As existing data analysis processes are already mature and well organised to deduce cosmological parameters, it should be relatively easy to modify data analysis, changing from the usual CPL form to the three parameter form. At its simplest, analysis would involve repeating the present procedure a number of times, each with a different fixed value of the transition time, at, and thus each effectively still a two parameter wo, wa analysis as done presently. DE instrument
‘figures of merit’ are defined as the inverse of the areas enclosed by the likelihood contours in w0-wa space (as in Fig.3.). In the same way the optimum value of at will be found to be the value that exhibits the minimum enclosed likelihood contour area.
Recently galaxy clusters have been used in a similar way to SNe1a as ‘standard candles’ by considering similarities in X-ray emission spectra [121]. Some 320 clusters in the range 0.056<z<1.24 are found to support w=-1 out to z~1.24. While this observation remains consistent with the predictions of both models it may help limit the range of at that we need to search.
The present disagreement between Hubble constant values obtained by different techniques assuming ɅCDM could be explained by a phantom dark energy like HDIE [108,122]. Besides the weak phantom evidence of §3.2 and combined Planck datasets of Fig.3., there are also other observations, of a more indirect nature, that are also difficult to reconcile with the ɅCDM model [123-125].
optimizing the design and/or operation of those next generation instruments with subsequent enhanced scientific return.
If expansion measurements are eventually found to fit the specific form of dynamic w(a)
predicted by the HDIE/baryon model then HDIE must also make a significant contribution towards explaining some of the DM attributed effects. However, it would take much longer to confirm an HDIE explanation for all DM effects, and so we would probably still need to continue searching for evidence of DM particles for some time to come.
4. Summary.
Given our current lack of understanding of DM and DE phenomena, there is a clear case for looking beyond ɅCDM and pursuing alternatives. Rather than theory driven, the HDIE/baryon model is primarily data driven and provides a common explanation for many effects previously attributed separately to DM and DE. This model has several advantages, not least in simplicity of concept, and naturalness, or reliance on mostly proven physics.
This work has used the ratio of HDIE to baryons to account for acceleration due to DE and to provide effective mass fractions to account for DM-like effects. HDIE fits Planck data combinations’ wo -wa plots at least as well as Ʌ, and the prediction of phantom DE at earlier times
is consistent with a number of other measurements.
The usual CPL parameterisation clearly biases data interpretation towards the standard
ɅCDM model while the proposed three parameter (wo, wa, at) parameterisation should be neutral,
at least between ɅCDM and HDIE/baryon models, and should eventually provide a clear distinction between them. Although the immediate next generation of instruments might still not possess sufficient resolution for this model separation, future higher resolution measurements at intermediate redshifts will identify the more appropriate model. If dark energy is eventually shown to have been phantom at earlier times, and, if there has still been no confirmed detection of dark matter, then the HDIE/baryon model will provide a viable explanation.
Acknowledgements. The author is grateful for an Emeritus Professorship from the University of Sussex.
Conflicts of Interest: The author declares no conflict of interest.
References.
1. Ade, P. et al.; Plank Collaboration. Planck 2013 results. XVI. Cosmological parameters,Astron. Astrophys. 2014, 571, A16.
2. Ade, P. et al.; Plank Collaboration. Planck 2015 results. XIII. Cosmological parameters,
submitted to Astr.& Astrophys., http://www.cosmos.esa.int/web/planck/publications, 67pp, 2015. 3. Ade, P., et al.; Planck Collaboration. Planck 2015 results. XIV. Dark energy and modified
gravity, acceptd for Astr.&Astrophys.,www.cosmos.esa.int/web/planck/publications, 32pp,2015. 4. Riess, A.G.; Filippenko, A.V.; Challis, P.; Clocchiatti, A.; et al., Observational evidence from
supernovae for an accelerating universe and a cosmological constant. Astron. J. 1998, 116, 1009–1038. 5. Perlmutter, S.; Aldering, G.; Goldhaber, G.; Knop, R.A.; et al. Measurements of Ω and Λ from 42 high-redshift supernovae. Astrophys. J. 1999, 517, 565–586.
6. Carroll, S.M. Why is the Universe Accelerating? In Measuring and Modeling the Universe; Carnegie Observatories Astrophysics Series, Volume 2; Freedmann, W.L., Ed.; Cambridge University Press: Cambridge, UK, 2003.
7. Frieman, J.A.; Turner, M.S.; Huterer, D. Dark energy and the accelerating universe. Ann. Rev.Astron. Astrophys. 2008, 46, 385–432.
9. Carroll, S.M. The cosmological constant. Living Rev. Relativity 2001, 4, 1-56.
10. Caldwell R.R., Perspectives on Dark Energy, Space Science Reviews 2009, 148, 347–362. 11. Pretzl, K. Dark Matter Searches, Space Science Reviews 2007, 130, 63-72.
12. Bauer, D. , Buckley, J. , Cahill-Rowley, M., et al, Dark Matter in the Coming Decade:
Complementary Paths to Discovery and Beyond, Physics of the Dark Universe 2015, 7-8, pp 16-23. 13. Ajello,M. , Albert,A.,, Atwood,W.B.,et.al., Fermi–LAT Observations of high energy gamma ray emission towards the galactic centre, ArXiV:1511.02938v1 astro-ph.HE,2015, 29pp.
14. Bartels,R., Krishnamurthy,S., and Weniger, C., Strong support for the millisecond pulsar origin of the galactic centre GeV Excess Phys. Rev. Lett. 2016, 116, 051102, 5pp.
15. Lee, S.K., Lisanti,M., Safdi, B.R., Slatyer, T.R., Xue, W., Evidence for unresolved γ-ray point sources in the inner galaxy Phys. Rev. Lett. 2016, 116, 051103, 6pp.
16. Fornasa, M., Cuoco, A., Zavala, J., Gaskins, J.M., et al. Angular power spectrum of the diffuse gamma-ray emission as measured by the Fermi Large Area Telescope and constraints on its dark matter interpretation, Phys. Rev. D 2016, 94, 123005.
17 Aprile, E., Aalbers, J., Agnosti, F., Alfonsi, M., et al.,XENON100 dark matter results from a combination of 477 live days, Phys. Rev. D 2016, 94, 122001.
18 Alerib, D.S., Alsum, S., Araujo, H.M.m Bai, X., et al., Results from a Search for Dark Matter in the Complete LUX Exposure, Physical Review letters 2017, 118, 021303.
19 Changho, F., Xiang, C., Zhou, X., Chen, X., et al, Results on spin-dependent WIMP-nucleon interaction from first data of PandaX-II experiment, ArXiv 1611.06553, 2017.
20. Amole,C., Archid,M.,Arnquist,I.J., Asner,D.M., et al., Dark matter Search Results from the PICO-60 C3F8 Bubble Chamber, ArXiv 1702.07666v1, 24Feb 2017.
21. Spergel, D.,N., The dark side of cosmology: Dark matter and dark energy, Science 2015, 347, 1100- 1102.
22. Bull,P.,Akrami,Y.,Adamek,j.,et al., Beyond ɅCDM: Problems, solutions, and the road ahead, Physics of the Dark Universe 2016, 12 ,56-99, & arXiv:1512.05356.
23. Milgrom, M.., A modification of the Newtonian dynamics - Implications for galaxies. Astrophysical Journal 1983, 270, 371–389.
24. Arbey, A., Cosmological constraints on unifying Dark Fluid Models, The Open Astronomy Journal 2008, 1, 27-38.
25. Gough,M.P., Holographic Dark Information Energy, Entropy 2011, 13, 924-935.
26. Gough, M.P., Holographic Dark Information Energy: Predicted Dark Energy Measurement, Entropy 2013, 15, 1133-1149.
27. Gough, M.P., A Dynamic Dark Information Energy Consistent with Planck Data, Entropy 2014, 16, 1902-1916.
28. Lloyd, S., Programming the Universe, Pub. Alfred A. Knopf, ISBN 1-4000-4092-2, 2006.
29. Landauer, R.,Irreversibility and heat generation in the computing process. IBM J. Res. Dev. 1961, 3, 183–191.
30. Landauer, R. Information is physical. Phys. Today 1991, 44, 23-29. 31. Piechocinska, B. Information erasure. Phys. Rev. A 2000, 61, 062314,(9pp).
32. Landauer, R. Dissipation and noise immunity in computation and communication. Nature 1988, 335, 779–784.
33. Maxwell’s Demon 2: Entropy. In Classical and Quantum Information; Leff, H.S., Rex, A.F., Eds.; Computing IOP Publishing Ltd: London, UK, 2003.
34. Lutz, E., Ciliberto, S., Information from Maxwell’s Demon to Landaurer’s eraser, Physics Today 2015, 68(9) , pp 30-35.
36. Berut, A.; Arakelyan, A.; Petrosyan, A.; Ciliberto, S.; Dillenschneider, R.; Lutz, E.
Experimental verification of Landauer’s principle linking information and thermodynamics. Nature 2012, 483, 187–189.
37. Jun,Y., Gavrilov, M.,Bechhoefer,J., High-Precision Test of Landauer’s Principle in a Feedback Trap, Physical Review Letters 2014, 113, 190601-1 to -5.
38. Frampton, P.H.; Hsu, S.D.H.; Kephart, T.W.; Reeb, D. What is the entropy of the universe? Class. Quant. Grav. 2009, 26, 145005, (7pp).
39. Egan, C.A.; Lineweaver, C.H. A larger estimate of the entropy of the universe. Astrophys. J. 2010, 710, 1825–1834.
40. T’Hooft, G. Obstacles on the way towards the quantization of space, time and matter- and possible solutions. Stud. Hist. Phil. Mod. Phys. 2001, 32, 157–180.
41. Susskind, L. The world as a hologram. J. Math. Phys. 1995, 36, 6377–6396. 42. Buosso, R. The holographic principle. Rev. Mod. Phys. 2002, 74, 825–874. 43. Bekenstein, J.D. Black holes and entropy. Phys. Rev. D 1973, 7, 2333–2346.
44 Afshordi,N., Coriano, C., Rose, L.D., et al, From Planck data to Planck era: Observational tests of Holographic Cosmology, Physical Review Letters 2017, DOI: 10.1103/PhysRevLett.118.041.301. 45. Li, C., White, S.D.M., The distribution of stellar mass in the low-redshift universe, MNRAS 2009, 398, 2177-2187.
46. Gallazzi,A., Brinchmann,J.,, Charlot,S., White,S.D.M., A census of metals and baryons in stars In the local universe, MNRAS 2008, 383, 1439-1458.
47. Moustakas J, Coil A, Aird J, et al., PRIMUS: constraints on star formation quenching and
Galaxy merging and the evolution of the stellar mass function from z=0-1. Ap. J. 2013, 767:50 (34pp). 48. Bielby R, Hudelot P, McCracken HJ, et al., The WIRCam Deep Survey. I. Counts, colours, and mass-functions derived from near-infrared imaging in the CFHTLS deep fields, Astron. Astrophys. 2012, 545, A23 (20pp).
49. Perez-Gonzalez PG, Rieke GH, Villar V, et al., The stellar mass assembly of galaxies from z=0-4: analysis of a sample selected in the rest-frame near infrared with Spitzer, Ap. J. 2008, 675, 234-261.
50. Ilbert O, McCracken HJ, Le F`evre O, et al., Mass assembly in quiescent and star-forming Galaxies since z~4 from UltraVISTA, Astron. Astrophys. 2013, 556, A55(19pp).
51. Muzzin A, Marchesini D, Stefanon M, et al. The evolution of the stellar mass functions of star- forming and quiescent galaxies to z=4 from the COSMOS/UltraVISTA survey, Ap. J. 2013 , 777, 18 (30pp).
52. Arnouts S, Walcher CJ, Le Fevre O, et al.,The SWIRE-VVDS-CFHTLS surveys: Stellar Assembly over the last 10Gyr., Astron. Astrophys. 2007, 476, 137-150.
53. Pozzetti L, Bolzonella M, Zucca E, et al., zCOSMOS -10k bright spectroscopic sample. The bimodality in the galaxy stellar mass function, Astron. Astrophys. 2010, 523, A13(23pp). 54. Kajisawa M, Ichikawa T, Tanaka I, et al. , MOIRCS deep survey IV evolution of galaxy stellar mass function back to z~3, Ap. J. 2009, 702, 1393-1412.
55. Marchesini D, van Dokkum PG, Forster Schreiber NM, et al., The evolution of the stellar mass function of galaxies from z=4 and the first comprehensive analysis of its uncertainties, Ap. J. 2009, 701, 1765-1769.
56. Reddy NA, Dickinson M, Elbaz D, et al. GOODS-HERSCHEL measurements of the dust attenuation of typical star forming galaxies at high redshift, Ap. J. 2012, 744, 154(17pp). 57. Caputi,K.I,, Cirasuolo,M., Dunlop,J.S., et al. The stellar mass function of the most massive Galaxies at 3<z<5 in the UKIDSS Ultra Deep Survey, MNRAS 2011, 413, 162-176.
58. Gonzalez V, Labbe I, Bouwens RJ, et al. , Evolution of galaxy stellar mass functions, mass densities, and mass-to light ratios from z~7 to z~4, Ap. J. Let. 2011, 735, L34(6pp).
masses?, Ap. J. 2012, 752, 66(21pp).
60. Yabe K, Ohta K, Iwata I, et al. The stellar populations of Lyman break galaxies at z~5, Ap. J. 2009, 693, 507-533.
61. Labbe I, Oesch PA, Bouwens RJ, et al., The spectral energy distributions of z~8 galaxies from the IRAC ultra deep fields, Ap. J. Let. 2013, 777, L19(6pp).
62. Madau,P., Dickinson,M., Cosmic Star Formation History, Annual Review of Astronomy and Astrophysics 2014, 52, 415-486.
63. Cole, S.; Peterson, B.A.; Jackson, C.; Peacock, J.A.; et al., The 2dF galaxy redshift survey., Mon. Not. R. Astron. Soc. 2001, 326, 255–273.
64. Dickinson, M.; Papovich, C.; Ferguson, H.C.; Budavari, T. The evolution of the global stellar mass density at 0 < z < 3. , Astrophys. J. 2003, 587, 25–40.
65. Rudnick, G.; Rix, H.W.; Franx, M.; Labbe, I.; et al., The rest-frame optical luminosity density, colour, and stellar mass density of the universe from z = 0 to z = 3., Astrophys. J. 2003, 599, 847– 864.
66. Brinchmann, J.; Ellis, R.S. The mass assembly and star formation characteristics of field galaxies of known morphology, Astrophys. J. 2000, 536, L77–L80.
67. Elsner, F.; Feulner, G.; Hopp, U. The impact of Spitzer infrared data on stellar mass estimates. Astron. Astrophys. 2008, 477, 503–512.
68. Drory,N., Salvato,M., Gabasch,A.,et al, The stellar mass function of galxies to z~5, Astrophysical Journal 2005, 619, L131-L134.
69. Drory.N., Alvarez, M., The contribution of star formation and merging to stellar mass buildup in galaxies, The Astrophysical Journal 2008, 680, 41-53.
70. Fontana, A., et. al., The assembly of massive galaxies from near Infrared observations of Hubble deepfield south, Ap. J. Lett. 2003, 594, L9-L12.
71. Fontana, A., et al., The galaxy mass function up to z=4 in the GOODS-MUSIC sample , Astron. Astrophys. 2006, 459, 745-757.
72. Cohen, J.G. CALTECH faint galaxy redshift survey. Astrophys. J. 2002, 567, 672–701. 73. Conselice, C.J.; Blackburne, J.A.; Papovich, C. The luminosity, stellar mass, and number density evolution of field galaxies. Astrophys. J. 2005, 620, 564–583.
74. Borch,A.,Meisenheimer,K.,Bell,E.F.,et al.,The stellar masses of 25000 galaxies at 0.2<z<1.0 estimated by COMBO-17 survey, Astronomy and Astrophysics 2006, 453, 869-881.
75. Frieman, J.A.; Turner, M.S.; Huterer, D. Dark energy and the accelerating universe, Ann. Rev.Astron. Astrophys. 2008, 46, 385–432.
76. Guzzo, L.; Pierleoni, M.; Meneux, B.; Branchini, E.; et al., A test of the nature of cosmic acceleration using galaxy redshift distortions. Nature 2008, 451, 541–544.
77. Carroll, S., http://www.preposterousuniverse.com/blog/2010/02/22/energy-is-not-conserved/ 78. Maldacena, J. The large N limit of superconformal field theories and supergravity. Adv. Theor. Math. Phys. 1998, 2, 231–252.
79. Verlinde, E. On the origin of gravity and the laws of Newton, arxiv:hep-th/1001.0785v1, 2010. 80. Verlinde, E., Emergent Gravity and the Dark Universe, arXiv: 1611.02269v2, 2016.
81. McGaugh, S.S., Lelli, F., Schomobert, J.M., The Radial Acceleration Relation in Rotationally Supported Galaxies, arXiv 1609.05917v1 Sept 19, 2016.
82. Lellil, F., McGaugh,S.S., Schombert,J.M., Pawlowskil, M.S., One Law to Rule them all: the Radial Acceleration Relation of Galaxies, 23rd January, 2017, ArXiV:1610.08981v2
83. Viola, M., Cacciato, M., Brouwer,M., Kuijken, K.,et al., Dark matter halo properties of GAMA galaxy groups from 100 square degrees of KiDS weak lensing data, Mon. Not. R. Astron. Soc. 2015, 452, 3529-3550.
84. Covone, G., Paolillo, M., Napolitano, N.R., et al., Guaging the dark matter fraction in an L* S0
85. Beasley,M.A., Romanowsky,A.J., Pota,V., et al., An overmassive dark halo around an ultra- diffuse galaxy in the Virgo cluster.,Astrophysical Journal letters 2016, 819(2), L20 (8pp).
86. Grillo, C., Projected central dark matter fractions and densities in massive early-type galaxies from the Sloan Digital Sky Survey, Astrophysics Journal 2010, 722, 779-787.
87. Stott,J.P., Swinbank,A.M., Johnson,H.L., et al., The KMOS Redshift One Spectroscopic Survey (KROSS): Dynamical properties, gas and dark matter fractions of typical z~1 star-forming Galaxies, Mon. Not.,R. Astron. Soc. 2016, 457, 1888-1904.
88. Genzel,R.,Forster Schreiber,N.M.,Ulber,H.,Lamg,P., et al., Strongly baryon-dminated disk galaxies at the peak of galaxy formation ten billion years ago, Nature 2017, 543, 397-401. 89. Bland-Hawthorn, J. & Gerhard, O. The galaxy in context: structural, kinematic, and integrated properties. Annu. Rev. Astron. Astrophys. 2016, 54, 529–596.
90. Gupta,A., Mathur,S., Krongold,Y., Nicastro,F., Galeazzi,M., A huge reservoir of ionised gas around the milky way accounting for the missing mass? Astrophysical Journal Letters 2012, 756, L8 (6pp).
91. Markevich,M., Gonzalez,H., Clowe,D., Vikhlinin,A., et al., Direct constraints on the dark matter self-interaction cross-section from the merging galaxy cluster 1E0657-56, Astrophys. J. 2004, 606 (2), 819–824.
92. Harvey, D., Massey, R., Kitching, T., Taylor, A., & Tittley, E. The non gravitational interactions of dark matter in colliding galaxy clusters, Science 2015, 347, (62290), 1462-1465.
93. Massey, R., Williams, L., Smit, R., Swinbank, M., et al., The behaviour of dark matter associated with four bright Cluster galaxies in the 10kpc core of Abell 3827. Monthly Notices of the Royal Astronomical Society 2015, 449(4), 3393-3406.
94. Miyatake, H., More,S., Takada, M., Spergel, D.N., et el., Evidence of Halo Assembly Bias in Massive Clusters. Phys. Rev. Lett. 2016, 116, 041301 (5pp).
95. Popper, K. The Logic of Scientific Discovery, Routledge: London, UK, 1959. 96. Cho,A., Crunch time for dark matter hunt, Science 2016, 351, 1376-1377.
97. Friedman, A., Z. Phys. 1922, 10, 377, English translation in: Gen. Rel. Grav. 1999, 31, 1991. 98. Einstein,A., Sitzungsber. Berl. Koniglich Preussische Akademie der Wissenschaften 1917, 1, 142. 99. Weinberg, A., Gravitation and Cosmology 1972, Wiley, New York.
100. Conselice, C.J., Wilkinson, A., Duncan, K., Mortlock, A., The evolution of galaxy number density at Z<8 and its implications, arXiv 1607.03909v2, 2017.
101. Brown, A. G. A. et al. Gaia Data Release 1, Summary of astrometric, photometric, and survey properties. Gaia Collaboration , Astronomy and Astrophysics 2016, manuscript no aa29512-16. 102. Chevallier, M.; Polarski, D. Accelerating universes with scaling dark matter. Int. J. Mod. Phys. D 2001, 10, 213–224.
103. Rest, A., Scolnic, D., Foley, R.J., Huber, M.E., et al., Cosmological constraints from measurements of type 1A supernovae discovered during the first 1.5 years of the Pan_STARRs1 survey, ArXiv 1310,3828v2, 2014.
104. Shafer, D.L. & Huterer, D., Chasing the phantom: A closer look at type 1A supernovae and the dark energy equation of state, Phys. Rev. D 2014, 89, 063510(11pp).
105. Cheng, C., & Huang, Q-G., Dark side of the universe after Planck data, Phys. Rev. D 2014, 89, 043003, (8 pp).
106. Xia, J-Q., Li, H., Zhang, X., Dark energy constraints after new Planck data, Phys. Rev. D 2013, 88, 063501 (8 pp).
107. Delubac, T., Bautista, J.E., Busca,N.G., Rich,J., et al., Baryon acoustic oscillations in the Lyα forest of BOSS DR11 quasars, Astronomy and Astrophysics 2015, 574, A59 (17pp).
108. Riess,A.G., Macri,L.M., Hoffmann,S.L., et.al., A 2.4% determination of the local value of the Hubble constant, ArXiv 1604.01424v1, 5 April 2016.
May16, 2005.
110. Feng, C-J, Shen, X-Y, Li,P., Li, X-Z, A new class of parameterization for dark energy without divergence, ArXiv 1206.0063v1, 2012.
111. Sendra,I., Lazkoz,R., SN and BAO constraints on (new) polynomial dark energy
parameterizations: current results and forecasts. Mon. Not. R.Astron. Soc. 2012,422, 776-793. 112. Liu, D-J, Li, X-Z., Hao, J., Jin, S-H, Revisiting the parameterization of equation of state dark energy via SN1a data, Mon. Not. R. Astron. Soc. 2008, 388, 275-281.
113. Ichikawa,K., Takahashi,T., Dark Energy parameterizations and the curvature of the universe. ArXiv astro-ph/0612739v2 6 Feb 2007.
114. De Felice,A., Nesseris,S., Tsujikawa, S., Observational constraints on dark energy with a fast varying equation of state, J. Cosmology and Astroparticle Physics 2012, (19pp)doi:10.1088/1475- 7516/2012/05/029.
115. Johri,V.B.,Rath,P.K., Parameterization of dark energy equation of state, ArXiv astro-ph/ 0510017v2 28 Oct 2005.
116. Corasaniti, P.S.; Copeland, E.J. Model independent approach to the dark energy equation of state. Phys. Rev. D 2003, 67, 063521.
117. Anderson, L.; Aubourg, E.; Bailey, S.; Beutler, F.; et al. The clustering of galaxies in the SDSS-III baryon oscillation spectroscopic survey. 2013, arXiv1312.4877, 17 December, 2013. 118. Euclid Definition Study Report ESA SRE 29 September 2011. Accessed 19 February 2016, sci.esa.int/Euclid/48983-euclid-definition-study-report-esa-sre-2011-12/
119. NASA WFIRST Science definition report, Accessed 19 February 2016,
wfirst.gsfc.nasa.gov/science/sdt_public/WFIRST-AFTA_SDT_Interim_Report_April_2014.pdf 120. Schlegel, D.J.; Bebek, C.; Heetderks, H.; Ho, S.; et al., The ground-based StageIV BAO Experiment, arXiv: 0904.0468v3, 2009.
121. Morandi, A., Sun, M., Probing dark energy via galaxy cluster outskirts, Mon. Not. Roy. Astr. Soc. 2016, 457, 3266-3284.
122. Sokol, J., Hubble trouble, Science 2017, Vol 355, Issue 6329, 1010-1014. 123. Perivolaroulos, L., Six Puzzles for LCDM cosmology, ArXiv: 0811.4684, 2008.
124. Perivolaroulos, L., ɅCDM: Triumphs, Puzzles, and Remedies, ArXiv: 1104.0539, 2011.
125. Perivolaroulos, L., Shafieloo, A., Bright high z Sn1a: A challenge for ɅCDM, Phys. Rev. D 2009, 79, 123502.
126. Ivezic, Z., Tyson, J.A.; Acosta, E.; Allsman, R.;et al., LSST: From science drivers to reference design and anticipated data products, arXiv: 0805.2366v2., 2011.
127. Dark Energy Survey Proposal. Available online,www.darkenergysurvey.org/reports/ Proposal-standalone.pdf, accessed april 3rd2017.
![Fig.2. Observed fDM compared with average ɅCDM fDM and the HDIE/baryon fHDIE bound. Survey results, square symbols: Dark Blue, 1.7 x10⁵ massive early-type galaxies z<0.33 [86], Light Blue, 584 typical star-forming galaxies, z=0.8-1.0 [87], Purple, 92 st](https://thumb-us.123doks.com/thumbv2/123dok_us/1077054.1608407/8.595.100.491.113.341/observed-compared-average-results-symbols-galaxies-galaxies-purple.webp)