A novel method to calculate objects’ apparent size
-
Ermanno Lo Cascio
*Abstract
The angular diameter is the angle subtended by a generic object – an apple or a star – to the
eye of an observer, and it describes how large the object appears from a given viewpoint.
The angular diameter represents a powerful tool for distance calculations starting from a
directly measurable information and it finds application in several contexts varying from
cosmography to architecture. In this article, the author proposes a novel equation to calculate
the apparent diameter of whatever object. This equation defines the relationship between the
object’s apparent diameter with respect to the travelled distance starting from the initial
distance R0 at which the observed object is located. Based on the preliminary tests conducted,
the model seems to faithfully portray this relation with respect to measured values, also at
the astronomical scale, thus considering the Earth-Moon distance, where, the absolute error
detected is about 0.56%. Tests highlight also a dependency between the results accuracy and
the measurement conditions suggesting a high level of sensibility linked to the initial
magnification effect produced by the retina or the artificial lens employed.
Keywords: apparent size; angular diameter distance; apparent diameter
*Please address all the correspondence to: [email protected]
2
1.
Introduction
The angular diameter is the angle subtended by a generic object – an apple or a star – to the eye of an observer, and it describes how large the object appears from a given viewpoint. To be more precise, the perceived size of an object is presumably further affected by the visual processing mechanisms that involve the eye and the brain’s primary visual cortex (V1) [1]. These mechanisms, in certain circumstances, might be responsible for visual alterations generating illusory effects, e.g. moon illusion [2]. In other circumstances, instead, when the eyes are adjusted for near vision, an object of fixed angular size looks smaller than when they are adjusted for far vision [3], and this issue has been explained by Wheatstone [4] – the inventor of the stereoscope – in 1854. Notoriously, other possible factors affect the perception of an object’s size and these are linked to psychological issues [5] or even the age of the observer [6]. However, excluding all these latter, the perceived size of an object decreases as its distance from the observer increases, and vice versa. Thus, the calculation of the apparent diameter of an object can be carried out by employing an elementary trigonometric equation:
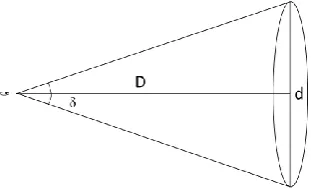
Where, as shown in Fig. 1, δ represents the angular diameter (or angular dimension), D is the relative distance between the observer and the observed object – a circle in this case – whereas d is the actual diameter of the observed object.
Figure 1. Angular diameter representation.
If the actual size of an object is known, Eq. 1 represents a powerful tool for distance calculations starting from a directly measurable information. At astronomical scale, for instance, given as known the actual size of the Moon i.e. 3.476 km [7], at the perigee, one can measure an angular diameter of about 1.986 arcsec (0.526 degree). Thus, from Eq. 1, it can be easily derived that the relative distance of the Moon for an observer on the Earth is approximately 378.000 km. Cosmological distance measures can be carried out with several methods, whose first was initially introduced by Aristarchus of Samos [8], to further evolve in more sophisticated methods enabled by technological progress and adapted to the cosmological model taken into consideration [9]. To this aim, for instance, Cowley [10] provided a simple method to determine the Earth-Moon distance based on the use of lunar eclipse photos to determine the diameter of the Earth’s shadow. In [11], Pellizza et al. presented an experimental technique for determining the distance to the Moon, based on measuring the change of the angular size of the lunar disk, generated by the rotation of the Earth occurring in several hours. Concluding, several further methods are available to measure the distance between two points for cosmography purpose, as described in [9] and these are luminosity distance, parallax distance, comoving distance, etc.
In this article, a novel correlation to calculate the objects’ apparent diameter is presented. The accuracy of the model is tested based on measured data at a local scale, where objects’
𝛿 = 2 arctan ( 𝑑
3
actual size is known a priori, and for astronomical scale, where celestial objects’ actual size is estimated through alternative consolidated methods.
2.
Size – distance relation
If we consider an apple, notoriously its apparent size varies with the distance from the observer: the closer the observer gets to the apple, the bigger the apparent size of the apple will be perceived. Eq. 2, represents the novel relation proposed in this article to calculate the variation of the apparent size with respect to the relative distance between the observer and the observed object – the apple.
𝜏 = 𝑅
2
𝑅𝑜2− 𝑅0𝑅
(2)
In (2), R represents the relative distance travelled by the moving observer (or the object) with respect to its starting point. Whereas R0 represents the initial relative distance between the moving observer and the fixed observed object. If the R0 is known, the linear apparent size of the observed object (𝑑𝑎𝑝𝑝) can be calculated as:
𝑑𝑎𝑝𝑝 = 𝑑𝑖𝑛𝑖𝑡𝑖𝑎𝑙+ 𝑑𝑖𝑛𝑖𝑡𝑖𝑎𝑙× 𝜏 (3)
Where, dinitial stands for the initial observed apparent linear diameter of the object, measurable at R0. Fig. 2 shows the trend of the factor τ for an initial adimensional distance R0 equal to 1. Here, at a relative adimensional distance of 0.02, corresponds a τ value of about 48,02.
Figure 2. Trend of the τ factor.
3.
Model testing
To verify the accuracy of Eq. (2) and (3), different tests have been conducted. Preliminary tests – at local scale – have been undertaken with the support of a camera and a simple lens (Canon EF LENS, 50 mm 1:1.8 STM) but, image distortions due to lens magnification risks to sensibly affect the measurements of the linear size of the target. To avoid distortions generated by the various apparatus, tests have been further undertaken with naked eyes at different local scales. Of course, it is worth highlighting that, even if minimally, also the human eye produces unavoidable slight alterations. To this aim, the simple and preliminary set-up shown in Fig. 2 has been employed.
Figure 3. Set-up for model testing.
Regarding Fig. 3, three main elements have been employed: a ruler (R1) to measure the apparent linear size of the target (T1) and another ruler (R2) to measure the position of the T1, for the initial distance R0.The distance
0 10 20 30 40 50
0 0,2 0,4 0,6 0,8 1
τ
4
between the observer’s eye and R1, (O1-R1), corresponds roughly to the minimal distance allowed by the human eye which is about 10 cm ± 5% [12], and it has been kept constant during the entire experiment. This would ensure an adequate compromise between the clear perception of the image (due to retinal accommodation natural limits) and magnification effects. The T1 has been progressively approached to the O1, starting from R0 =15 cm, with a 1 cm step. The target
T1 measures 8.5×5.5 cm. A comparison between the predicted and measured linear diameter is also presented, and the absolute percentage error has been calculated as:
𝑒𝑟𝑟 =(𝑑𝑎𝑝𝑝
𝑝𝑟𝑒𝑑𝑖𝑐𝑡𝑒𝑑
− 𝑑𝑎𝑝𝑝𝑚𝑒𝑎𝑠𝑢𝑟𝑒𝑑)
𝑑𝑎𝑝𝑝𝑝𝑟𝑒𝑑𝑖𝑐𝑡𝑒𝑑 × 100 (4)
4.
Results and discussion
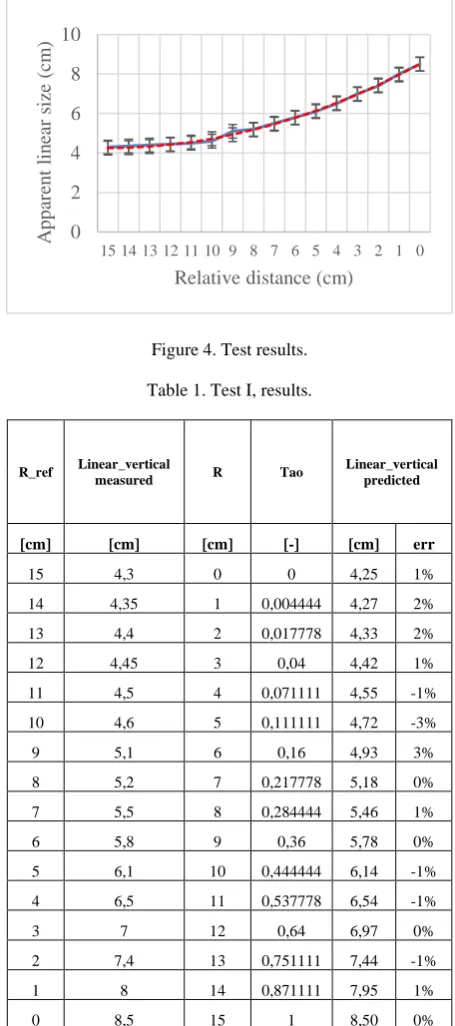
A comparison between the predicted apparent linear diameter and the measured one is presented in Fig. 4. Results generated by the model – Eq. (3) – highlights a coherent and accurate description of the variations of the linear size for the relative distance between the observer and the target. Precisely, an average absolute percentage error of about 0.36% has been detected for the 16 measure points, and, this error, is presumably entirely linked to the accuracy of the measuring process. As shown in table 1, the maximum absolute percentage error achieved in this test has been detected to be at points 10 and 9 cm, with an error of -3% and 3% respectively. It is fundamental to underline that the accuracy of the results of the model depends on various conditions as described in the previous sections, but, in this perspective, the initial linear size measured at R0 and the O1-R1 distance have resulted to be the most sensible parameters. For example, for an approaching target, if the O1-R1 distance is set to 40 cm instead of 10 cm, a magnification effect is produce by the eye
– whose detailed origin explanation is not within the objective of this article – and the
dinitial at 15 cm distance would measures 6,1
cm, thus generating an initial condition that would result in a final overestimation of the apparent predicted linear diameter, characterized by an absolute percentage error of about 46% at R=0. To avoid this, O1-R1 distance must be properly set even if the focus of the target is sensibly undermined.
Figure 4. Test results. Table 1. Test I, results.
R_ref Linear_vertical
measured R Tao
Linear_vertical predicted
[cm] [cm] [cm] [-] [cm] err
15 4,3 0 0 4,25 1%
14 4,35 1 0,004444 4,27 2%
13 4,4 2 0,017778 4,33 2%
12 4,45 3 0,04 4,42 1%
11 4,5 4 0,071111 4,55 -1%
10 4,6 5 0,111111 4,72 -3%
9 5,1 6 0,16 4,93 3%
8 5,2 7 0,217778 5,18 0%
7 5,5 8 0,284444 5,46 1%
6 5,8 9 0,36 5,78 0%
5 6,1 10 0,444444 6,14 -1%
4 6,5 11 0,537778 6,54 -1%
3 7 12 0,64 6,97 0%
2 7,4 13 0,751111 7,44 -1%
1 8 14 0,871111 7,95 1%
0 8,5 15 1 8,50 0%
0 2 4 6 8 10
15 14 13 12 11 10 9 8 7 6 5 4 3 2 1 0
A p p ar en t lin ea r size (cm )
5
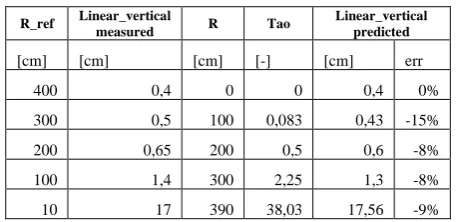
Tests conducted for other distances and with other targets have shown similar performance. For example, in table 2, the model has been tested for R0 = 400 cm and for a target (T1) of 17 × 13 cm. Precisely, the absolute error detected for this test seems to be linked to the measure at point R=100 cm, which has been calculated to be of about 15%. However, this error is once again generated by the sensibility of the eye operating in a poor focus condition. In fact, the true initial apparent linear size of the target would be presumably 0.43 - 0.45 cm at which would correspond a negligible absolute percentage error.
Table 2. Test II, results.
R_ref Linear_vertical
measured R Tao
Linear_vertical predicted
[cm] [cm] [cm] [-] [cm] err
400 0,4 0 0 0,4 0%
300 0,5 100 0,083 0,43 -15%
200 0,65 200 0,5 0,6 -8%
100 1,4 300 2,25 1,3 -8%
10 17 390 38,03 17,56 -9%
Tests for Eart-Moon distance are shown in table 3. Apparent size information for the Moon has been taken from NASA database [7] and also in this case the model seems to provide a faithful depiction of the relation between the variations of the apparent diameter with respect to the relative distance. Here – compared with the apparent linear diameter produced by the Eq. 1 – the model of Eq. 3 generates an absolute error of 0.56%.
Table 3. Test III, Earth-Moon scale, R0 = 405.696 km.
Apsis Ref mis R tao Linear_
tao Linear_ trigono metri Err %
Degree [km] [km] [km] [km]
0,488 405696 0,0 0,000 3453,1 3453,1 0
0,555 363004 42692 0,012 3495,8 3516,3 0.6
5.
Conclusions & future research
In this article, a novel equation to calculate the apparent diameter of whatever object has been proposed. This equation defines the relationship between the object’s apparent diameter with respect to the travelled distance starting from the initial distance R0 at which
6
would seem to predict faithfully the relationship between the object’s apparent diameter with respect to the travelled distance starting from the initial distance R0 at which
the observed object is located. However, future research should focus on the application and testing of the presented equation for further measuring circumstances, with the final aim to validate its consistency. This includes the contextualization of the equation performance with respect to non-Euclidean cosmological models and, also, further research should focus on the development of iterative methods to solve Eq. 3, thus, to estimate the objects’ relative distance, when R0 remains unknown.
Competing interests
7
References
[1] S. O. Murray, H. Boyaci, and D. Kersten, “The representation of perceived angular size in human primary visual cortex,” Nat. Neurosci., 2006.
[2] L. KAUFMAN and I. ROCK, “The moon illusion.,” Sci. Am., 1962.
[3] I. Press, “The Effect of Oculomotor Adjustments on Apparent Size Author ( s ): Eric G . Heinemann , Endel Tulving and Jacob Nachmias Source : The American Journal of Psychology , Vol . 72 , No . 1 ( Mar ., 1959 ), pp . 32-45 Published by : University of Illinois Pre,” vol. 72, no. 1, pp. 32–45, 2019.
[4] Wheatstone, C. (1854, December). Contributions to the physiology of vision. — Part II. On some remarkable, and hitherto unobserved, phænomena of binocular vision, — (continued). In Abstracts of the Papers Communicated to the Royal Society of London (No. 6, pp. 138-141). London: The Royal Society.
[5] I. Press, “The Influence of Assumed Size on Apparent Distance Author ( s ): William Epstein Source : The American Journal of Psychology , Vol . 76 , No . 2 ( Jun ., 1963 ), pp . 257-265 Published by : University of Illinois Press Stable URL: https://www.jstor.org/s,” vol. 76, no. 2, pp. 257–265, 2019.
[6] I. Press, “Apparent Visual Size as a Function of Distance for Children and Adults Author ( s ): H . Philip Zeigler and H . Leibowitz Source: The American Journal of Psychology , Vol . 70 , No . 1 ( Mar ., 1957 ), pp . 106-109 Published by: University of Illinois P,” vol. 70, no. 1, pp. 106–109, 2019.
[7] “NASA_Moon_Factsheet. Available online at:
https://nssdc.gsfc.nasa.gov/planetary/factsheet/moonfact.html (accessed on 09/12/2019) .
[8] M. E. W. Williams, “A. van Helden. Measuring the Universe. Cosmic Dimensions from Aristarchus to Halley. Chicago and London: University of Chicago Press, 1985. Pp. viii + 203. ISBN 0-226-84881-7. £31.50, $34.50.,” Br. J. Hist. Sci., 1987.
[9] D. W. Hogg, “Distance measures in cosmology Cosmographic parameters,” vol. 1, no. 3, pp. 1–16, 2000.
[10] E. R. Cowley, “A classroom exercise to determine the Earth–Moon distance,” Am. J. Phys., 1989.
[11] L. J. Pellizza, M. G. Mayochi, and L. Ciocci Brazzano, “An experiment to measure the instantaneous distance to the Moon,” Am. J. Phys., 2014.