Open Access
Methodology
Policymaking based on CERs: changes in costs are not the same as
changes in benefits
Andre JHA Ament* and Silvia MAA Evers
Address: Department of Health Organization, Policy and Economics, University of Maastricht, Maastricht, the Netherlands
Email: Andre JHA Ament* - [email protected]; Silvia MMA Evers - [email protected] * Corresponding author
Abstract
Background: Earlier cost-effectiveness studies showed the cost-effectiveness ratios for pneumococcal vaccination in preventing cases of Bacteremic Pneumococcal Disease (BPD) alone to vary between € 11,000 and € 33,000 per quality-adjusted life year. If vaccination is also assumed to be effective in preventing cases of Non Bacteremic Pneumococcal Disease (NBPD) (at the same level of effectiveness), vaccinating all elderly persons becomes highly cost-effective or even cost saving.
Methods: The present article examines the effect of partial preventive power of the vaccine against cases of NBPD additional to its preventive power against cases of BPD, and the consequences this has in terms of cost-effectiveness.
Results: The analysis shows that even a fairly small additional preventive power against cases of NBPD leads to a dramatic and unexpected decrease in the cost-effectiveness ratio.
Conclusion: Because a Cost-Effectiveness Ratio (CER) is a ratio, changes in costs and changes in effects have rather different influences on its value. There is a linear relation between a change in costs and a change in CER if the effects are kept constant. This linear relation is not found on the effect side. Assuming that costs are constant, a change in effect will be different for low levels of effect than for high levels.
Introduction
Data on efficacy or effectiveness are often among the cor-nerstones of the calculations of Cost-Effectiveness Ratios (CERs) and information on such effect variables is crucial for the decision-making process [1,2].
As an example, this article considers the lack of informa-tion regarding the effectiveness of the vaccine for pneu-mococcal pneumonia. There is rather strong evidence that this vaccine prevents cases of Bacteremic Pneumococcal Disease (BPD), which however represents only a minority
of cases of pneumococcal disease (about 15%) [3-7]. There is much less evidence (some experts say no evi-dence) that the vaccine also prevents cases of Non Bacter-emic Pneumococcal Disease (NBPD) [8]. Several published studies have calculated cost-effectiveness ratios (CERs) of pneumococcal vaccination programmes for the elderly [9-14]. In the earlier studies, the assumption was made that the vaccine was able to prevent cases of NBPD to the same degree as it prevents cases of BPD. The overall conclusion of the studies based on this equal effectiveness assumption was that vaccination of the elderly is highly
Published: 23 March 2005
Cost Effectiveness and Resource Allocation 2005, 3:3 doi:10.1186/1478-7547-3-3
Received: 11 May 2004 Accepted: 23 March 2005
This article is available from: http://www.resource-allocation.com/content/3/1/3
© 2005 Ament and Evers; licensee BioMed Central Ltd.
cost-effective, or indeed in many instances even cost sav-ing. However, the results of these studies did not have a great impact on the use of the vaccine in many countries. The hesitation to use the vaccine can be explained by var-ious factors, including the rigorous assumption of equal effectiveness of the vaccine for BPD and NBPD. Three more recent studies have focused on the BPD subgroup in calculating the CERs of the vaccination programme [11,13,14]. If it can be shown that the vaccine is cost-effec-tive by preventing cases of BPD alone, this would mean that the vaccine would definitely be cost-effective if it additionally prevents some cases of NBPD, which form the majority of cases. However, the three studies yielded inconsistent results. Sisk et al. [11] presented results show-ing that vaccination would save costs in the US, whereas the other two studies [13,14] presented CERs for Euro-pean countries ranging from € 10,000 and € 40,000 per quality-adjusted life year (QALY) for different age groups.
All of the above-mentioned studies regarded the preven-tive power of the vaccine against cases of NBPD as a binary variable: either the vaccine prevents no cases of NBPD or it prevents cases of NBPD to the same degree as it prevents cases of BPD. At this point, there is not much empirical evidence regarding this crucial aspect. Moreover, it is not to be expected that more specific information on the effi-cacy of the vaccine against NBPD will become available in the near future. Due to power rules, such a trial would cost a tremendous amount of money. This means that deci-sions about the introduction of the vaccine and the fur-ther expansion of its use will have to be based on present-day knowledge, with its inherent uncertainty regarding the vaccine's effectiveness.
In this article we take one further step in investigating the possible partial preventive power of the vaccine against cases of NBPD additional to its preventive power against cases of BPD, and the consequences of such additional prevention in terms of cost-effectiveness. In an earlier short article [15], we discussed the results of an additional partial effectiveness of the vaccine against cases of NBPD, and attributed the unexpected results we found merely to the fact that there are far more cases of NBPD than of BPD. Due to space limitations, we were unable to address the technical aspects of the additional analysis in that article, or to discuss the consequences in more detail. Nor were we able to explain the specific influence of the partial effectiveness of the vaccine against cases of NBPD on the resulting CERs. The present article conducts a more pro-found analysis and discusses the unexpected results in more detail. Additionally, it uses a graphical method to explain the results. It also explores why the results are unexpected, an analysis that might be useful for other investigators who are confronted with similar problems.
The next section provides some background information, together with the overall results of the European study (15), an analysis that forms the basis of all further analy-ses in this article. This is followed by a section explaining the methodological aspects of the additional analysis and presenting the detailed results of this analysis, including the influence of a potential additional preventive power against cases of NBPD. The final section further investi-gates why these results are unexpected and draws more general conclusions from the analysis.
Background
The present additional analysis is based on the results of an earlier study of the cost-effectiveness of a vaccination programme in five European countries [15]. The analysis uses clinical and economic variables that are unique to each country and considers cost savings from simultane-ous administration of pneumococcal and influenza vac-cines. In the base case analyses, the cost-effectiveness ratios for pneumococcal vaccination in preventing cases of BPD alone vary between € 11,000 and € 33,000 per QALY among the five countries. Using more plausible epi-demiological assumptions of the incidence (50 cases per 100,000) and mortality (20% to 40%) of invasive disease, the cost-effectiveness ratios are € 12,000 or less per QALY in all five countries. If vaccination is also assumed to be effective in preventing cases of NBPD (at the same level of effectiveness), vaccinating all elderly persons would be highly cost-effective or even cost saving.
The above analysis (16) included only CERs correspond-ing to extreme positions: either no preventive power against NBPD or the same degree of preventive power against NBPD as against BPD.
Our implicit assumption was that intermediate positions between these two extremes could be easily calculated by simple interpolation of the results in terms of CERs. If, for example, the CER for BPD alone in a particular country were 30,000 and the CER for BPD and NBPD were 10,000, we would expect, from a prior point of view, that, starting from the situation 'BPD alone' (CER = 30,000) an addi-tional 10% preventive power against NBPD would lead to a situation characterised by a CER of (say) 28,000 (10% of the difference between the two extremes). We did not anticipate that such a small additional preventive power would in fact have a major impact on the resulting CER. Explaining this huge difference between expectations and reality requires a stepwise analysis.
Methods
was possible to derive the CERs for intermediate steps of preventive power in an alternative way. Although the model developed for the European study is a rather com-plex and sophisticated cohort model, the outcomes of the model in terms of costs and benefits are linearly related to the input variable 'efficacy'. To calculate the costs, for example, the model starts with the incidence of the dis-ease, after which the incidence is multiplied by the effi-cacy of the vaccine. This result is then multiplied by the protection rate of the vaccine, and the resulting figure is multiplied by the number of cases hospitalised. The result is then multiplied by the number of hospital days, and finally by the cost of one hospital day. This multiplicative model leads to the conclusion that the input variable 'effi-cacy' shows a linear relation with the outcome variable 'costs', a conclusion that is verified by the model. This lin-earity is also found for the outcomes in terms of QALY's. The consequence of this linear relation is that increasing the efficacy rate (expressed as a percentage) by a certain step results in the same change in effect, expressed as QALY's or as costs. In algebraic terms the cost can be expressed in the following formulas:
1) C = a + b * x (0<x<1)
2) Q = c + d * x (0<x<1)
where:
C is costs
Q is QALY's
a, b, c and d are constant
x is vaccine efficacy for cases of NBPD
The presence of linearity in the model made it possible to interpolate between the extreme outcomes (zero preven-tion against NBPD and same efficacy against NBPD as against BPD). As an example, let us discuss the results for Scotland in more detail.
The data for 'step 0' and 'step 10' include the existing data on the costs and benefits for Scotland, which were used for the calculation of the CERs [15]. Step 0 corresponds to the situation where the vaccine is assumed to prevent only cases of BPD, whereas step 10 assumes that the vaccine prevents cases of NBPD to the same degree as it prevents BPD. The 10 intermediate steps are interpolated, based on these two extremes.
Results
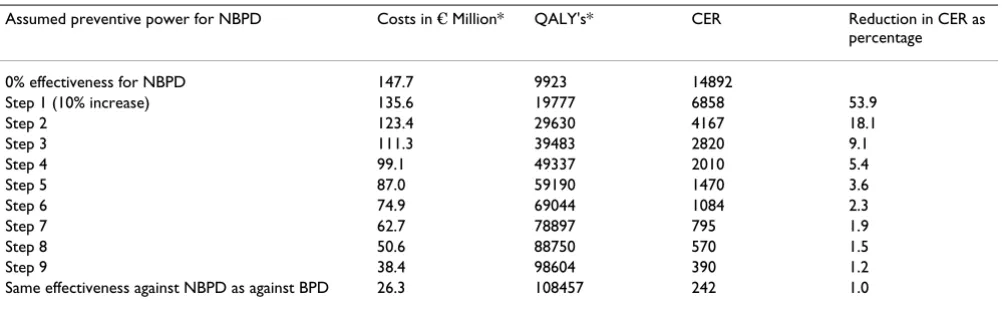
The first surprising observation that can be made from Table 1 is that in the first step, the CER drops from an ini-tial level of about € 15,000 per QALY to a level of € 7,000 per QALY. In the next step, where the vaccine is assumed to prevent an additional 10% of potential cases of NBPD, the CER drops to a level of about € 4,000. Alternatively, it can also be concluded in this case that an improvement in the effectiveness from say 70% to 100% would have not much impact on the resulting CER, as it would decrease from € 705 per QALY to € 242 per QALY! This makes pre-dicting the influence of a change in effectiveness on the CER virtually impossible. The linearity that was present in the separate calculations of costs and benefits (see the first columns of the table) is no longer found in the CERs in the final column. In this specific decision environment, this would imply that if a decision maker would refuse to finance a vaccination programme based on the hard evidence for vaccine efficacy for BPD alone, a small addi-tional preventive power of the vaccine against cases of NBPD would suffice to make it a (very) cost-effective intervention.
Table 1: Cost-effectiveness ratios for intermediate degrees of vaccine efficacy in preventing cases of NBPD in Scotland
Assumed preventive power for NBPD Costs in € Million* QALY's* CER Reduction in CER as percentage
0% effectiveness for NBPD 147.7 9923 14892
Step 1 (10% increase) 135.6 19777 6858 53.9
Step 2 123.4 29630 4167 18.1
Step 3 111.3 39483 2820 9.1
Step 4 99.1 49337 2010 5.4
Step 5 87.0 59190 1470 3.6
Step 6 74.9 69044 1084 2.3
Step 7 62.7 78897 795 1.9
Step 8 50.6 88750 570 1.5
Step 9 38.4 98604 390 1.2
Same effectiveness against NBPD as against BPD 26.3 108457 242 1.0
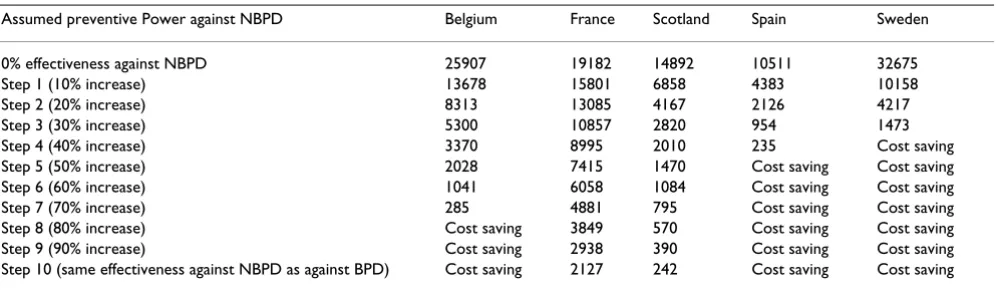
This phenomenon is by no means specific to Scotland. Table 2 shows it to be present in all five European coun-tries, although the effect is larger in some countries than in others.
From a decision analysis point of view, the changes in the first steps are particularly relevant, because they imply that a fairly small additional preventive power against NBPD makes the vaccine cost-effective. With the exception of France, the CERs in all countries decrease by 50% or more in the first step (10% preventive power against NBPD cases). In the second step (20% preventive power against NBPD) the CERs are reduced further, to even more attrac-tive levels.
This additional analysis leads to the general conclusion that a relatively small preventive power of the vaccine against cases of NBPD is enough to make vaccination for pneumococcal disease a very attractive investment com-pared with other health care interventions.
Discussion
At the start of our European study of the cost-effectiveness of the pneumococcal vaccine [15], we did not have a clue about the existence of the phenomenon described above, nor would we have thought that the impact of a small additional preventive power against NBPD would be as great as it turned out to be. This is why only the two extreme situations for the effectiveness of the vaccine were considered in our original analysis. None of the earlier articles on cost-effectiveness investigated or even men-tioned this phenomenon. What is the reason for the huge differences between reality and (our) expectations at this point?
We will answer this question in two different ways: an algebraic and a graphical way.
For the algebraic analysis the formula's 1 and 2 have to be specified a little bit further.
The costs as a function of vaccine efficacy (x) can be expressed as follows:
3) C = C0 - x * (C0- C1)
where: C0 is costs if x = 0
C1 is costs if x = 1
C0 and C1 (for Scotland) can be found in table 1 and are € 147.7 million and € 26.3 million respectively.
The cost as a function of vaccine efficacy for NBPD is therefore:
4) C = 147.7 * 106 - x * 121.4 * 106
The number of QALY's as a function of vaccine efficacy (x) can be expressed as follows:
5) Q = Q0 - x * (Q0-Q1)
where: Q0 is number of QALY's if x = 0
Q1 is number of QALY's if x = 1
Q0 and Q1 (for Scotland) can be found in table 1 and are 9923 and 108457 respectively.
The QALY's as a function of vaccine efficacy for NBPD is therefore:
6) Q = 9923 - x * 98534
Table 2: Cost-effectiveness ratios for intermediate degrees of vaccine efficacy in preventing cases of NBPD in 5 European countries.
Assumed preventive Power against NBPD Belgium France Scotland Spain Sweden
0% effectiveness against NBPD 25907 19182 14892 10511 32675
Step 1 (10% increase) 13678 15801 6858 4383 10158
Step 2 (20% increase) 8313 13085 4167 2126 4217
Step 3 (30% increase) 5300 10857 2820 954 1473
The CER as a function of vaccine efficacy for NBPD has the following form:
7) f(x) = (C0 - x * (C0- C1))) / (Q0 - x * (Q0-Q1))), (0<x<1).
For x is 0 the value of the function becomes C0 / Q0, which is our original ICER for zero vaccine efficacy for NBPD. For x is 1 the value of the function becomes C1/Q1, which is our original ICER for 100% vaccine efficacy for NBPD.
It is obvious that in general de function f(x) is an expo-nential declining function, which explains, to a certain degree, the specific behaviour of the CER; huge declines in CER for low values of x and small declines when x reaches the value 1. An impression of this can be based on the data of table 1, where the CER's (of Scotland) as a function of vaccine efficacy for NBPD are given in column 4.
A graphical representation allows us to clarify the causes of this phenomenon in another way. Figure 1 shows a graphic representation of the data for Scotland. One extreme represents the costs and benefits under the assumption that the vaccine prevents only cases of BPD (S0) while the other extreme represents the assumption
that cases of NBPD are prevented to the same degree as those of BPD (S10). The other points represent the costs and benefits in the consecutive steps. Due to the linearity of the model, these 10 steps are positioned on a straight line, and indicated as S1, S2 etc.
But why do the CERs for S0 to S10 show non-linear behaviour?
We have to show that equal steps in costs and/or benefits do not automatically lead to equal differences in CERs. The first step (10% preventive power against NBPD) takes us to point S1. Starting from S0, there are numerous alternative ways in which a CER of this level could be reached. One of these ways would be to lower the cost from S0 to level A1 (see figure), another to increase the benefits from S0 to B1, but other combinations are also possible. A1, S1 and B1 are on the same line through the origin and therefore have the same CER.
Starting from S0, a rather small increase in benefits has the same effect (in terms of CER) as a rather large decrease in costs. Looking at the steps from S9 to S10, we see the oppo-site: in this area a rather small decrease in costs has the
Costs and benefits of intermediate steps of partial effectiveness against NBPD for Scotland Figure 1
same impact as a rather huge increase in benefits. It will be clear from this observation that the ratio between costs and benefits changes in each of the 10 steps. This phe-nomenon can be visualised in a different way, using the structure of CERs.
As many authors have suggested, CERs can be visualised in graphic representations [[1,2,16-18], and [19]]. These graphs may help to identify the most cost-effective inter-ventions within a set of compatible (mutually non-exclu-sive) alternatives. Graphs can also be helpful in identifying the best candidate in a set of incompatible (mutually exclusive) alternatives [17]. Often there is no need to pay attention to the precise underlying structure of CERs. For exemple, Laupacis et al. [16] in their original article drew CER lines in a rather arbitrary way.
The above observations do not hamper decision-making, as long as only 'ordinal' conclusions are drawn, for exam-ple, that intervention A is more cost-effective than inter-vention B. However, absolute changes in the position of an intervention in the graph might lead to unexpected results, as will be shown below.
In figure 2 the exact position of different CER-lines are drawn, based on figure 1. The figure clearly shows that dif-ferent incremental increases in preventive power of the vaccine must lead to different effects on the resulting CER. The first increase in preventive power against cases of NBPD (step 1) cuts from a CER of (about) € 15,000 per QALY through a whole series of nearby CER lines and ends up at a CER of € 7,000 per QALY. The next step would bring this down further, to a CER of € 4,000, a rel-atively minor decrease compared with the previous step. In absolute terms, however, both steps are identical, in that they consist of the same decrease in costs and benefit.
The above analysis allows the conclusion that a particular change in costs and benefits will not lead to a fixed change in the CER. The impact of such a change in costs and/or benefits on the resulting CER depends on the starting point in the graph. In our example, it could be said that the position of the line S0-S10 determines the resulting CER. This is the reason why the effects of a partial effec-tiveness of the pneumococcal vaccine against NBPD are different in different countries.
CERs for technologies characterised by costs per QALY of € 1,000, € 2,000, € 3,000 etc Figure 2
Conclusion
If the pneumococcal vaccine has even a small preventive power against NBPD, this would make vaccination against pneumococcal pneumonia a very cost-effective intervention. While it is very unlikely that the vaccine is as effective in preventing cases of NBPD as it is in preventing cases of BPD, it is also unlikely that the vaccine does not prevent any cases of NBPD. The above analysis shows that a very small additional preventive power against NBPD (about 5 to 10%) changes the cost-effectiveness of this vaccination programme, on average, from a level just below the maximum value per QALY (€ 20,000 per QALY) to a level of € 10,000 per QALY, a level that in most industrialised countries would be considered a good health investment. Without the above analysis, policy-making would be very complicated, because of the uncer-tainty about the preventive power and the unceruncer-tainty about the maximum value per QALY. With this analysis, there is less uncertainty and policymakers can be more confident in deciding to introduce the vaccination pro-gramme for the population aged 65 and older.
Is there a more general principle behind the above phenomenon?
To answer this question we have to look back to the con-cept of CER itself. CER is defined as (incremental) costs divided by (incremental) effects. It is obvious that a CER increases as costs increase, if the effects are kept constant. An increase in cost by an amount x will lead to an increase in CER of y, independent of the volume of the costs. There is a linear relation between a change in costs and a change in CER if we keep the effects constant.
This linear relation is not found on the effect side. Assum-ing that the costs are constant, a change in effect will be different for low effect levels than for high levels. Adding 1 QALY to an intervention that produces 1 QALY leads to a reduction of 50% in CER, whereas adding 1 QALY to 10 QALY's results in a 10% reduction in CER. With regard to effects, a relative increase will always lead to the same change in CER, whereas with regard to the costs, an abso-lute change will lead to the same change in CER. In the above case of a partial increase in preventive power, the costs and benefits increase by the same amount in each step, but we now see that it is merely the effects that lead to the unexpected results: merely changing the costs by a particular amount would not have this effect. We stated above that our model was a multiplicative model as regards costs and effects. We used this property of the model only to calculate costs and benefits corresponding to intermediate steps in preventive power in an easy man-ner. We can therefore conclude that the above results are not restricted to this type of linear model, but are to be
expected in general. The above phenomenon depends on the ratio approach, not on the model used.
The above analysis leads to several observations In the first place, intuition might be not a good instrument to predict the CER consequences of changes in costs and (especially) benefits. In the above example the conse-quences of partial effectiveness of the pneumococcal vac-cine for the CERs were totally unexpected. In the example, the effectiveness determines both costs and benefits of the CER, which makes prediction of effects more complicated. Researchers who are thinking of performing sensitivity analyses should be aware of the fact that in some cases even very small changes in variables could have huge impacts on the resulting CERs. It will not always be easy to anticipate or predict this impact, due to the exponential character of the CER itself.
Laupacis et al. (1992) were among the first to use graphs to represent CERs of different interventions, although the principle had already been described as early as 1986 (See for example Anderson et al., 1986). Gold et al. suggested that researchers should make use of such graphs, because they are handsome, concise and easy to understand. In their original graph, Laupacis et al. represented two CERs: one for interventions with a CER of $20,000 and the other with a CER of $100,000. The two lines in their figure are drawn rather arbitrarily, whereas in reality the position of the two lines should be fixed (see above). In analysing the results in a graph, one should understand the underlying structure of the CERs (see figure 2), especially in cases where interventions are presented in absolute positions, as was the case in our example of the pneumococcal vac-cine. If the graph is used to prioritise compatible alterna-tives according to cost-effectiveness, using the wrong graph would be no big problem. However, if one is inter-ested in identifying the best candidate within a set of incompatible alternatives, using the right framework becomes crucial.
Publish with BioMed Central and every scientist can read your work free of charge "BioMed Central will be the most significant development for disseminating the results of biomedical researc h in our lifetime."
Sir Paul Nurse, Cancer Research UK
Your research papers will be:
available free of charge to the entire biomedical community
peer reviewed and published immediately upon acceptance
cited in PubMed and archived on PubMed Central
yours — you keep the copyright
Submit your manuscript here:
http://www.biomedcentral.com/info/publishing_adv.asp
BioMedcentral the cost-effectiveness of one particular technology from
(for example) € 10,000 to € 20,000 than to improve the cost-effectiveness of another technology from € 50,000 to
€ 60,000. This means that the cost-effectiveness scale in itself is not a cardinal scale but only an ordinal scale. Needless to say, the incremental-net-benefit parameter recently proposed by many authors behaves in a much more straightforward way in this respect than the above incremental CER, providing another argument in favour of the net benefit approach.
Competing interests
The original study was supported by a grant of Aventis Pasteur MSD. The above study was performed totally independent from Aventis Pasteur MSD.
Authors' contributions
The authors worked together in close cooperation on the concepts and methodological aspects of the study. The first author produced the first drafts, whereas the second author produced many valuable contributions.
References
1. Drummond MF, O'Brien B, Stoddart GL, Torrance GW: Methods for the Economic Evaluation of Health Care Programmes Oxford University Press: Oxford; 1997.
2. Gold MR, Siegel JE, Russell LB, Weinstein MC: Cost-effectiveness in Health and Medicine Oxford University Press: Oxford; 1996. 3. Fine MJ, Smith MA, Carson CA, Meffe F, Sankey SS, Weissfeld LA,
Detsky AS, Kapoor WN: Efficacy of pneumococcal vaccination in adults. A meta-analysis of randomized controlled trials.
Arch Intern Med 1994, 154(23):2666-2677.
4. Fedson DS: The clinical effectiveness of pneumococcal vacci-nation: a brief review.Vaccine 1999, 17(Suppl 1):S85-90. 5. Hutchison BG, Oxman AD, Shannon HS, Lloyd S, Altmayer CA,
Tho-mas K: Clinical effectiveness of pneumococcal vaccine. Meta-analysis.Can Fam Physician 1999, 45:2381-2393.
6. Nichol KL, Baken L, Wuorenma J, Nelson A: The health and eco-nomic benefits associated with pneumococcal vaccination of elderly persons with chronic lung disease.Arch Intern Med 1999, 159(20):2437-2442.
7. Shapiro ED, Berg AT, Austrian R, Schroeder D, Parcells V, Margolis A, Adair RK, Clemens JD: The protective efficacy of polyvalent pneumococcal polysaccharide vaccine. N Engl J Med 1991, 325(21):1453-1460.
8. Moore RA, Wiffen PJ, Lipsky BA: Are the pneumococcal polysac-charide vaccines effective? Meta-analysis of the prospective trials.BMC Fam Pract 2000, 1(1):.
9. Sisk JE, Riegelman RK: Cost-effectiveness of vaccination against pneumococcal pneumonia: an update.Ann Intern Med 1986, 104:79-86.
10. Plans-Rubio PP, Morales PG, Sanmarti LS: Coste-efectividad de la vacunacion neumococia en Cataluna.Rev Esp Salud Publica 1995, 69:409-417.
11. Jimenez FJ, Guallar P, Rubio C, Villasante P, Guallar E: Cost-effec-tiveness analysis of pneumococcal vaccination in the elderly Spanish population.Brit J of Med Econ 1996, 10:193-202. 12. Sisk J, Moskowitz AJ, Whang W, Lin JD, Fedson DS, McBean AM,
Plouffe JF, Cetron MS, Butler JC: Cost-effectiveness of vaccina-tion against pneumococcal bacteremia among elderly people.JAMA 1997, 278:1333-1339.
13. Baltussen R, Ament A, Leidl : Cost-effectiveness of vaccination against pneumococcal pneumonia in The Netherlands.Eur J of Public Health 1997, 7:153-161.
14. Postma MJ, Heijnen MA, Jager JC: Cost-effectiveness analysis of pneumococcal vaccination for elderly individuals in The Netherlands.Pharmacoeconomics 2001, 19(2):215-222.
15. Ament A, Baltussen R, Ortqvist A, Jöhnsson B, Verhaegen J, de Graeve D, Gaillat J, Rigaud-Bully C, Christie P, Salazar Cifre A, Vivas D, Loiseau C, Fedson D: The cost-effectiveness of pneumococ-cal vaccination for older people: a study in five western euro-pean countries.Clin Infect Dis 2000, 31:444-450.
16. Ament A, Fedson DS, Christie P: Pneumococcal vaccination and pneumonia: even a low efficacy is cost-effective.Clin Infect Dis
2001, 33:2078-2079.
17. Laupacis A, Feeny D, Detsky AS, Tugwell P X: How attractive does a new technology have to be to warrant adoption and utili-zation? Tentative guidelines for using clinical and economic evaluations.CMAJ 1992, 146(4):473-481.
18. Ament A, Baltussen R: Interpreting the results of economic evaluation; explicating the value of health.Health Economics
1997, 6:625-635.