R E S E A R C H A R T I C L E
Open Access
Women are considerably more exposed to
intimate partner violence than men in Rwanda:
results from a population-based, cross-sectional
study
Aline Umubyeyi
1,3*, Ingrid Mogren
2, Joseph Ntaganira
1and Gunilla Krantz
3Abstract
Background:Intimate partner violence (IPV) against women is an important, yet often neglected public health issue. The existence of gender norms imbalance expressed by men’s and women’s attitudes in relation to power and decision-making in intimate relationships may influence the magnitude of IPV. The aim of this study was to investigate the prevalence and potential risk factors of physical, sexual and psychological IPV in young men and women in Rwanda.
Methods:This population-based, cross-sectional study included a representative sample of men and women from the Southern Province of Rwanda. Face-to-face interviews were performed using the World Health Organization (WHO) questionnaire for violence exposure to estimate past year and earlier in life IPV occurrence. Risk factor patterns were analyzed by use of bi- and multivariate logistic regression.
Results:Women were, to a considerably higher extent, exposed to physical, sexual and psychological IPV than men. Of the women, 18.8% (n = 78) reported physical abuse in the past year, compared to 4.3% (n = 18) of men. The corresponding figures for women and men for sexual abuse were 17.4% (n = 71) and 1.5% (n = 6),
respectively, and for psychological abuse, the corresponding figures were 21.4% (n = 92) and 7.3% (n = 32). Findings illustrate that violence against women was recurrent, as the highest frequency (>3 times) dominated in women for the various acts of all forms of violence. Identified risk factors for women’s exposure to physical violence were being low educated, having poor social support, being poor and having many children. For men exposed to physical violence, no statistically significant risk factor was identified.
Conclusions:In this setting, IPV exposure was more common in women than men in the Southern Province of Rwanda. Promotion of gender equality at the individual level is needed to make a positive difference in a relatively short term perspective. Men’s lower reporting of IPV confirms women’s subordinate position, but men’s denial of incidents could also explain the gender role pattern.
Keywords:Intimate partner violence, Rwanda, Prevalence, Risk factors, Exposure, Young men and women
* Correspondence:[email protected]
1Department of Epidemiology and Biostatistics, School of Public Health,
College of Medicine and Health Sciences, University of Rwanda, P.O Box 5229, Kigali, Rwanda
3
Department of Public Health and Community Medicine, Sahlgrenska Academy at Gothenburg University, Gothenburg, Sweden
Full list of author information is available at the end of the article
Background
Intimate partner violence (IPV) directed at women com-monly occurs in all settings but with variations in preva-lence and frequency [1]. However, only few studies present data on men’s exposure and these are mainly from high in-come countries [2,3]. In studies that include both men and women, a general finding is that men report less exposure to physical and sexual violence while psychological vio-lence exposure is more evenly distributed, irrespective of time periods under investigation, i.e. past year or lifetime occurrence [3,4].
Studies from Sub-Saharan Africa on women’s exposure to IPV report past year exposure to physical and/or sex-ual violence at a range between 14 and 41% [5,6], but studies on both women’s and men’s exposure to IPV are rare. However, the 2011 Ugandan Demographic and Health Survey reports a high exposure rate of lifetime spousal physical violence for men and women (26% and 37% respectively) [7]. Important to note is that in studies in which both women and men are included, only women are asked about IPV exposure while men are regarded solely as perpetrators, with their personal characteris-tics analysed as tentative risk factors [8-10]. One study including both men and women failed to ask the men, but instead inquires women about both exposure and perpetration of IPV [11]. Findings reveal that women report being exposed to IPV to a considerably higher extent than their own perpetration of violence [11]. In addition, one study using data reported from seven countries in Eastern and Southern Sub-Saharan Africa with Rwanda included, confirms that women are more exposed to IPV than men [12].
Further, a number of studies from Sub-Saharan African countries have found that men and women justify wife-beating when the wife does not behave as expected, such as when arguing with the husband, neglecting the children, leaving home without informing their partner or refusing sex [8,13]. From Rwanda, the finding was that almost 50% of men and more than 60% of the women carried such attitudes [13]. This signifies that woman’s transgression of existing gender norms is considered an accepted reason for wife-beating by both women and men [13]. Important to remember, the gender norms and values in any society form an important part of the culture and are exemplified by men’s and women’s re-lationships and behaviour in everyday life. The power of men over women is deep-seated in all aspects of life and accepted as normal in most societies [14]. The Rwandan society is patriarchal society, where men occupy a domin-ant social position with control of resources and power while women are in a subordinate position [15]. Men are breadwinners and primarily working outside home while the woman carries the overall responsibility for the repro-ductive and the domestic work. The most problematic
face of male domination is the use of violence against women.
Rwanda is a small, low income country located in cen-tral Africa with a population of 10.5 million inhabitants and a population density among the highest in Africa, 416 inhabitants/km2. In 2008, Rwanda adopted a law on the Prevention and Punishment of Gender-Based Violence (GBV) [16]. This includes all forms of violence, irrespective of whether exercised as so-called street violence or as IPV. The minimum penalty is a prison sentence of six months, while sexual abuse or rape that results in terminal illness or death of one’s spouse will lead to a sentence of life imprisonment.
Two studies conducted in Rwanda on IPV prevalence and its risk factors focused on pregnant women [17,18], in which past year prevalence of physical IPV is esti-mated to 35.1% [17]. Both studies report on acts such as hair pulling, slapping, choking, punching with fists, kick-ing and burnkick-ing with a hot liquid [17,18]. Only one study explores globally physical IPV against men and women; but was conducted on a small sample of partici-pants (16–51 years) enrolled in another quasi-experimental study. Nonetheless, it reports that 17% of the men and 29.7% of the women were victims of IPV in the past 3 months [19]. In conclusion, there is to date no study from Rwanda that investigates all forms of IPV in a repre-sentative population-based sample including both men and women.
The aim of this study was therefore to investigate the prevalence and frequency of physical, sexual and psycho-logical intimate partner violence exposure in young men and women in Rwanda, and the risk factors associated with this exposure.
This study forms part of a project on violence and other traumatic episodes, mental health and barriers to care among young men and women,The Rwandan Violence, Mental Health and Barriers to Care project (RwVMHBC-project).
Methods
Study design, study population and sample size
A cross-sectional study was conducted on a population representative sample of young adults, aged 20 to 35 years. The sample size was calculated based on an expected pro-portion of physical violence against women in the last 12 months equivalent to 20% [20], a desired level of abso-lute precision of 5% and an estimated design effect of 1.5. Accordingly, the study aimed to include 443 men and 443 women. The final sample consisted of 440 men and 477 women, with only two refusals to participate, which gave a response rate of 99.8%.
A multi-stage random sampling was used to identify households for inclusion. The selection of the primary sampling units (villages), households and study partici-pants in the eight districts was made in three steps. Firstly, out of the total number of 3512 existing villages, 35 were randomly selected by using Epi-Info random func-tion. Secondly, the number of households in each village was selected proportionate to the total number of house-holds in each village. Lastly, the person to be interviewed was randomly selected among eligible people in each house-hold, i.e. men and women aged between 20 and 35 years.
The first participant in each village was selected from the closest household to the center of the village. A calculated sampling interval in each village was applied to get the next household. If the first eligible participant was a female, the next was to be a male and the next a female then a male. Only one interview was conducted in each household for ethical reasons. If there was no eligible person living in the selected household, the closest household was approached. The rationale behind this procedure was that living condi-tions would be probably similar in a nearby household.
Data collection procedures
A questionnaire was developed containing items onphysical violence, sexual violence and psychological abuse. These items were selected from the Women’s health and life expe-riences questionnaire, a validated questionnaire developed by the WHO for research on IPV experience [21]. The ques-tionnaire was translated into Kinyarwanda, the national lan-guage in Rwanda. This instrument has been shown to be cross-culturally valid [4,22,23] and was initially intended for detection of IPV against both men and women. To date, this instrument has only been used in one male population of the ten countries included in the WHO Multi-Country Study i.e. in Samoa [21]. Of the few published validation studies at hand, one was performed on men and women separately [4,23]. This study indicates that the dimensional-ity, i.e. the distribution of the included acts into the three dimensions physical, sexual and psychological vio-lence respectively, assessed by principal components ana-lysis with a promax rotation, is not well supported for men but is for women [4,23]. However, it additionally showed that items composing the three dimensions have good internal consistency for both men and women assessed by Cronbach alpha analyses [4,23].
The University of Rwanda, College of Medicine and Health Sciences, School of Public Health (SPH) was the lead implementer of the survey. A group of 13 experi-enced interviewers, clinical psychologists by training (composed of eight females and five males) and their two male supervisors were recruited. Two days of train-ing was carried out followed by one day of questionnaire piloting. The data collection took place in the period be-tween December 2011 - January 2012 and the data entry
was performed by four skilled personnel from the SPH under the supervision of a data entry manager.
Measures
Dependent variables
Violence occurrence was measured by exposure to phys-ical violence (six items), sexual violence (three items) and psychological abuse (four items). The selected young men and women responded to exactly the same items. They were asked to indicate whether they had been ex-posed to any of the violent acts that their partner made against them either within the past 12 months or earlier in life. A three point scale was used to indicate the frequency of the various violent acts (from ‘once’ to‘2-3’times and ‘more than 3 times’) during the past year and earlier in life.
Summary measures were constructed for earlier in life and past year physical, sexual and psychological violence and finally dichotomised into any, as opposed to no vio-lence experience. The respective reference categories were hereby composed of participants with no exposure to any of the forms of violence under investigation. Past year esti-mates of physical, sexual and psychological violence were selected for further analyses as they are less susceptible to recall bias compared to earlier in life figures [24].
Independent variables
Socio-demographic and psycho-social variables for the respondents and their partners were dichotomised and analysed as independent risk factors. Age was grouped into 2 categories (20–29 years and 30–35 years).Number of childrenwas constructed with,zero to two children as the reference category and more than two children as the exposed category. Educational level was grouped into incomplete primary and higher education (compris-ing of complete primary education and above or voca-tional training). Personal income per monthwas grouped into earning 17,500Rwf or more per month as the refer-ence category in comparison with earning less than 17,500Rwf (30US$) per month as exposed category.Social supportwas defined as having a friend or family member that would assist in case of illness, or would share food, share housing, lend money, assist with guidance when problems arise and offer support when in personal prob-lems. A composite variable was constructed, dichotomised into good social support corresponding to having always, often or sometimes any of the six social support items, and poor social support equivalent to the absence of a positive response to any of the social support items.
standard (having at least one of the living standard items in the reference category) or poor living standard (having none of the living standard items in the reference cat-egory) as the exposed category. In the same way, available assetsin the household were inquired about: radio, televi-sion, refrigerator, bicycle, motorcycle, car, mobile phone and computer. These assets were merged and dichoto-mised into having at least one of the items (reference cat-egory) versus having none of the items (exposed catcat-egory).
Statistical analysis
Differences in socio-demographic factors between women and men were evaluated by the Pearson’s Chi-squared test for independence for all categorical variables. The violence exposure (n, %) and frequency of acts were used to indi-cate prevalence and perpetration of the various forms of violence. Risk factors were estimated by use of odds ratios (OR) with their 95% confidence interval (CI) in bi- and multivariate analyses to estimate predictors of past year exposure to physical, sexual or psychological violence. The multivariate analyses entered those variables that proved statistical significance in the bivariate analyses, one by one in a stepwise fashion, to control for possible con-founding variables. Different models were used for differ-ent forms of violence. Hosmer-Lemeshow test was used to check the goodness fit of the final model. IBM SPSS Sta-tistics vs. 20 was used for all statistical analyses.
This study has adhered to the STROBE guidelines on reporting of cross-sectional data Additional file 1.
Ethical considerations
The research protocol and study tools were approved for scientific and ethical integrity by the Rwanda National Ethics Committee (Review Approval Notice No 165/RNEC/2011) and the National Institute of Statistics of Rwanda (No 1043/ 2011/10/NISR). The study strictly followed WHO guidelines on ethical issues related to violence research [25] i.e. all par-ticipants were informed about their free choice to participate and to withdraw at whatever time they wanted during the study. Interviewers secured written consent from all respon-dents before the interview. To maintain confidentiality, the interview was conducted in privacy and with only one inter-view in each household. Respondents were informed that questions could be sensitive and were reassured regarding the confidentiality of their responses.
Female respondents were exclusively interviewed by female interviewers and male respondents by male inter-viewers. No identifying information was entered into the dataset to secure anonymity. As IPV is a sensitive issue, which might induce strong feelings in those exposed, participants were informed that those in need of any kind of assistance could receive this at a nearby health centre that was informed beforehand about the study taking place.
Results
Socio-demographic and psycho-social characteristics
The study participants were aged 20 to 35 years and were almost equally distributed in different age-groups, the difference between the groups of men and women was threshold of statistical significance (p = .050). More women than men were married, 72% and 54%, respect-ively. Educational attainment was low in both men and women, but more men than women had completed pri-mary school, 28.0% versus 18.6% (p = .006). The majority of the study participants were either unskilled or without any formal occupation (87.4% in men and 90.6% in women, p = .068) and most of them were earning less than 17.500 Rwandan Francs per month ( ~ 30 US$) (Table 1).
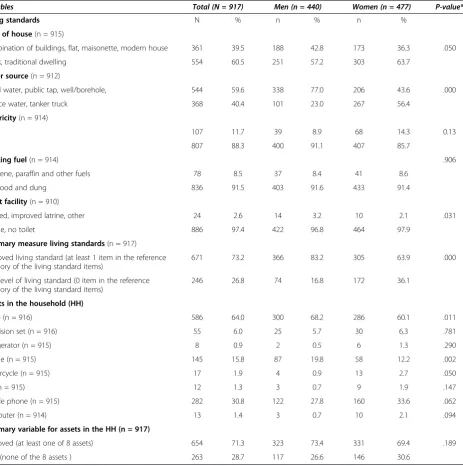
Living standards and assets in the household
As more than three quarter of the study participants and their partners were subsistence farmers, not employed, not earning an income, living standards and available assets in the household were used as a proxy for the socio-economic status. The majority had poor housing conditions, living in shacks or traditional dwellings with no electricity and no or inappropriate latrines and a large proportion of them used unsafe drinking water (Table 2). Even though an improved living standard was defined as possessing at least one item, an important proportion and mainly women were still in the poor living standard category, i.e. 36.1% of the women and 16.8% of the men, with no items indicating improved living standards. The same pattern was found for available assets in the household as a large proportion of male and female participants had none of the household assets ex-plored, (males 28.7%; females 30.6%). To illustrate the spread of items in the living standard and assets variables, only 11.0% of the total population had three or more of the living standard items and the corresponding figure for as-sets in the household was 10.8%.
Exposure to different forms of violence
Women
Table 1 Socio-demographic and psycho-social characteristics of the respondents and their partners
Total (N = 917) Men (n = 440) Women (n = 477) p-value*
RESPONDENT CHARACTERISTICS N % n % n %
Age groups(n = 908) .050
20-24 275 30.3 148 33.8 127 27.0
25-29 300 33.0 144 32.9 156 33.2
30-35 333 36.7 146 33.3 187 39.8
Marital status(n = 912) .000
Married or cohabiting 578 63.4 236 53.8 342 72.3
Divorced or widowed 35 3.8 2 0.5 33 7.0
Single 299 32.8 201 45.8 98 20.7
Number of children(n = 915) .000
No children 307 33.6 211 48.1 96 20.2
1-3 children 467 51.0 192 43.7 275 57.8
> 3 children 141 15.4 36 8.2 105 22.1
Level of education(n = 768) .006
Secondary school or university 117 15.2 50 13.3 67 17.0
Complete primary or vocational training 178 23.2 105 28.0 73 18.6
Incomplete primary school 473 61.6 220 58.7 253 64.4
Occupation(n = 910) .068
Civil servants 15 1.6 6 1.4 9 1.9
Skilled workers or students 84 9.2 49 11.2 35 7.4
Unskilled workers 512 56.3 230 52.5 282 59.7
No formal occupation (subsist. farmer) 299 32.9 153 34.9 146 30.9
Personal income per month(n = 912) .005
More than 35,000 Rwf 30 3.3 19 4.3 11 2.3
17,500-35,000 Rwf 55 6.0 36 8.2 19 4.0
Less than 17,500 Rwf 827 90.7 382 87.4 445 93.7
Source of income(n = 903) .000
Salary 47 5.2 38 8.7 9 1.9
Pension, disability grant or other 88 9.7 54 12.3 34 7.3
No income 768 85.0 347 79.0 421 90.7
Social support(n = 917) .081
Improved 140 15.3 77 17.5 63 13.2
Poor 777 84.7 363 82.5 414 86.8
PARTNER CHARACTERISTICS .000
Partner’s age(n = 577)
20-24 97 16.8 67 28.2 30 8.8
25-29 170 29.5 87 36.6 83 24.5
30 and above 310 53.7 84 35.3 226 66.7
Partner’s educational level(n = 475) .412
Secondary school or university 55 11.6 21 10.0 34 12.8
Complete primary or vocational training 141 29.7 59 28.1 82 30.9
Incomplete primary school 279 58.7 130 61.9 149 56.2
Partner’s occupation(n = 616) .000
Table 1 Socio-demographic and psycho-social characteristics of the respondents and their partners(Continued)
Skilled worker or student 41 6.7 6 2.4 35 9.5
Unskilled worker 342 55.5 120 48.6 222 60.2
No formal occupation (Subsist. farmer) 207 33.6 115 46.6 92 24.9
HOUSEHOLD CHARACTERISTICS
Household monthly income(n = 883) .566
17,500 or more 189 21.4 86 20.5 103 22.2
< 17,500 Rwf 694 78.6 333 79.5 361 77.8
* Chi square test for independence or Fisher’s exact probability test for difference between men and women.
Table 2 Living standards and assets in the household
Variables Total (N = 917) Men (n = 440) Women (n = 477) P-value*
Living standards N % n % n %
Type of house(n = 915)
Combination of buildings, flat, maisonette, modern house 361 39.5 188 42.8 173 36.3 .050
Shack, traditional dwelling 554 60.5 251 57.2 303 63.7
Water source(n = 912)
Piped water, public tap, well/borehole, 544 59.6 338 77.0 206 43.6 .000
Surface water, tanker truck 368 40.4 101 23.0 267 56.4
Electricity(n = 914)
Yes 107 11.7 39 8.9 68 14.3 0.13
No 807 88.3 400 91.1 407 85.7
Cooking fuel(n = 914) .906
Kerosene, paraffin and other fuels 78 8.5 37 8.4 41 8.6
Firewood and dung 836 91.5 403 91.6 433 91.4
Toilet facility(n = 910)
Flushed, improved latrine, other 24 2.6 14 3.2 10 2.1 .031
Latrine, no toilet 886 97.4 422 96.8 464 97.9
Summary measure living standards(n = 917)
Improved living standard (at least 1 item in the reference category of the living standard items)
671 73.2 366 83.2 305 63.9 .000
Low level of living standard (0 item in the reference category of the living standard items)
246 26.8 74 16.8 172 36.1
Assets in the household (HH)
Radio (n = 916) 586 64.0 300 68.2 286 60.1 .011
Television set (n = 916) 55 6.0 25 5.7 30 6.3 .781
Refrigerator (n = 915) 8 0.9 2 0.5 6 1.3 .290
Bicycle (n = 915) 145 15.8 87 19.8 58 12.2 .002
Motorcycle (n = 915) 17 1.9 4 0.9 13 2.7 .050
Car (n = 915) 12 1.3 3 0.7 9 1.9 .147
Mobile phone (n = 915) 282 30.8 122 27.8 160 33.6 .062
Computer (n = 914) 13 1.4 3 0.7 10 2.1 .094
Summary variable for assets in the HH (n = 917)
Improved (at least one of 8 assets) 654 71.3 323 73.4 331 69.4 .189
Poor (none of the 8 assets ) 263 28.7 117 26.6 146 30.6
When analysing the overlapping of the different forms of violence targeting women, the most commonly occur-ring form was the combination of all three forms of violence for earlier in life (30.4%) and for past year exposure (29.1%) (Figure 1).
Men
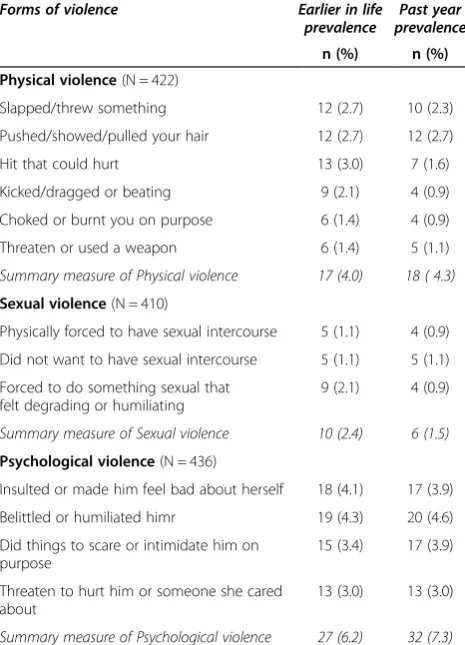
Male respondents reported intimate partner violence expos-ure to a considerably lesser extent than women (Table 4). The frequency of the abuse was also less, i.e. one time was the most commonly reported frequency. However, results showed that only 4.0% (n = 17) were victims of physical vio-lence earlier in life and 4.3% (n = 18) in past year (Table 4). Psychological abuse was the most commonly reported form of violence, indicating a past year estimate, which was greater than the earlier in life estimate (7.3% and 6.2%, respectively).
Associations with socio-demographic and psycho-social factors
Women
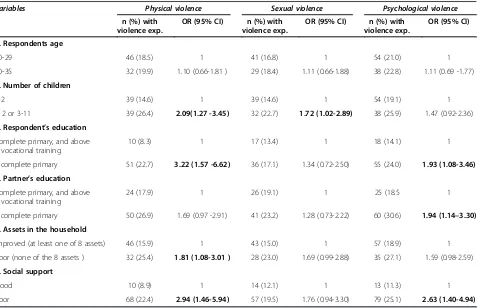
In the crude logistic regression analyses, we found that having more than two children (OR 2.09; 1.27-3.45), resting with an incomplete primary education (OR 3.22;
1.57-6.62), without household assets (OR 1.81; 1.08-3.01) and with poor social support (2.94; 1.46-5.94) were sta-tistically significant risk factors for women’s exposure to physical violence. For sexual violence against women, having more than two children (OR 1.72; 1.02-2.89) was a statistically significant risk factor. Psychological vio-lence against women was associated with low educa-tional attainment, related to the respondent (OR 1.93; 1.08-3.46) as well as to the partner (OR 1.94; 1.14-3.30) and poor social support (OR 2.63; 1.40-4.94) (Table 5).
For physical violence, the multivariate logistic regres-sion analysis was performed in four separate models and the risk factor pattern did not change as having more than two children (OR 2.05; 1.14-3.69), resting with an incomplete primary education (2.79; 1.33-5.84) and having low social support (2.40; 1.06-5.41) remained statistically significant in the final model. For psychological violence, only poor social support (2.61; 1.25-5.48) remained a statis-tically significant risk factor.
Men
As few men were exposed to physical or sexual violence from their partners, no statistically significant risk factor for physical and sexual violence were identified, therefore, Table 3 Prevalence and frequencies of earlier in life and past year physical, sexual and psychological violence
experienced by women (N = 477)
Earlier in life Past year
Violence exp. n (%)
Number of events Violence exp. n (%)
Number of events
1 2 to 3 >3 1 2 to 3 >3
Physical violence(N = 416)
Slapped/threw something 84 (17.6) 21 (4.4) 23 (4.8) 40 (8.4) 69 (14.5) 25 (5.2) 16 (3.4) 28 (5.9)
Pushed/showed/pulled your hair 48 (10.1) 9 (1.9) 12 (2.5) 27 (5.7) 41 (8.6) 12 (2.5) 12 (2.5) 17 (3.6)
Hit that could hurt 52 (10.9) 10 (2.1) 13 (2.7) 29 (6.1) 47 (9.9) 13 (2.7) 14 (3.0) 20 (4.2)
Kicked/dragged or beating 48 (10.1) 8 (1.7) 17 (3.6) 23 (4.8) 40 (8.4) 10 (2.1) 13 (2.7) 17 (3.6)
Choked or burnt you on purpose 25 (5.2) 5 (1.0) 8 (1.7) 12 (2.5) 20 (4.2) 6 (1.3) 8 (1.7) 6 (1.3)
Threaten or used a weapon 20 (4.2) 3 (0.6) 8 (1.7) 9 (1.9) 17 (3.6) 5 (1.1) 6 (1.3) 6 (1.3)
Summary measure of Physical violence 92 (21.7) 26 (5.5) 24 (5.0) 42 (8.8) 78 (18.8) 30 (6.3) 18 (3.8) 30 (6.3)
Sexual violence(N = 409)
Physically forced to have sexual intercourse 47 (9.9) 11 (2.3) 11 (2.3) 25 (5.3) 47 (9.9) 11 (2.3) 14(2.9) 22(4.6)
Did not want to have sexual intercourse 55 (11.6) 7 (1.5) 15 (3.2) 33 (6.9) 57 (12.0) 12(2.5) 21(4.4) 24(5.0)
Forced to do something sexual that felt degrading or humiliating
19 (4.0) 6 (1.3) 5 (1.0) 8 (1.7) 21 (4.4) 5(1.1) 10(1.1) 6(1.3)
Summary measure of Sexual violence 72 (17.8) 15 (3.2) 15 (3.1) 42 (8.8) 71 (17.4) 15(3.1) 23(4.8) 33(6.9)
Psychological abuse(N = 430)
Insulted or made her feel bad about herself 69 (14.5) 9 (1.9) 16 (3.4) 44 (9.2) 62 (13.0) 11(2.3) 19(4.0) 32(6.7)
Belittled or humiliated her 60 (12.6) 10 (2.1) 17 (3.6) 33 (6.9) 55 (11.5) 11(2.3) 14(2.9) 30(6.3)
Did things to scare or intimidate her on purpose 75 (15.8) 11 (2.3) 13 (2.7) 51 (10.7) 73 (15.3) 15(3.1) 21(4.4) 37(7.8)
Threaten to hurt her or someone she cared about 27 (5.7) 6 (1.3) 6 (1.3) 15 (3.1) 24 (5.0) 5(1.1) 6(1.3) 13(2.7)
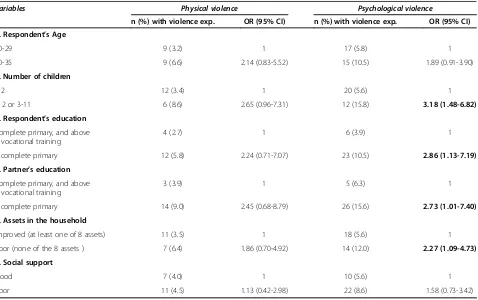
no further analysis was performed for men in relation with exposure to physical and sexual violence. For psycho-logical violence, however we found that low education, poor in household assets, with many children and a lower educated partner constituted risk factors for exposure to psychological violence in the bivariate analyses (Table 6), but none of them remained statistically significant risk fac-tor in the multivariate analysis.
Discussion
In this study from rural and urban parts of Southern Province of Rwanda, we found that both men and women were exposed to intimate partner violence al-though men to a considerably lesser extent than women. IPV exposure, in the form of repeated acts of physical, sexual and psychological violence, was commonly faced by women, while men reported only single events of vio-lence. Women with low educational attainment and liv-ing in poor life circumstances were most exposed to each of the forms of violence.
Intimate partner violence against women
Rwanda is currently seen as a country with a relatively high level of gender equality at legal and policy level, and a gender-based violence (GBV) intolerance reflected in the law on GBV mentioned above [16]. Even so, vio-lence against women in intimate partnerships remains a public health issue sustained by cultural norms, reflected as a gender power imbalance in relationships [26]. The general belief is that IPV is a purely domestic issue [27,28] that is not of societal concern, and therefore sel-dom disclosed outside the household. Equally, when IPV is disclosed, other factors such as women’s economic de-pendence on their husbands support IPV against women. Table 4 Prevalence and frequency of earlier in life and
past year violence in men (N = 440)
Forms of violence Earlier in life prevalence
Past year prevalence
n (%) n (%) Physical violence(N = 422)
Slapped/threw something 12 (2.7) 10 (2.3)
Pushed/showed/pulled your hair 12 (2.7) 12 (2.7)
Hit that could hurt 13 (3.0) 7 (1.6)
Kicked/dragged or beating 9 (2.1) 4 (0.9)
Choked or burnt you on purpose 6 (1.4) 4 (0.9)
Threaten or used a weapon 6 (1.4) 5 (1.1)
Summary measure of Physical violence 17 (4.0) 18 ( 4.3)
Sexual violence(N = 410)
Physically forced to have sexual intercourse 5 (1.1) 4 (0.9)
Did not want to have sexual intercourse 5 (1.1) 5 (1.1)
Forced to do something sexual that felt degrading or humiliating
9 (2.1) 4 (0.9)
Summary measure of Sexual violence 10 (2.4) 6 (1.5)
Psychological violence(N = 436)
Insulted or made him feel bad about herself 18 (4.1) 17 (3.9)
Belittled or humiliated himr 19 (4.3) 20 (4.6)
Did things to scare or intimidate him on purpose
15 (3.4) 17 (3.9)
Threaten to hurt him or someone she cared about
13 (3.0) 13 (3.0)
Summary measure of Psychological violence 27 (6.2) 32 (7.3)
Furthermore, when there is a known case of IPV, the Rwandan culture first suggests application of a commu-nity dialogue (named“Gacaca”); i.e. family or local leaders approach the couple, with reconciliation as the goal and divorce as the final alternative.
The 2010 Rwanda Demographic and Health Survey (DHS) results on domestic violence against women aged 15–49 years shows that the proportion of women who ex-clusively experienced lifetime physical violence is about 26% [29], which could possibly be compared with earlier in life estimates from the present study (21.7%). Findings from a Ugandan study for women’s exposure to past year physical violence (20%) is close to our finding (18.8%) [11].
As for past year occurrence of sexual violence, the prevalence in our study (17.4%) was quite similar to the Tanzanian study prevalence (18.3%) [30], but somewhat higher than what has been observed among Rwandan ado-lescents attending school (15.5%) [31] and considerably lower than the Ethiopian study prevalence (44.4%) [30].
Recent findings from two studies in high income coun-tries on men’s and women’s exposure show that the occur-rence of physical and psychological violence are of the same magnitude for men and women, while considerably more women are exposed to sexual abuse [3,32]. Other
studies find all forms of IPV exposure to be more com-mon acom-mong women than men [11,33].
Although findings in the present study show that women are more exposed to IPV than men, it is important to high-light that there is a possibility of underreporting of violence exposure among women, due to the fear of revenge from the partner [34]. Other possible reasons for women’s underreporting of partner violence exposure include the humiliation, the shame of being victim of IPV and the wish to stay in the relationship [35].
Intimate partner violence against men
In our study, men were to a considerably lesser extent exposed than women to any of the forms of violence in-vestigated. Psychological IPV was the most common form of IPV targeting men, as is the case in the study by Fawole et al. from Nigeria [36]. From the neighbouring Uganda, considerably more men report lifetime exposure to physical violence from their female partner [7] than what is commonly seen in such studies.
An interesting reflection is whether our observed discrep-ancy in reporting of IPV incidents between men and women is due to men’s denial of incidents or to a gender power im-balance, i.e. attributed to the general subordination of Table 5 Associations between socio-demographic and psycho-social factors and women’s exposure to IPV, past year exposure
Variables Physical violence Sexual violence Psychological violence
n (%) with violence exp.
OR (95% CI) n (%) with violence exp.
OR (95% CI) n (%) with violence exp.
OR (95% CI)
1. Respondents age
20-29 46 (18.5) 1 41 (16.8) 1 54 (21.0) 1
30-35 32 (19.9) 1.10 (0.66-1.81 ) 29 (18.4) 1.11 (0.66-1.88) 38 (22.8) 1.11 (0.69 -1.77)
2. Number of children
0-2 39 (14.6) 1 39 (14.6) 1 54 (19.1) 1
> 2 or 3-11 39 (26.4) 2.09(1.27 -3.45) 32 (22.7) 1.72 (1.02-2.89) 38 (25.9) 1.47 (0.92-2.36)
3. Respondent’s education
Complete primary, and above & vocational training
10 (8.3) 1 17 (13.4) 1 18 (14.1) 1
Incomplete primary 51 (22.7) 3.22 (1.57 -6.62) 36 (17.1) 1.34 (0.72-2.50) 55 (24.0) 1.93 (1.08-3.46)
4. Partner’s education
Complete primary, and above & vocational training
24 (17.9) 1 26 (19.1) 1 25 (18.5 1
Incomplete primary 50 (26.9) 1.69 (0.97 -2.91) 41 (23.2) 1.28 (0.73-2.22) 60 (30.6) 1.94 (1.14–3.30)
5. Assets in the household
Improved (at least one of 8 assets) 46 (15.9) 1 43 (15.0) 1 57 (18.9) 1
Poor (none of the 8 assets ) 32 (25.4) 1.81 (1.08-3.01 ) 28 (23.0) 1.69 (0.99-2.88) 35 (27.1) 1.59 (0.98-2.59)
6. Social support
Good 10 (8.9) 1 14 (12.1) 1 13 (11.3) 1
Poor 68 (22.4) 2.94 (1.46-5.94) 57 (19.5) 1.76 (0.94-3.30) 79 (25.1) 2.63 (1.40-4.94)
women to men in the society. It is well known that power is a central aspect of gender relations and women have less access to most kinds of power, and most stereotypic male–female differences result from this imbalance [37]. Denial of incidents could be at hand due to men’s hesitation to report any violence or abuse exposure from the wife/partner, as this would be in sharp contrast to accepted gender norms [38]. An-other explanation for possible denial could be men’s general neglect of violence inflicted by a woman, in-stead it is belittled and considered ridiculous and insig-nificant by exposed men and therefore not reported [39]. A final explanation could be women’s physical disadvantage, making any act of violence less threaten-ing for a physically stronger male person and hereby subject to denial of incidents over time [40,41]. On the other hand, the discrepancy in reporting may well re-flect a situation where men are to a considerably lesser extent exposed to IPV. Support for this assumption is given in several studies from Sub-Saharan African countries including Rwanda, that report on large pro-portions of men and women with supportive attitudes towards wife beating [13]. This reflects traditional gen-der norms based on a substantial gengen-der power imbal-ance [42].
Factors associated with IPV
Our results illustrate that poor life circumstances with no assets in the household and many children in the family were associated with physical violence. This can be linked to financial stress, reflecting difficulties in handling everyday life. Such a stressful condition may re-sult in miscommunication within couples and abuse to-wards women by men who are seen as key wage earners [43,44]. Moreover, educational attainment, which is usu-ally considered as a door to opportunities was generusu-ally poor in our study population and highly associated with physical and psychological violence. Studies from various countries including 17 countries in Africa, Sri-Lanka, Haiti and Nepal show that low educational status consti-tute a risk factor for IPV directed at women [45,46]. For women, good social support is protective against phys-ical violence [47] by its potential to empower women [48]. Social support especially from family members makes women feel more secure with some protection.
Methodological considerations
In this study, the past year violence estimates were used in the analyses as they are frequently assumed to be more precise measures of IPV than earlier in life esti-mates due to lower recall bias [24]. However, as people Table 6 Associations between socio-demographic and psycho-social factors and men’s exposure to IPV, past year exposure
Variables Physical violence Psychological violence
n (%) with violence exp. OR (95% CI) n (%) with violence exp. OR (95% CI) 1. Respondent’s Age
20-29 9 (3.2) 1 17 (5.8) 1
30-35 9 (6.6) 2.14 (0.83-5.52) 15 (10.5) 1.89 (0.91-3.90)
2. Number of children
0-2 12 (3.4) 1 20 (5.6) 1
> 2 or 3-11 6 (8.6) 2.65 (0.96-7.31) 12 (15.8) 3.18 (1.48-6.82)
3. Respondent’s education
Complete primary, and above & vocational training
4 (2.7) 1 6 (3.9) 1
Incomplete primary 12 (5.8) 2.24 (0.71-7.07) 23 (10.5) 2.86 (1.13-7.19)
4. Partner’s education
Complete primary, and above & vocational training
3 (3.9) 1 5 (6.3) 1
Incomplete primary 14 (9.0) 2.45 (0.68-8.79) 26 (15.6) 2.73 (1.01-7.40)
5. Assets in the household
Improved (at least one of 8 assets) 11 (3.5) 1 18 (5.6) 1
Poor (none of the 8 assets ) 7 (6.4) 1.86 (0.70-4.92) 14 (12.0) 2.27 (1.09-4.73)
6. Social support
Good 7 (4.0) 1 10 (5.6) 1
Poor 11 (4.5) 1.13 (0.42-2.98) 22 (8.6) 1.58 (0.73-3.42)
believe culturally that family matters and particularly violence exposure should not be disclosed to others, there is the possibility of general underreporting. Never-theless, the data collection procedure in this study was performed with great care, by experienced and trained clinical psychologists who were able to establish a good discussion climate in Kinyarwanda with the individual participants. Furthermore, the data collectors were of the same sex and of similar age to the participants, which has been shown to improve the accuracy of the reporting in interviews [49]. The data is hereby considered to be of high internal and external validity with possibly some underreporting but with high precision and objectivity in the interview situation. As this was a cross-sectional study, only statistically significant associations with all forms of violence are given, and no causal relationship can be established. In addition, the comparison of our findings to other studies needs to be done with care given the narrow age span (20–35 years) of the current study sample.
Conclusion
In Rwanda, intimate partner violence is most commonly exercised towards women while men’s exposure to IPV seems to be considerably lower. This might be due to re-call bias and denial of incidents in men but is certainly also explained by gender power imbalance, reinforced by cultural norms and society’s tolerance to traditional gen-der norms.
Income generating activities as well as access to finan-cial credits, combined with educational awareness on gen-der equality and human rights issues would contribute to women’s empowerment. Promotion of gender equality at individual level is needed to make a positive difference in a relatively short term. The media needs to be involved to produce public debates on intimate partner violence, con-demning such abuses and revealing their important public health consequences for the woman and her family. The health sector with the help of the Rwandan police carries the responsibility to identify those exposed to partner vio-lence and be able to offer an adequate treatment and support.
In this setting, qualitative studies are needed to im-prove the knowledge and understanding of men’s and women’s exposure to IPV to shed light on motives, seriousness and level of threat that such violence in-duces in the victim. This would in turn give guiding principles for sex-specific preventive and intervention strategies.
Additional file
Additional file 1:STROBE Statement—Checklist of items that should be included for cross-sectional studies.
Abbreviations
IPV:Intimate partner violence; WHO: World health organization; GBV: Gender based violence; RwMHBC project: The rwanda violence, mental health and barriers to care project; SPH: School of public health; RNEC: Rwanda national ethic committee; NISR: National institute of statistics of rwanda;
DHS: Demographic and health survey.
Competing interest
The authors declare that they have no competing interests.
Authors’contributions
GK designed the study. The study questionnaire was developed by GK, JN and IM, and AU complemented it. GK and IM further assisted AU in the statistical analyses and contributed to the manuscript. AU developed the study methodology, coordinated the data collection activities, performed all the statistical analyses and drafted the manuscript. JN assisted in the planning and in the writing. All authors read and approved the final manuscript.
Acknowledgements
This study forms part of the Rwanda Violence, Mental Health and Barriers to Care project (RwVMHBC), a collaborative project between the School of Public Health, College of Medicine and Health Sciences, University of Rwanda and the Department of Public Health and Community Medicine, University of Gothenburg, Sweden, supported by a grant from The Swedish International Development Cooperation Agency, SIDA.
We would like to acknowledge men and women who participated in the study and shared their life experiences with us. We gratefully thank interviewers, field supervisors and others for their participation in the study. The collaboration between the Department of Public Health and Community Medicine at University of Gothenburg and the School of Public Health at University of Rwanda made this study possible.
Author details
1Department of Epidemiology and Biostatistics, School of Public Health,
College of Medicine and Health Sciences, University of Rwanda, P.O Box 5229, Kigali, Rwanda.2Department of Clinical Sciences, Obstetrics and
Gynecology, Umea University, Förvaltningshuset, Universitetstorget 16, 901 87 Umea, Sweden.3Department of Public Health and Community Medicine,
Sahlgrenska Academy at Gothenburg University, Gothenburg, Sweden.
Received: 6 April 2014 Accepted: 15 August 2014 Published: 26 August 2014
References
1. Campbell JC, Abrahams N, Martin L:Perpetration of violence against intimate partners: health care implications from global data.Can Med Assoc J2008,179(6):511–512.
2. Cunradi CB:Intimate partner violence among hispanic men and women: the role of drinking, neighborhood disorder, and acculturation-related factors.Violence Vict2009,24(1):83–97.
3. Lovestad S, Krantz G:Men’s and women’s exposure and perpetration of partner violence: an epidemiological study from Sweden.BMC Public Health2012,12:945.
4. Nybergh L, Taft C, Krantz G:Psychometric properties of the WHO Violence Against Women instrument in a male population-based sample in Sweden.BMJ Open2012,2(6):e002055.
5. Karamagi CA, Tumwine JK, Tylleskar T, Heggenhougen K:Intimate partner violence against women in eastern Uganda: implications for HIV prevention.BMC Public Health2006,6:284.
6. Deribe K, Beyene BK, Tolla A, Memiah P, Biadgilign S, Amberbir A: Magnitude and correlates of intimate partner violence against women and its outcome in Southwest Ethiopia.PLoS One2012,7(4):e36189. 7. Uganda Demographic and Health survey.http://www.measuredhs.com/
pubs/pdf/FR264/FR264.pdf.
8. Speizer IS:Intimate partner violence attitudes and experience among women and men in Uganda.J Interpers Violence2010,25(7):1224–1241. 9. Saile R, Neuner F, Ertl V, Catani C:Prevalence and predictors of partner
10. Kayibanda JF, Bitera R, Alary M:Violence toward women, men’s sexual risk factors, and HIV infection among women: findings from a national household survey in Rwanda.J Acquir Immune Defic Syndr (1999)2012, 59(3):300–307.
11. Koenig MA, Lutalo T, Zhao F, Nalugoda F, Wabwire-Mangen F, Kiwanuka N, Wagman J, Serwadda D, Wawer M, Gray R:Domestic violence in rural Uganda: evidence from a community-based study.Bull World Health Organ2003,81(1):53–60.
12. Were E, Curran K, Delany-Moretlwe S, Nakku-Joloba E, Mugo NR, Kiarie J, Bukusi EA, Celum C, Baeten JM:A prospective study of frequency and correlates of intimate partner violence among African heterosexual HIV serodiscordant couples.AIDS (London, England)2011,25(16)):2009–2018.
13. Rani M, Bonu S, Diop-Sidibe N:An empirical investigation of attitudes towards wife-beating among men and women in seven sub-Saharan African countries.Afr J Reprod Health2004,8(3):116–136.
14. Connell RW:Masculinities. 2nd edition. Berkeley CA: University of California Press; 2005.
15. Masculinity and Gender Based Violence in Rwanda.http://www. engagingmen.net/files/resources/2011/frutayisire/FINAL_REPORT_0.pdf. 16. Official Gazette of the Republic of Rwanda number 14 of 06 April 2009
page 81.http://www.primature.gov.rw/publications/official-gazettes.html. 17. Ntaganira J, Muula AS, Masaisa F, Dusabeyezu F, Siziya S, Rudatsikira E:
Intimate partner violence among pregnant women in Rwanda.BMC Womens Health2008,8:17.
18. Ntaganira J, Muula AS, Siziya S, Stoskopf C, Rudatsikira E:Factors associated with intimate partner violence among pregnant rural women in Rwanda. Rural Remote Health2009,9(3):1153.
19. Verduin F, Engelhard EA, Rutayisire T, Stronks K, Scholte WF:Intimate partner violence in Rwanda: the mental health of victims and perpetrators.J Interpers Violence2012,28(9):1839–1858.
20. Rwanda DHS 2005 Final report.http://dhsprogram.com/publications/ publication-FR183-DHS-Final-Reports.cfm.
21. WHO Multi-country study on women’s Health and Life Experiences. http://www.svri.org/Questionnaire.pdf.
22. Saddki N, Sulaiman Z, Ali SH, Tengku Hassan TN, Abdullah S, Ab Rahman A, Tengku Ismail TA, Abdul Jalil R, Baharudin Z:Validity and reliability of the Malay version of WHO Women’s Health and Life Experiences Questionnaire.J Interpers Violence2013,28(12):2557–2580.
23. Nybergh L, Taft C, Krantz G:Psychometric properties of the WHO Violence Against Women instrument in a female population-based sample in Sweden: a cross-sectional survey.BMJ Open2013,3(5):e002053. 24. Gil-Gonzalez D, Vives-Cases C, Ruiz MT, Carrasco-Portino M, Alvarez-Dardet C:
Childhood experiences of violence in perpetrators as a risk factor of intimate partner violence: a systematic review.J Public Health (Oxf)2008,30(1):14–22. 25. Ellsberg M, Heise L, Pena R, Agurto S, Winkvist A:Researching domestic
violence against women: methodological and ethical considerations. Stud Fam Plann2001,32(1):1–16.
26. Ariane van der Straten RK, Olga G, Eric V, Antoine S, Susan A:Sexual coercion, physical violence, and HIV infection among women in steady relationships in Kigal, Rwanda.AIDS Behav1998,2(1):61–73.
27. Kiragu J:HIV prevention and women’s rights: working for one means working for both.Aidscaptions1995,2(3):40–46.
28. Rivera Izabal LM:Women’s legal knowledge: a case study of Mexican urban dwellers.Gend Dev1995,3(2):43–48.
29. Rwanda DHS 2010 (English) [FR259].pdf.http://www.measuredhs.com/ pubs/pdf/FR259/FR259.pdf.
30. Garcia-Moreno C, Jansen HA, Ellsberg M, Heise L, Watts CH:Prevalence of intimate partner violence: findings from the WHO multi-country study on women’s health and domestic violence.Lancet2006,368(9543):1260–1269. 31. Van Decraen E, Michielsen K, Herbots S, Van Rossem R, Temmerman M:
Sexual coercion among in-school adolescents in Rwanda: prevalence and correlates of victimization and normative acceptance.Afr J Reprod Health2012,16(3):140–154.
32. Nybergh LTC, Enander V, Krantz G:Self-reported exposure to intimate partner violence among women and men in Sweden: results from a population-based survey.BMC Public Health2013,13:845.
33. Hegarty K, Hindmarsh ED, Gilles MT:Domestic violence in Australia: definition, prevalence and nature of presentation in clinical practice.Med J Aust2000,173(7):363–367.
34. Fugate M, Landis L, Riordan K, Naureckas S, Engel B:Barriers to domestic violence help seeking: implications for intervention.Violence Against Women2005,11(3):290–310.
35. Rubertsson C, Hildingsson I, Radestad I:Disclosure and police reporting of intimate partner violence postpartum: a pilot study.Midwifery2010, 26(1):e1–e5.
36. Fawole OL, Salawu TA, Olarinmoye EO:Intimate partner violence: prevalence and perceptions of married men in Ibadan, Nigeria.Int Q Community Health Educ2009,30(4):349–364.
37. HM L: InWomen, men and Power, Volume Viii. Edited by View M. CA, US: Mayfield Publishing Co; 1991:245.
38. Ehrensaft MK, Cohen P, Brown J, Smailes E, Chen H, Johnson JG:Intergenerational transmission of partner violence: a 20-year prospective study.J Consult Clin Psychol2003,71(4):741–753.
39. Johnson MP:Conflict and control: gender symmetry and asymmetry in domestic violence.Violence Against Women2006,12(11):1003–1018. 40. Allen CT, Swan SC, Raghavan C:Gender symmetry, sexism, and intimate
partner violence.J Interpers Violence2009,24(11):1816–1834. 41. Dobash RP, Dobash RE:Womens violence to men in intimate
relationships: working on a puzzle.Br J Criminol2004,44(3):324–349. 42. Alio AP, Clayton HB, Garba M, Mbah AK, Daley E, Salihu HM:Spousal
concordance in attitudes toward violence and reported physical abuse in African couples.J Interpers Violence2011,26(14):2790–2810. 43. Ali TS, Asad N, Mogren I, Krantz G:Intimate partner violence in urban
Pakistan: prevalence, frequency, and risk factors.Int J Womens Health 2011,3:105–115.
44. Stockdale SE, Wells KB, Tang L, Belin TR, Zhang L, Sherbourne CD:The importance of social context: neighborhood stressors, stress-buffering mechanisms, and alcohol, drug, and mental health disorders.Soc Sci Med 2007,65(9):1867–1881.
45. Uthman OA, Lawoko S, Moradi T:Factors associated with attitudes towards intimate partner violence against women: a comparative analysis of 17 sub-Saharan countries.BMC Int Health Hum Rights2009, 9:14.
46. Gage AJ:Women’s experience of intimate partner violence in Haiti.Soc Sci Med2005,61(2):343–364.
47. Escriba-Aguir V, Ruiz-Perez I, Montero-Pinar MI, Vives-Cases C, Plazaola-Castano J, Martin-Baena D:Partner violence and psychological well-being: buffer or indirect effect of social support.Psychosom Med2010,72(4):383–389. 48. Jewkes R:Intimate partner violence: causes and prevention.Lancet2002,
359(9315):1423–1429.
49. Guest G, Bunce A, Johnson L, Akumatey B, Adeokun L:Fear, hope and social desirability bias among women at high risk for HIV in West Africa. J Fam Plann Reprod Health Care2005,31(4):285–287.
doi:10.1186/1472-6874-14-99
Cite this article as:Umubyeyiet al.:Women are considerably more
exposed to intimate partner violence than men in Rwanda: results from a population-based, cross-sectional study.BMC Women's Health
201414:99.
Submit your next manuscript to BioMed Central and take full advantage of:
• Convenient online submission
• Thorough peer review
• No space constraints or color figure charges
• Immediate publication on acceptance
• Inclusion in PubMed, CAS, Scopus and Google Scholar
• Research which is freely available for redistribution