Optimization of Proton Exchange
Membrane Fuel Cell at Different
operating and design Variables Using
Genetic Algorithm
Narender Kumara*
Department of EngineeringPhysics Rajiv Gandhi Technological University Bhopal (M.P) India-462021 Purnima Swarup Kharea
Department of EngineeringPhysics Rajiv Gandhi Technological University Bhopal (M.P) India-462021 Abhay Swarupb
Team Leader Asian Development Bank TA RETA 6441 Unit 905-906 The Orient Square Emeraid Avenue, Ortigas Center 1605 Pasig City Philippines.
Abstract:
In Proton Exchange Membrane fuel cell the operating condition and design variable plays very important role for improving the performance. This work focused on numerical simulation of the effects operating conditions and design variables, especially temperature, pressure, sticheometry of the reactant gases, area of the cell and membrane thickness. To investigate the effect of the operating conditions and design variables on the fuel cell performance, in this study we have set temperature;313K<Tcell<353K,pressure; 1.013bar<Pcell<10.013bar, area of cell; 0.016m2<A
cell<0.05m2 and thickness of membrane; 100nm<t<50µm.The present fuel cell model shows an improvement in the output voltage. The optimum point at which fuel cell shows maximum output voltage has been found by Genetic Algorithm through MATLAB (version 7.7) software. Result showed that output voltage at which proton exchange fuel cell shows maximum performance could be obtained 1.15V at temperature 338.4K, pressure 5.07atm, area of cell 0.045 m2, thickness of the membrane 7.3 µm and current 0.74amp.
Key words: Design Variables, Operating Variables, Output Voltage, Proton Exchange Membrane (PEM) Fuel
Cell
1. Introduction: PEM Fuel Cell is a promising technology that converts hydrogen fuel into energy. PEM Fuel
aspect of this study is that we have varied the operating and design parameters simultaneously and then find the optimum point at which the design model shows maximum performance. The Genetic Algorithm further evaluates the optimum operating parameters for the particular fuel cell’s highest output voltage. The commercial software MATLAB (version 7.7) is used in order to simulate the electrochemical reactions and physical phenomena occurred inside the fuel cell. The important aspect of the present model is that it considers physical –chemical as well as wider range of operating parameters for the optimization of the fuel cell System
2. Mathematical Modeling:
The present empirical model selects the reference data from the experimental studies and applied to the thermo dynamical equations for optimization. Some basic assumptions have been considered for the convert the data in terms of the model parameters. The output of the same experimental reference data has been compared with over model results for validation.
2.1 Assumption:
(i). The total air pressure is assumed to be uniform, while the variation with the space of the partial pressures of its components is taken into account.
(ii). The water vapor contained in the reactant of the baking macrospores is in equilibrium with the surrounding liquid. Therefore the partial water pressure is uniform throughout the PEMFC. However the partial water pressure changes with the change in the operating conditions of PEMFC.
(iii) The reactant gas used at cathode is atmospheric air, which contains oxygen, nitrogen and other gases. 2.2 Fuel Cell Model:
The electrochemical reaction which takes place in proton exchange fuel cell is:
H2 2O2 H2O
1
(1)
The voltage of fuel cell (Vcell ) is given by the author R.F Mann et al [12] as;
V
cell
E
Nernest
act
ohmic
conc(2)
2.3.1 Activation over Voltage:
Activation over voltage losses are the losses associated with the initial dramatic voltage losses in low temperature fuel cell. These losses are basically representative of a loss of overall voltage at the expanse of forcing the reaction to completion, which is forcing the hydrogen split into electrons and protons. The split protons travel through the membrane and then combine with oxygen and returning electrons. The semi- empirical equation for the activation [12];
int
4 ( )3 2
1 T T InC 2 TcellIn I
erface O cell cell
act
(3)
Where expression for erface O Cint
2 [17];
6 ( 498/ )
int int
10 08 . 5
2
2 Tcell
erface O erface
O
e p
C
(4)
The previously published values of β coefficients are given in table 1
Table1. Empirical Coefficient for PEMFC Stack Model
Ref. β1 β2 β3 β4
[14] -0.9514 0.00312 0.000074 -0.000187
Pressure of the reactant O2 at the interface pOinterface
2 is calculated from the expression [14, 15];
] 1
[ 0.832
2 2
291 . 0
int Tcell
i channel othergases sat
O H cell erface
O P x x e
(5)
The molar fraction of water saturation in a gas stream for given temperature is given by;
cell sat O H sat O H P p
x 2 2
(6)
The psatH O
2 term is determined in the fuel cell by the folloing empirical equation [16]; ) ( 9 0069 . 0 6981 . 7362 434643 . 70 ) 2
( Tcell InTcell
cell T sat O H p
In (7)
The molar fraction of other gases (nitrogen) in air stream is given by a log mean average between the molar fraction of other gases in a humidified stream of air at the inlet and the molar fraction at the outlet is [14, 17]
} ( , , , , hum out othergases hum in othergases hum out othergases hum in othergases chhanel othergases x x In x x
x
(8) Where 79 . 0 ) 1 ( 2
, sat
O H huml in othergases x x
(9) ) 79 . 0 / 21 . 0 )( / 1 ( 1 1 2 , air air sat O H huml out othergases x x
(10)
2.3.2 Concentration Over Voltage:
As a reactant is consumed at the electrode by the electrochemical reaction, it is often diluted by the products. When finite mass transport rates limit the supply of fresh reactant and the evacuation of products. As a consequence, a concentration gradient is formed which derives the mass transport. In PEM fuel cells, the evacuation of product is often more limiting than the supply of the fuel and gives the difference between the diffusivities of hydrogen and water. While at low current densities and high bulk reactant concentration mass-transport losses are not significant. Under practical conditions, (high current densities, low fuel and air concentrations), they often contribute significantly to loss of potential.
The semi empirical equation to calculate the concentration over voltage is given by [18]; ) 1 ( 2 L cell onc I I In F RT (11)
2.3.3 Ohmic Over Voltage:
The ohmic loss inside the PEM fuel cell occurs due to the resistance to the electron flow in the bipolar plates and the resistance to the proton in the membrane. The Ohmic Over Voltage can be calculated by using the semi- empirical equation [12]
protonic ohmic eletronic
ic o
ohmic
i(ReletronicRprotonic)
Where Reletronic is assumed to be constant over the operation temperature of the PEMFC. Because the electronic resistance is inconsequential in comparison to protonic resistance and thus ignored. The term protonic
R is a
complex quantity and whose value depends upon the distribution of water content in the membrane, which is the function of the cell temperature and current. Rprotonic can be calculated by using the expression [17];
active M protonic A t r R (12)
r
M is the membrane- specific resistivity for the flow of hydrated proton (Ωcm).And can be calculated byusing the expression [19];
cell cell T T membrane cell M e i i T i
r 3.25( 303)/
5 . 2 2 ] 3 634 . 0 [ ] ) 303 / ( 062 . 0 ) ( 03 . 0 1 [ 6 . 181 (13) λmembrane is the adjusting fitting parameter influenced is a function
of relative humidity and stoichiometric ratios at the anode and cathode and the age of the membrane use. In the present study λmembrane is taken 12.
2.3.4 Nernst Voltage:
Fuel cell efficiency cannot be analyzed the same as a thermodynamic system using the Carnot efficiency. Unlike many electrical powers generating system it is not obvious what form of energy converted into electricity in a fuel cell. To analyze the chemical energy changes throughout the chemical process involved in the operation of a fuel cell, one must be aware to understand “Gibbs free energy or the Nernst voltage”. This is the energy to do the external work.
The Nernst equation for the reaction is given as [13]:
) ( 5 . 0 )) ( ( 10 3085 . 4 ) 15 . 298 ( 10 85 . 0 229 .
1 3 5 int int
2 2 erface O erface H cell cell
Nernst T T In p In p
E
(14) The partial pressure of the reactant gas hydrogen at the catalyst surface of the anode is assumed to be same across the entire cell and is given as [10, 11]:
] 1 1 [ 2 334 . 11
2 1.653
int
Chhanel O H T i erface i H x e p cell (15)
And the partial pressure of the reactant gas oxygen at the cathode catalyst surface can be calculated from “Eq.5”.
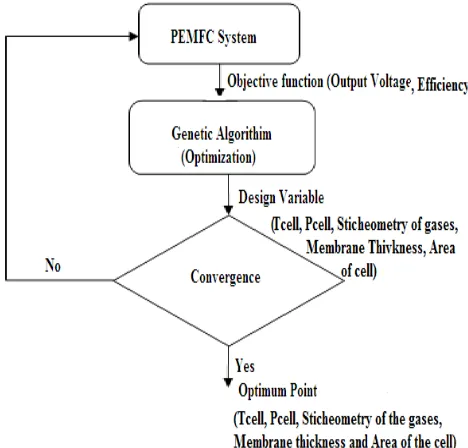
3. System Optimization:
The PEMFC has been optimized by combining the optimization algorithm (Genetic algorithm) with the output voltage. The PEMFC and optimization algorithm (fig 1) have been combined by design variable and the objective function. In present study to optimize the PEMFC system, we have selected the initial values of the design variables and the objective function. The output voltage of the PEMFC has been computed at different physico –chemical conditions. The optimization problem solved as a multi- objective optimization problem
;
. .
,
w
iV
iX, I
N
1
Where Vi(X,I) is the net output voltage obtained from the fuel cell model at a current I, wi are the weighing variables and X is the vector of the design variable. The design variables includes here are operating temperature, operating pressure, sticheometry of the reactant gases, thickness of the membrane and the area of the cell. The upper limit and lower limit of the design variable are Xmax=[353, 10.013, 10, 50X10-6, .016] and Xmax=[313, 1.013, 1, 10X10-8, .05] .The output voltage of the fuel cell obtained by using computational model described above.
The optimum point at which the PEMFC shows maximum voltage has been found by using Genetic Algorithm. With this information, theoptimization algorithm chooses a new set of design variables and limits them for maximum output voltage of the PEMFC
.
Fig.1 Optimization Technique
Table 2 Operating Parameters Values
Symbol Meaning Value
Pcell Fuel Cell operating pressure (bar) 10.013- 1.013
Tcell Fuel cell operating temperature(K) 313- 353
I Current (amp) 0.1 -1
ncell Nos of cell 1
λair Sticheometry of the gases 1-10
Acell Area of cell (m2) .016m2 - 0.05m2
t Thickness of the membrane (m) 10X10-8- 5X10⁻⁵
4. Model Validation:
Fig2. Comparison of current voltage with reference [16] at 353Ktemperature and 1.90atm pressure
Fig.3 Comparison of current voltage with reference [16] at 1.90atm pressure and 353Ktemperature
The comparison results (fig.2 and fig.3) shows good agreement with the experimental results ofYuyao Shan and Song et al. The present study shows the improvement in output voltage .of the PEM fuel cell, because of change in the physico- chemical conditions such as operating temperature, pressure, sticheometry of the reactant gases as, thickness of the membrane as well as the area of the fuel cell system.
5. Result and Discussion:
Here we havespecifically studied the system level dynamics and considered the effect of the physico -chemical on the output voltage of the PEM fuel cell.
Fig.4, present the current voltage polarization curve for PEM fuel cell system as we increase the temperature from 313K to 353K. The output voltage of the fuel cell increases as we increase the cell temperature because of the exchange current density increases with the increase in cell temperature, which reduces the activation over voltage. The increase in operating temperature provides extra energy to the oxygen molecule to activate easily and causes electrochemical reaction. But as the load current increases the activation over voltage increases because of the decrease in partial pressure of oxygen at the cathode. Therefore there is less number of atoms of oxygen which take electrochemical energy from the reaction and cause electrochemical reaction. Hence the output voltage decreases with increase in load current. In the present study the output voltage increase from 0.8V to 1.13V as we increase the temperature from 313K to 353K.
0.1 0.2 0.3 0.4 0.5 0.6 0.7 0.8 0.9 1.0 0.75
0.80 0.85 0.90 0.95 1.00 1.05 1.10 1.15
O
u
tp
u
t Vo
lt
a
g
e
(V)
Current Density (Acm-2)
At,T=353K,P=1.90atm Ref.[16] Curve
0.1 0.2 0.3 0.4 0.5 0.6 0.7 0.8 0.9 1.0 0.78
0.80 0.82 0.84 0.86 0.88 0.90 0.92 0.94 0.96 0.98 1.00 1.02 1.04 1.06 1.08 1.10 1.12 1.14
At,P=1.90atm,T=353K Ref.[16] Curve
Out
p
ut
V
o
lt
age (
V
)
The polarization curve of PEM fuel cell at different pressure is presented in Fig.5. The performance of the PEM fuel cell improves as we increase the pressure from 1atm to the 10atm. The pressure of the reactant gases at anode as well as cathode is kept same.
Fig.4: Current Voltage Curve at Different Temperature
The increase in the output voltage of the fuel cell is due to the increase in partial pressure of the reactant gases which increase the e rate of the reaction. The reason of increase in the output voltage of the fuel cell with pressure, is the decrease in concentration overvoltage. Because because more protons (H+ ions) are forced to move towards cathode for the completion of reaction. How --ever the output voltage decreases as we increase the load current, because of increase in the partial pressure of water produced ( pH2O ) at anode which reduces the rate of electro chemical reaction. Hence protons (H+ ions) face more resistance from H
2O molecule to move towards cathode in this study the output voltage increase from 0.7V to 1.12V as we increase the temperature from 1atm to 10atm.
Fig.5 Current Voltage Curve at Different Pressure
Fig.6 presents the polarization curve of PEM fuel cell at different area of the cell. Because of the increase in cell area causes the increase in rate of the reaction. Therefore more and molecules of the reactant gases diffuses at the anode and cathode which proceed the electrochemical reaction very fast. Hence the output voltage of the fuel cell system increases. But as the load current increases the output voltage decreases because of increase in mass transfer. As the load current increases large molecules of water molecules produced.
0.1 0.2 0.3 0.4 0.5 0.6 0.7 0.8 0.9 1 0
0.2 0.4 0.6 0.8 1 1.2 1.4
Load Current(Amp.)
C
el
l V
ol
tage(
V
ol
ts
)
At,T=353K At,T=346.2K At,T=337.9K At,T=329.6K At,T=321.3K At,T=313K
0.1 0.2 0.3 0.4 0.5 0.6 0.7 0.8 0.9 1 0
0.2 0.4 0.6 0.8 1 1.2 1.4
Load Current(Amp.)
C
e
ll V
o
lt
a
g
e
(V
o
lt
s
)
Fig.6 Current Voltage Curve at Different Area of the cell
These water molecules resist the motion of the H+ ions and hence the reaction rate decreases. Hence the output voltage decreases. The output voltage of the fuel cell system increases from 0.7V to 1.13V as we increase the cell area from 0.016m2 to 0.050m2
.
Fig.7 presented the polarization curve of the PEM fuel cell at different thickness of the membrane. The output voltage increases with the increases in the thickness of the membrane from 100nm to 50µm. This is because of the decrease in the ohmic overvoltage. Another reason of increasing the output voltage with membrane thickness is decrease concentration overvoltage because of less swelling in the thicker membrane.
Fig.7. Current Voltage Curve at Different thickness of the membrane
Fig.8 presents the polarization curves of PEM at different operating and design conditions. In this case we have simultaneously set the different operating conditions as well as the design variables.
The optimum point at which PEM fuel cell shows the maximum output voltage has been obtained by using Genetic Algorithm through the simulation of different phenomena occurred inside fuel cell with MATLAB (version 7.7). The output voltage at which fuel cell shows maximum performance is 1.15V at temperature 338.4K, pressure 5.07atm, area of cell 0.045 m2 and thickness of the membrane 7.3 µm
0.1 0.2 0.3 0.4 0.5 0.6 0.7 0.8 0.9 1 0
0.2 0.4 0.6 0.8 1 1.2 1.4
Load Current(Amp.)
C
el
l V
ol
tage(
V
ol
ts
)
At, Acell=0.050m2 At, Acell=0.043m2 At, Acell=0.037m2 At, Acell=0.030m2 At, Acell=0.023m2 At, Acell=0.016m2
0.1 0.2 0.3 0.4 0.5 0.6 0.7 0.8 0.9 1 0
0.2 0.4 0.6 0.8 1 1.2 1.4
Load Current(Amp.)
C
el
l V
ol
tage
(V
o
lt
s
)
Fig.8: Current Voltage Curve at Different Temperature, Pressure, Area of the cell and membrane thickness
7. Conclusion:
The output voltage of the fuel cell was calculated from semi- empirical correlations based on kinetic data, which are very sensitive to physical – chemical variations. In this paper, a methodology to obtain the optimum operating condition for a fuel cell system is presented for the wide range of physical – chemical condition. In this paper performance of the PEM Fuel cell at different operating as well as design variables have been covered in detail.
0.1 0.2 0.3 0.4 0.5 0.6 0.7 0.8 0.9 1
0 0.2 0.4 0.6 0.8 1 1.2 1.4
Load Current(Amp.)
Cell V
olt
age(
V
ol
ts
)
At different Temperature
0.1 0.2 0.3 0.4 0.5 0.6 0.7 0.8 0.9 1
0 0.2 0.4 0.6 0.8 1 1.2 1.4
Load Current(Amp.)
Cell V
olt
age(
V
ol
ts
)
At different Pressure
0.1 0.2 0.3 0.4 0.5 0.6 0.7 0.8 0.9 1
0 0.2 0.4 0.6 0.8 1 1.2 1.4
Load Current(Amp.)
C
e
ll
V
o
lt
age(
V
o
lt
s
)
At different Thickness of Membrane
0.1 0.2 0.3 0.4 0.5 0.6 0.7 0.8 0.9 1
0 0.2 0.4 0.6 0.8 1 1.2 1.4
Load Current(Amp.)
C
e
ll
V
o
lt
age(
V
o
lt
s
)
Fig.9. MATLAB GUI
The new operating and design conditions improve the net output voltage with respect to the common operating conditions of the fuel cell system. During the study, Genetic optimization algorithms are used to find out the optimum point. This allows us to conclude that this optimization problem has an objective function that is both convex and unimodal. Furthermore, the benefit of using this method type is to demonstrate by the large variance in operating conditions revealed by the solutions.
Nomenclature:
Aactive Active cell area (cm2)
At Total stack cross -sectional area (cm2). CB Bulk concentration of reactant Species (Kgmolm-3) CS Surface concentration of reactant species (Kgmolm-3) D Diffusion Constant of the reactant species
Ei=0 Nernst energy when no current is flow through the fuel cell (V) for a given temperature E Nernst energy when current is flow through the fuel cell (V) for a given temperature in air stream. F Faraday Constant (96485C e-1)
i Fuel Cell Current density (amp cm-2)
I Fuel Cell Current (amp)
iL Limiting Current density; current at which hydrogen consumption equal to hydrogen ncell Number of cells in the stack.
n Number of electrons released during reaction (n=2) erface
H pint
2 Pressure of the hydrogen gas at the surface of catalyst at anode (bar). erface
O pint
2 Pressure of the oxygen gas at the surface of catalyst at cathode (bar) p0 Standard pressure
Pcell Fuel Cell operating pressure (bar)
rM Membrane – specific resistivity for the flow of hydrated proton(Ω cm) Relectronic Ohmic electronic overvoltage
R Universal gas constant (8.3145Jmol-1K-1) Rprotonic Ohmic protonic overvoltage resistance (Ω cm-2) t Thickness of the membrane (cm)
Tcell Fuel cell operating temperature (K) sat
O H2
channel othergases
x
Molar fraction of gases (apart from oxygen) in the air stream hum, in othergases
x
Molar fraction of gases (apart from oxygen) at the inlet. humout othergases
x
, Molar fraction of gases (apart from oxygen) at the outlet. Vcell Output voltage of single fuel cell (volts)Greek Symbols:
ηact Activation overvoltage (V)
ηconc Concentration overvoltage (V)
ηohmic Ohmic Overvoltage (V)
λmembrane Empirical parameter that describe membrane conditions.
References:
[1] T. A. Zang and L. L Green,” Multidisciplinary design and optimization techniques: Implications and opportunities for fluid dynamics research”. In 30th AIAA Fluid Dynamics Conference, Norfolk, VA, June 28 - July 1 1999.
[2] J.R.R.A. Martins, “A Coupled-Adjoint Method for High-Fidelity Aero-structural Optimization” Ph.D thesis, Standford University, November 2002.
[3] A. Gomes and A. Suleman,” Optimization of aircraft aeroelastic response using level set methods” In 46th AIAA/ASME/ASCE/AHS/ASC Structures, Structural Dynamics and Materials Conference, Austin, TX, April 2005.
[4] M. Secanell and A. Suleman,“Numerical evaluation of optimization algorithms for low-reynolds-number aerodynamics shape optimization”. J. AIAA ,43(10), 2262-2267, 2005.
[5] G.N. Vanderplaats,” Numerical Optimization Techniques for Engineering Design with Applications” McGraw-Hill, 1984. [6] K. Haraldsson and K. Wipke. Evaluating PEM fuel cell system models. Journal of Power Sources, 126:88-97, 2004. [7] D. Hissel, Ch. Turpin “ Review on exiting modeling methodologies for PEM fuel cell system”, 2008.
[8] Yuyao Shan, Song – Yul Choe,” A high dynamic PEM fuel cell model with different temperature” J. Power Sources 145 (2005) 30-39.
[9] E. Afshari and S.A Jazayeri,” Analysis of Heat Transport in a Proton Exchange Membrane (PEM) Fuel Cell” American Journal of Applied Sciences 6(1): 101-108, 2009.
[10] P. Argyropoulos, K. Scott, W.M Taama “The effect of operating conditions on the dynamic response of the direct methanol fuel cell” J. Electrochemica Acta 45 (2000) 1983-1998.
[11] Maher A.R Sadiq Al- Baghdadi, Haroun A. K Shahad Al-Janabi, Optimization study of Proton Exchange Membrane Fuel Cell Performance, Turkish J. Eng. Env. Sci. 29(2005), 235-240.
[12] R.F Mann. J.C Amphlett , M.A.I Hooper , H.M Jensen , B.A Peppley , P. R Roberg,” Development and Application of a generalized steady state electrochemical model for a PEM fuel cell”, J. Power Sources 86(1/2)(2000) 173-180.
[13] J.Wishart, Z.Dong , M. Secanell, “Optimization of PEM fuel cell system based on empirical data and generalized electrochemical semi- empirical model”, J. power Sources 161(2006) 1041-1055.
[14] J.C Amphlett, R.M Baumert , R.F Mann, B.A Peppley, P. R Roberge, T.j Harris, “Performance Modeling of of the Ballarad – Mark-IV Solid Polymer Electrolyte Fuel cell . Mechanistic and development”, J Electrochemical Society 142(1) (1995) 1-8.
[15] D.Xue, Z. Dong, “Optimal fuel cell system design considering functional performance and production cost”, J. Power Sources 76(1/2)(1998) 69-80.
[16] F.N Buchi, G.G Scherer, “In –situ resistance measurements of Nafion (R) 117 membranes in polymer electrolyte fuel cells”, J. Electroanal Chem. 404(1)(1996) 37-43.
[17] Z. Dong M. Guenther, G. Iuzzolino, “Mathematical modeling of PEM fuel cell and its implementation in MATLAB”, Research Report, University of Victoria, 2003.
[18] T. Springer, S. Zawodzinkshi, S. Gottesfeld, “Polymer electrolyte fuel cells”, J. Electro Chem. Society 138(8) (1991) 2334-2342. [19] M. W Fowler, R.F Mann, J.C Amphlett, B.A Pepply, P.R Roberg, “Incorporation of Voltage degradation into a generalized steady