Using Information on Auxiliary Attribute
Rajesh Singh
Department of Statistics, Banaras Hindu University Varanasi (U.P.), India
Email: [email protected]
Pankaj Chauhan
School of Statistics, DAVV, Indore (M.P.), India
Nirmala Sawan
School of Statistics, DAVV, Indore (M.P.), India
Florentin Smarandache
Department of Mathematics, University of New Mexico, Gallup, USA Email: [email protected]
Abstract
Some ratio estimators for estimating the population mean of the variable under study, which make use of information regarding the population proportion possessing certain attribute, are proposed. Under simple random sampling without replacement (SRSWOR) scheme, the expressions of bias and mean-squared error (MSE) up to the first order of approximation are derived. The results obtained have been illustrated numerically by taking some empirical population considered in the literature.
Key words: Proportion, bias, MSE, ratio estimator.
1. Introduction
The use of auxiliary information can increase the precision of an estimator when study variable y is highly correlated with auxiliary variable x. There exist situations when information is available in the form of attributeφ, which is highly correlated with y. For example
a) Sex and height of the persons,
b) Amount of milk produced and a particular breed of the cow,
c) Amount of yield of wheat crop and a particular variety of wheat etc. (see Jhajj et. al. [1]).
Consider a sample of size n drawn by SRSWOR from a population of size N. Let
i
y and φi denote the observations on variable y and φ respectively for ith unit(i=1,2,....N). Suppose there is a complete dichotomy in the population with respect to the presence or absence of an attribute, say φ, and it is assumed that attribute φ takes only the two values 0 and 1 according as
i
φ = 1, if ith unit of the population possesses attribute φ
Let
∑
=
φ = N
1 i
i
A and
∑
=
φ = n
1 i
i
a denote the total number of units in the population and
sample respectively possessing attributeφ. Let
N A
P= and
n a
p= denote the
proportion of units in the population and sample respectively possessing attributeφ.
Taking into consideration the point biserial correlation between a variable and an attribute, Naik and Gupta [2] defined ratio estimator of population mean when the prior information of population proportion of units, possessing the same attribute is available, as follows:
⎟⎟ ⎠ ⎞ ⎜⎜ ⎝ ⎛ =
p P y
tNG (1.1)
Here y is the sample mean of variable of interest. The MSE of tNG up to the first order of approximation is –
[
+ φ− φ]
⎟ ⎠ ⎞ ⎜ ⎝ ⎛ −
= 2 2 1 y
1 2 y
NG S R S 2RS
n f 1 ) t (
MSE (1.2)
Where
N n
f = ,
P Y
R1= ,
∑
(
)
=
− −
= N
1 i
2 i 2
y y Y
1 N
1
S ,
∑
(
)
=
φ = − φ −
N
1 i
2 i 2
P 1
N 1
S ,
(
)
(
)
∑
=
φ = − φ − −
N
1 i
i i
y P y Y
1 N
1
S .
In the present paper, some ratio estimators for estimating the population mean of the variable under study, which make use of information regarding the population proportion possessing certain attribute, are proposed. The expressions of bias and MSE have been obtained. The numerical illustrations have also been done by taking some empirical populations considered in the literature.
2. The suggested estimator
Following Ray and Singh [3], we propose the following estimator –
P R P p
) p P ( b y
t1 = *
− +
= φ
(2.1)
Where y2
s s b
φ φ
φ = ,
p ) p P ( b y
R* = + φ − ,
∑
(
)
=
φ ⎟ φ −
⎠ ⎞ ⎜ ⎝ ⎛
−
= n
1 i
2 i 2
p 1
n 1
s and
(
)
(
)
∑
=
φ ⎟ φ − −
⎠ ⎞ ⎜ ⎝ ⎛
−
= n
1 i
i i
y p y Y
1 n
1
s .
MSE of this estimator can be found by using Taylor series expansion given by – ) Y y ( c ) d , c ( f ) P p ( c ) d , c ( f ) y , P ( f ) y , p ( f Y , P Y ,
P ∂ −
∂ + − ∂ ∂ + ≅ (2.2)
Where f(p,y)=R*andf(P,Y)=R1.
Expression (2.2) can be applied to the proposed estimator in order to obtain MSE equation as follows:
(
)
(
)
(
)
(
(
)
)
(
)
Y y y p / ) p P ( b y P p p p / ) p P ( b y R R Y , P Y , P 1 * − ∂ − + ∂ + − ∂ − + ∂ ≅ − φ φ ) Y y ( p 1 ) P p ( p P b p y Y , P Y , P 22 ⎟⎟ − + −
⎠ ⎞ ⎜⎜ ⎝ ⎛ + − ≅ φ
(
)
) y ( V P 1 ) y , p ( Cov P ) P B Y ( 2 ) p ( V P P B Y ) R R (E 4 3 2
2 2 1 *− ≅ + φ − + φ + ⎭ ⎬ ⎫ ⎩ ⎨ ⎧ + + − + ≅ φ φ ) y ( V ) y , p ( Cov P ) P B Y ( 2 ) p ( V P ) P B Y ( P 1 2 2
2 (2.3)
Where φ φ φ φ ρ = = S S S S
B 2y pb y .
φ φ = ρ S S S y y
pb , is the point biserial correlation coefficient.
Now,
2 1 2
1) P E(R R )
t (
MSE = − φ
(
)
( )
(
)
Cov( )
p,y V( )
yP P B Y 2 p V P P B Y 2 2 + + − + ≅ φ φ (2.4)
Simplifying (2.4), we get MSE of t1 as
( )
[
(
2)
]
pb 2 y 2 2 1
1 R S S 1
n f 1 t
MSE ⎟ + −ρ
⎠ ⎞ ⎜ ⎝ ⎛ −
≅ φ (2.5)
In next section, we propose some ratio estimators for estimating the population mean of the variable under study using known parameters of the attribute φsuch as coefficient of variation Cp, Kurtosis
(
β2(φ))
and point biserial correlation coefficientρpb.3. Suggested Estimators
We suggest following estimator –
) m P m ( ) m p m (
) p P ( b y
t 1 2
2 1
+ +
− +
= φ
(3.1)
Wherem1(≠0), m2 are either real number or the functions of the known
parameters of the attribute such as Cp,
(
β2(φ))
andρpb.The following scheme presents some of the important estimators of the population mean, which can be obtained by suitable choice of constants m1 and
m2:
Estimator Values of
m1 m2
P p
) p P ( b y
t1 = + φ − 1 1
(
)
[
P ( )]
) ( p
) p P ( b y
t 2
2
2 +β φ
φ β +
− +
= φ 1 β2(φ)
(
)
[
p]
p
3 P C
C p
) p P ( b y
t +
+ − +
= φ 1 Cp
(
)
[
pb]
pb
4 P
) p
) p P ( b y
t +ρ
ρ +
− +
= φ 1 ρpb
(
)
[
2 p]
p 2
5 P ( ) C
C ) ( p
) p P ( b y
t β φ +
+ φ β
− +
= φ β2(φ) Cp
(
)
[
PC ( )]
) ( pC
) p P ( b y
t p 2
2 p
6 +β φ +β φ
− +
= φ Cp β2(φ)
(
)
[
p pb]
pb p
7 PC
pC
) p P ( b y
t +ρ
ρ +
− +
= φ Cp ρpb
(
)
[
pb p]
p pb
8 P C
C p
) p P ( b y
t ρ +
+ ρ
− +
= φ ρpb Cp
(
)
[
2 pb]
pb 2
9 P ( )
) ( p
) p P ( b y
t β φ +ρ
ρ + φ β
− +
= φ β2(φ) ρpb
(
)
[
P ( )]
) ( p
) p P ( b y
t pb 2
2 pb
10 ρ +β φ ρ +β φ
− +
Following the approach of section 2, we obtain the MSE expression for these proposed estimators as –
[
RS S (1 )]
n f 1 ) t (
MSE 2pb
2 y 2 i
i ⎟ + −ρ
⎠ ⎞ ⎜ ⎝ ⎛ −
≅ φ , (i=1,2,3,....,10) (3.2)
Where
P Y R1 = ,
) ( P
Y R
2 2
φ β +
= ,
p 3
C P
Y R
+
= ,
pb 4
P Y R
ρ +
= ,
p 2
2 5
C ) ( P
) ( Y R
+ φ β
φ β
= ,
) ( PC
C Y R
2 p
p 6 = +β φ ,
pb p
p 7
PC C Y R
ρ +
= ,
p pb
pb 8
C P
Y R
+ ρ
ρ
= ,
pb 2
2 9
) ( P
) ( Y R
ρ + φ β
φ β
= ,
) ( P
Y R
2 pb
pb
10 ρ +β φ
ρ
= .
4. Efficiency comparisons
It is well known that under simple random sampling without replacement (SRSWOR) the variance of the sample mean is
2 y
S n
f 1 ) y (
V ⎟
⎠ ⎞ ⎜ ⎝ ⎛ −
= (4.1)
From (4.1) and (3.2), we have
0 ) t ( MSE )
y (
V − i ≥ , i=1,2,...,10
2 i 2 y 2 2
pb R
S Sφ
> ρ
⇒ (4.2)
When this condition is satisfied, proposed estimators are more efficient than the sample mean.
Now, we compare the MSE of the proposed estimators with the MSE of Naik and Gupta (1996) estimatortNG. From (3.2) and (1.1) we have
0 ) t ( MSE )
t (
MSE NG − i ≥ , (i=1,2,...,10)
[
yp]
2 2 i 2 y 2 2
pb R R 2R K
S S
φ φ
φ − +
≥ ρ
⇒ (4.3)
where
p y yp yp
C C
5. Empirical Study
The data for the empirical study is taken from natural population data set considered by Sukhatme and Sukhatme (1970):
y = Number of villages in the circles and
φ = A circle consisting more than five villages
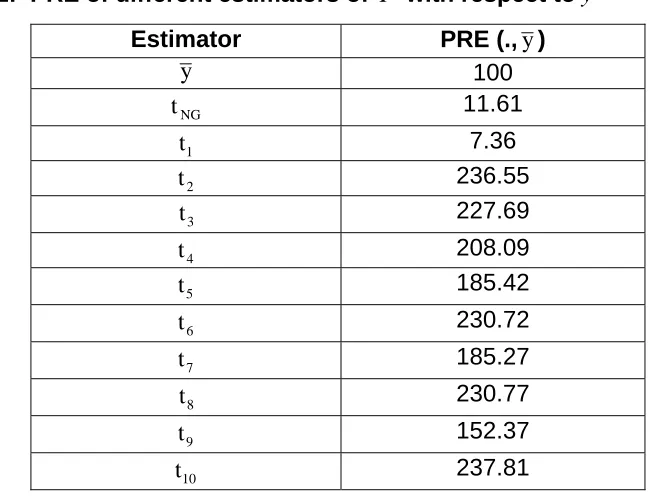
N = 89, Y= 3.36, P = 0.1236, ρpb= 0.766, Cy = 0.604, Cp = 2.19, β2(φ)= 6.23181. In table 5.1 percent relative efficiencies (PRE) of various estimators are computed with respect toy.
Table 5.1: PRE of different estimators of Y with respect toy
Estimator PRE (.,y)
y 100
NG
t 11.61
1
t 7.36
2
t 236.55
3
t 227.69
4
t 208.09
5
t 185.42
6
t 230.72
7
t 185.27
8
t 230.77
9
t 152.37
10
t 237.81
From table 5.1, we observe that the proposed estimators ti(i=2,...,10) which uses some known values of population proportion performs better than the usual sample mean y and Naik and Gupta (1996) estimatortNG.
Conclusion
We have suggested some ratio estimators for estimating Y which uses some known value of population proportion. For practical purposes the choice of the estimator depends upon the availability of the population parameters.
References
2. Naik, 6 V.D. and Gupta, P.C. (1996): A note on estimation of mean with known population proportion of an auxiliary character. Jour. Ind. Soc. Agr. Stat., 48 (2), 151-158.
3. Ray, S. K. and Singh, R. K. (1981): Difference-cum-ratio type estimators. J. Ind. Statist. Assoc., 19, 147-151.
4. Searls, D.T. (1964): The utilization of known coefficient of variation in the estimation procedure. Journal of American Statistical Association, 59, 1125-1126.
5. Searls, D.T. and Intarapanich, P. (1990): A note on an estimator for the variance that utilizes the kurtosis. The American Statistician, 44, 4, 295-296.
6. Sen, A.R. (1978): Estimation of the population mean when the coefficient of variation is known. Commun. Statist., Theory – Meth. A (7), 657-672.
7. Singh, G.N. (2003): On the improvement of product method of estimation in sample surveys. Jour. Ind. Soc. Agri. Statistics, 56(3), 267-275.
8. Singh H.P. And Tailor, R. (2003): Use of known correlation coefficient in estimating the finite population mean. Statistics in Transition, 6, 4, 555-560.
9. Singh H.P., Tailor, R., Tailor, R. and Kakran, M.S. (2004): An improved estimator of population mean using power transformation. Jour. Ind. Soc. Agr. Stat., 58 (2), 223-230.
10. Singh, J. Pandey, B.N. and Hirano, K. (1973): On the utilization of a known coefficient of kurtosis in the estimation procedure of variance. Ann. Inst. Stat. Math., 25, 51-55.
11. Sisodia, B.V.S. And Dwivedi, V.K. (1981): A modified ratio estimator using coefficient of variation of auxiliary variable. Jour.Ind.Soc.Agril. Statist., 33, 2, 13-18.
12. Sukhatme, P.V. and Sukhatme, B.V. (1970): Sampling theory of surveys with applications. Iowa State University Press, Ames, U.S.A.
13. Upadhyaya, L.N. and Singh, H.P. (1984): On the estimation of the
population mean with known coefficient of variation. Biom. Jour., 26 (8), 915-922.