R E S E A R C H A R T I C L E
Open Access
Geochemically induced shifts in catabolic energy
yields explain past ecological changes of diffuse
vents in the East Pacific Rise 9°50
’
N area
Michael Hentscher
*and Wolfgang Bach
Abstract
The East Pacific Rise (EPR) at 9°50’N hosts a hydrothermal vent field (Bio9) where the change in fluid chemistry is believed to have caused the demise of a tubeworm colony. We test this hypothesis and expand on it by providing a thermodynamic perspective in calculating free energies for a range of catabolic reactions from published
compositional data. The energy calculations show that there was excess H2S in the fluids and that oxygen was the limiting reactant from 1991 to 1997. Energy levels are generally high, although they declined in that time span. In 1997, sulfide availability decreased substantially and H2S was the limiting reactant. Energy availability dropped by a factor of 10 to 20 from what it had been between 1991 and 1995. The perishing of the tubeworm colonies began in 1995 and coincided with the timing of energy decrease for sulfide oxidizers. In the same time interval, energy availability for iron oxidizers increased by a factor of 6 to 8, and, in 1997, there was 25 times more energy per transferred electron in iron oxidation than in sulfide oxidation. This change coincides with a massive spread of red staining (putative colonization by Fe-oxidizing bacteria) between 1995 and 1997.
For a different cluster of vents from the EPR 9°50’N area (Tube Worm Pillar), thermodynamic modeling is used to examine changes in subseafloor catabolic metabolism between 1992 and 2000. These reactions are deduced from deviations in diffuse fluid compositions from conservative behavior of redox-sensitive species. We show that hydrogen is significantly reduced relative to values expected from conservative mixing. While H2 concentrations of the hydrothermal endmember fluids were constant between 1992 and 1995, the affinities for hydrogenotrophic reactions in the diffuse fluids decreased by a factor of 15 and then remained constant between 1995 and 2000. Previously, these fluids have been shown to support subseafloor methanogenesis. Our calculation results
corroborate these findings and indicate that the 1992-1995 period was one of active growth of hydrogenotrophic communities, while the system was more or less at steady state between 1995 and 2000.
Introduction
Microorganisms have the ability to gain energy for their metabolism by promoting a large range of redox reactions. Well-known energy sources are for example aerobic oxidation of methane or hydrogen sulfide, methanogen-esis, fermentation, and sulfate reduction under anaerobic conditions [1]. In habitats like hydrothermal systems or mines, lacking sunlight and organic carbon sources, the primary production depends on electron donors that are released by water-rock reactions. High-temperature (> 400°C) processes of water-rock interaction determine
the composition of seawater-derived hydrothermal fluids that are equilibrated with rocks at depths as much as sev-eral kilometers (Figure 1). Upon upwelling, these fluids cool (conductively and/or adiabatically) and mix with cold seawater to varying extents. High temperature fluids, vent-ing focused via black smoker chimneys, often show little evidence for subseafloor mixing and are typically used as
“hydrothermal endmember” compositions. Commonly, sites of diffuse venting are developed around the black smokers, and the temperature-composition relations of the fluids issuing through the seafloor there indicate that the diffuse fluids formed by subseafloor cooling and mix-ing of hot hydrothermal fluids with cold seawater. The seafloor underneath these diffuse vent sites is a particularly favorable environment for a variety of chemosynthetic
* Correspondence: [email protected]
Department of Geosciences, University of Bremen, Klagenfurter Straße, 28359 Bremen, Germany
microorganisms in terms of suitable temperature and large energy availability (Figure 1). The composition of the upwelling hydrothermal fluids in these diffuse vent sites imposes a major control on the metabolic diversity in the colonizing ecosystem. Because of this tight relation between vent ecosystem and fluid compositions, chemical changes in the fluid may directly influence the ecosystem.
Thermodynamic calculations based on geochemical compositions of waters in these habitats provide insights into the energy availability and can determine possible reactions that can support primary production in these systems [2-5]. Tight relations between the availability of geochemical energy and microbial processes have been demonstrated for a variety of submarine hydrothermal environments, including chimney walls, diffuse fluids, and vent mussels [6-10].
In this study we use geochemical data from two hydro-thermally active vents in the East Pacific Rise 9°50’N area to show that thermodynamic modeling can help interpret
the microbial metabolism in such systems. For the first area, our calculations provide clues to the biological evo-lution of a vent site influenced by dynamic changes in fluid chemistry and, consequently, catabolic energy. The other case shows that microbial processes in the subsea-floor may be deciphered by determining and comparing free energies of reactions for catabolic reactions of hypothetical fluids derived from conservative mixing of seawater and hydrothermal fluid with the diffuse fluid actually sampled.
Methods
Calculation of affinity
Free energy for catabolic reactions is available only if the system is out of geochemical equilibrium. Disequilibrium prevails when the properties of the system change at rates faster than the rates at which the thermodynamically favored reactions proceed. The abiotic rates of many redox reactions are sluggish, in particular at temperatures
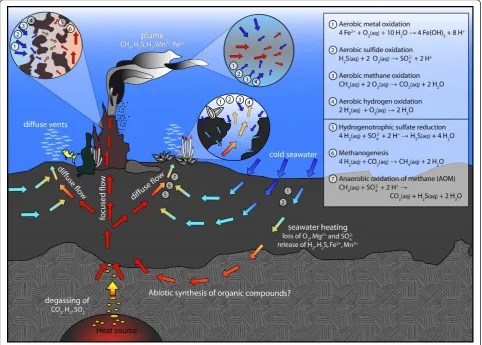
Figure 1Sketch of idealized fluid flow within a hydrothermal system and potential catabolic reactions in different environments
(chimney wall, plume, recharge zone, and subseafloor mixing zone). Upwelling hot, reducing hydrothermal fluids mix with entrained cold,
conducive of life (< 120°C)[5]. Microbes use enzymes to catalyze these redox reactions and harness the free energy by controlling electron transfers and converting a sizable fraction of the catabolic energy in ATP production for their anabolic metabolism [11]. The maximum quantity of free energy that microorganisms can catabolize (ΔrG) is
given by the Gibbs energy at a reference state (ΔrG° =
-RTlnKr) representing the intensive parameters (P, T) and
an extensive term (RTlnQ) that captures the compositions of the vent solutions (equation 1):
rG =−RTln(Kr) + RTln(Qr)
where R is the universal gas constant and T the tem-perature in Kelvin. Kr is the calculated equilibrium for
the temperature and pressure of interest, and Qr
expresses the activities of species participating a specific reaction. Qris evaluated through equation (2):
Qr=
i
aivir
where airepresents the activity of the chemical species
in the reaction, virdenotes the stoichiometric coefficient
for the ith chemical species in the reaction, which is positive for products and negative for reactants. If ΔrG
for a reaction is negative, then the reaction should pro-ceed from left to right; if it is greater than zero, the reaction will proceed in the opposite direction. By con-vention a negative sign indicates that the reaction should take place spontaneously and energy can be gained by microbes catalyzing this reaction.
Commonly, affinity is used instead ofΔrG for a
reac-tion [12]. Affinities express the change of the Gibbs energy with reaction progress (ξ) (equation 3):
Ar= −(∂rG/∂ξ)P,T
It follows that the reaction is favorable if the affinity is positive. Combining equations 1 and 3, the affinity can be evaluated through equation (4):
Ar= RT ln(Kr/Qr)
This relation demonstrates that, if Kr> Qr, then Ar >
0 and the reaction may proceed while free energy is released [12].
Two types of computations were employed in this study: (1) calculation of concentrations and activities of dissolved species in diffuse fluids, and (2) calculation of affinities of potential catabolic reactions in these fluids. These calcula-tions were conducted for actual diffuse fluids sampled and analyzed by Von Damm and Lilley [13] and for hypotheti-cal mixtures of endmember vent fluids [14] and ambient seawater. It is assumed here that the diffuse fluids form by subseafloor mixing of ascending hydrothermal fluids with
seawater. The endmember hydrothermal fluid composi-tion is taken from black smoker vent fluids issuing within a few meters of the diffuse vent site [13,14]. The percen-tage of hydrothermal fluid is estimated using a simple mass balance for silica:
Hydrothermal Fluid % =
100• CSiO2(aq)diffuse fluid- CSiO2(aq), sw CSiO2(aq)hydrothermal fluid- CSiO2(aq),sw
Silica is known to precipitate slowly at low tempera-tures from mildly acidic fluids [15] and can be assumed to behave conservatively at the time scales of fluid mix-ing [16].
Geochemist Workbench®(GWB) was used to conduct the thermodynamic calculations [17]. A Log Krdatabase
was created, covering temperatures from 0 to 350°C at a pressure of 25 MPa, using SUPCRT92 [18] and the ther-modynamic database OBIGT [19], and including all spe-ciation reactions in an aqueous system with Na, Ca, Mg, Fe, Sr, K, SiO2, Cl, sulfate, sulfide, oxygen, hydrogen and
carbon dioxide. Likewise, equilibrium constants for the following catabolic reactions were calculated.
Aerobic sulfide oxidation
H2S(aq)+ 2O2(aq)→SO24−+ 2H
+ (1)
Aerobic methane oxidation
CH4(aq)+ 2O2(aq)→CO2(aq)+ 2H2O (2)
Aerobic iron oxidation
Fe2++ 1/4 O2(aq)+ 2.5H2O→Fe(OH)3+ 2H+ (3)
Aerobic hydrogen oxidation
2H2(aq)+ O2(aq)→2H2O (4)
Hydrogenotrophic sulfate reduction
4H2(aq)+ SO24−+ 2H +→
H2S(aq)+ 4H2O (5)
Hydrogenotrophic methanogenesis
4H2(aq)+ CO2(aq)→CH4(aq)+ 2H2O (6)
Anaerobic oxidation of methane
CH4(aq)+ SO24−+ 2H+→H2S(aq)+ CO2(aq)+ 2H2O(7)
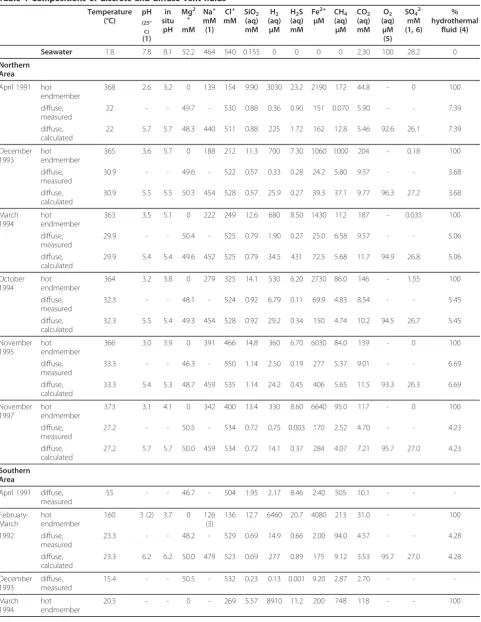
Published compositions of endmember vent fluids [13,14] issuing from black smoker chimneys in proximity (few meters) to the diffuse vent site were used in the cal-culations of affinities for these reactions (Table 1). In determining Qr(equation2), the extended Debye-Hückel
Table 1 Compositions of discrete and diffuse vent fluids
Temperature (°C)
pH
(25°
C)
(1) in situ
pH
Mg2
+
mM Na+ mM (1)
Cl+ mM
SiO2
(aq) mM
H2
(aq)
μM H2S
(aq) mM
Fe2+
μM
CH4
(aq)
μM
CO2
(aq) mM
O2
(aq)
μM (5)
SO4
2-mM (1, 6)
% hydrothermal
fluid (4)
Seawater 1.8 7.8 8.1 52.2 464 540 0.155 0 0 0 0 2.30 100 28.2 0
Northern Area
April 1991 hot endmember
368 2.6 3.2 0 139 154 9.90 3030 23.2 2190 172 44.8 - 0 100
diffuse, measured
22 - - 49.7 - 530 0.88 0.36 0.90 151 0.070 5.90 - - 7.39
diffuse, calculated
22 5.7 5.7 48.3 440 511 0.88 225 1.72 162 12.8 5.46 92.6 26.1 7.39
December 1993
hot endmember
365 3.6 5.7 0 188 212 11.3 700 7.30 1060 1000 204 - 0.18 100
diffuse, measured
30.9 - - 49.6 - 522 0.57 0.33 0.28 24.2 5.80 9.57 - - 3.68
diffuse, calculated
30.9 5.5 5.5 50.3 454 528 0.57 25.9 0.27 39.3 37.1 9.77 96.3 27.2 3.68
March 1994
hot endmember
363 3.5 5.1 0 222 249 12.6 680 8.50 1430 112 187 - 0.035 100
diffuse, measured
29.9 - - 50.4 - 525 0.79 1.90 0.27 25.0 6.58 9.57 - - 5.06
diffuse, calculated
29.9 5.4 5.4 49.6 452 525 0.79 34.5 431 72.5 5.68 11.7 94.9 26.8 5.06
October 1994
hot endmember
364 3.2 3.8 0 279 325 14.1 530 6.20 2730 86.0 146 - 1.55 100
diffuse, measured
32.3 - - 48.1 - 524 0.92 6.79 0.11 69.9 4.83 8.54 - - 5.45
diffuse, calculated
32.3 5.5 5.4 49.3 454 528 0.92 29.2 0.34 150 4.74 10.2 94.5 26.7 5.45
November 1995
hot endmember
366 3.0 3.9 0 391 466 14.8 360 6.70 6030 84.0 139 - 0 100
diffuse, measured
33.3 - - 46.3 - 550 1.14 2.50 0.19 277 5.37 9.01 - - 6.69
diffuse, calculated
33.3 5.4 5.3 48.7 459 535 1.14 24.2 0.45 406 5.65 11.5 93.3 26.3 6.69
November 1997
hot endmember
373 3.1 4.1 0 342 400 13.4 330 8.60 6640 95.0 117 - 0 100
diffuse, measured
27.2 - - 50.5 - 534 0.72 0.75 0.003 170 2.52 4.70 - - 4.23
diffuse, calculated
27.2 5.7 5.7 50.0 459 534 0.72 14.1 0.37 284 4.07 7.21 95.7 27.0 4.23
Southern Area
April 1991 diffuse, measured
55 - - 46.7 - 504 1.95 2.17 8.46 2.40 505 10.1 - -
- February-March
hot endmember
160 3 (2) 3.7 0 126
(3)
136 12.7 6460 20.7 4080 213 31.0 - - 100
1992 diffuse, measured
23.3 - - 48.2 - 529 0.69 14.9 0.66 2.00 94.0 4.57 - - 4.28
diffuse, calculated
23.3 6.2 6.2 50.0 479 523 0.69 277 0.89 175 9.12 3.53 95.7 27.0 4.28
December 1993
diffuse, measured
15.4 - - 50.5 - 532 0.23 0.13 0.001 9.20 2.87 2.70 - -
-March 1994
hot endmember
species from Wolery and Jove-Colon [20]. Dissolved neu-tral species were assigned an activity coefficient of one, except non-polar species for which CO2activity
coeffi-cients were used [21]. Reported pH values of hydrothermal vents (measured at 25°C) were used in determining thein
situpH (Table 1) by re-speciating the fluids at the tem-peratures of venting [22]. The percentage of hydrothermal endmember fluid in the diffuse fluids derived from the silica mass balance was used to calculate idealized mixed fluids, assuming conservative behavior of all elements. These hypothetical fluids were also speciated and com-pared with actual compositions of diffuse fluids in terms of concentrations and affinities (Tables 1 and 2). Deviations from conservative behavior in the diffuse fluids indicate that removal or release processes take place in the subsea-floor mixing zones in which the diffuse fluids are formed. In the calculations, the activities of species in the hypothe-tical diffuse fluids (ideal conservative mixing) were deter-mined in a batch mixing model simulating titration of hot hydrothermal endmember fluid into cold seawater and tracking the chemical speciation changes in the mixed fluid. In these calculations, redox reactions were
suppressed, while kinetically fast reactions like protonation of bases, dissociation of acids, and complex formation are allowed to take place spontaneously. Redox reactions were suppressed, because these reactions are not expected to proceed at the low temperatures of the diffuse fluids and on the short time scales of the mixing process [23]. This procedure has the advantage that disequilibria formed dur-ing mixdur-ing can be determined and the affinities of selected redox reactions may be calculated. GWB also allows sup-pressing the Knallgas reaction, so elevated concentrations of both O2and H2in the mixed fluids could be accounted
for [9].
The precipitation of minerals was also suppressed. The thermodynamically stable Fe-minerals in the diffuse fluids are hematite and pyrite. If these phases were allowed to precipitate, Fe concentrations would drop to extremely low values in the hypothetical mixed fluids. The measured diffuse fluids have Fe concentrations that are many orders of magnitude higher than values corresponding to pyrite and hematite solubility. They are hence strongly oversatu-rated with respect to pyrite and hematite and indicate that precipitation of these minerals was largely inhibited. The
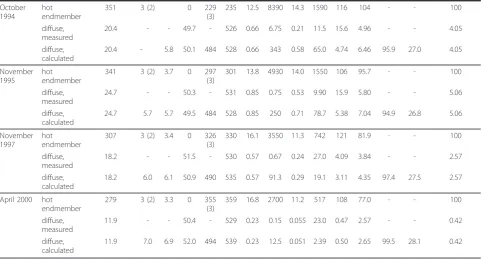
Table 1 Compositions of discrete and diffuse vent fluids(Continued)
October 1994
hot endmember
351 3 (2) 0 229
(3)
235 12.5 8390 14.3 1590 116 104 - - 100
diffuse, measured
20.4 - - 49.7 - 526 0.66 6.75 0.21 11.5 15.6 4.96 - - 4.05
diffuse, calculated
20.4 - 5.8 50.1 484 528 0.66 343 0.58 65.0 4.74 6.46 95.9 27.0 4.05
November 1995
hot endmember
341 3 (2) 3.7 0 297
(3)
301 13.8 4930 14.0 1550 106 95.7 - - 100
diffuse, measured
24.7 - - 50.3 - 531 0.85 0.75 0.53 9.90 15.9 5.80 - - 5.06
diffuse, calculated
24.7 5.7 5.7 49.5 484 528 0.85 250 0.71 78.7 5.38 7.04 94.9 26.8 5.06
November 1997
hot endmember
307 3 (2) 3.4 0 326
(3)
330 16.1 3550 11.3 742 121 81.9 - - 100
diffuse, measured
18.2 - - 51.5 - 530 0.57 0.67 0.24 27.0 4.09 3.84 - - 2.57
diffuse, calculated
18.2 6.0 6.1 50.9 490 535 0.57 91.3 0.29 19.1 3.11 4.35 97.4 27.5 2.57
April 2000 hot endmember
279 3 (2) 3.3 0 355
(3)
359 16.8 2700 11.2 517 108 77.0 - - 100
diffuse, measured
11.9 - - 50.4 - 529 0.23 0.15 0.055 23.0 0.47 2.57 - - 0.42
diffuse, calculated
11.9 7.0 6.9 52.0 494 539 0.23 12.5 0.051 2.39 0.50 2.65 99.5 28.1 0.42
Fluid data for high temperature fluids and measured diffuse fluids are from Von Damm and Lilley, 2004 [13]
Northern Area: Hot vent fluids are from Bio9 and Bio9’and the associated diffuse fluids from BM9Rifia, BM91o and BM12 Southern Area: High temperature fluids are from Tube Worm Pillar (TWP) and the diffuse fluids from Y vent at the base of TWP (1) pH, sodium and sulfate concentrations of vent fluids are from Von Damm [14], unless otherwise indicated
(2) pH was not measured but is approximated by comparison with similar vent fluids from Von Damm [14] (3) Na+
calculated by charge balance
(4) Calculated assuming conservative behavior of SiO2(aq)
(5) O2(aq) in diffuse fluids was calculated from conservative mixing, assuming 100μMol O2for pacific bottom seawater [30]
concentrations of Fe and H2S calculated for the
hypotheti-cal mixed fluids represent maximum values.
The affinities calculated (Table 2) represent the maxi-mum energy content for the different catabolic reactions, disregarding the fact that limiting electron donors and acceptors, which appear in several reactions, can still only be used once within the ecosystem [24]. Moreover, com-parisons of the raw affinities do not reflect differences in the numbers of electrons transferred in these reactions. This is problematic, because a given quantity of proton motive force driving chemiosmosis is generated by a set number of electrons transferred. The fact that the reac-tions considered have between one and eight electron transferred therefore skews a comparison of the affinities of different reactions. We hence report the affinities in values per electron transferred (Table 2). Furthermore, the energy flux into the system is controlled by the concentra-tion of the limiting reactant in the upwelling fluid. To examine these combined effects on energy availability, we normalized affinity to kg vent fluid by multiplying the energy with the concentration of the limited reactant, and divided by the fraction of endmember vent fluid in the mix [24]. These normalized affinities provide us with a meaningful parameter for assessing the fluxes of energy for different catabolic reactions into a system. While affi-nities expressed in both notations are reported in Table 2, the following discussion will primarily use normalized affi-nity, i.e., energy flux.
Results and Discussion Case studies
The sample locations are situated in the axial summit caldera of the fast spreading (11 cm/yr full rate) ridge EPR at 9°50’N at a water depth of 2500 meters. In both case studies we use data from time series studies con-ducted in the 1990s. Venting temperatures are≤55°C,
and fluids issue from cracks in the seafloor or from lava pillars that are fissured near the base. Compositions of vent fluids from the two sites are reported in Von Damm and Lilley [13] and Von Damm [11]. These publications also present a detailed description of the geological set-ting and vent field characteristics, so we here highlight only the key features of these localities.
The northern area is characterized by the high tempera-ture vents Bio9 and Bio9’and the associated diffuse flow sites BM9Riftia (BM9R), BM91o and BM12. The data set for this system (hereinafter referred to as Bio9 area) is the most detailed, because the site was the target of long-term measurements of fluid composition and temperature [25] and seismic activity [26]. Sohn et al. [26] documented a seismic swarm in 1995 in this area, followed by a tempera-ture increase in the Bio9 vent with a delay of a few days [25]. Temperatures of the diffuse fluid samples range between 22.0 and 33.3°C (Table 1).
The southern area (Tube Worm Pillar, TWP) features high temperature venting through an 11-m high sulfide structure on top of a lava pillar. Discrete venting of 351°C fluid is restricted to the top of the chimney, while leakage of diffuse fluids is observed from around the base of the chimney. Eponymous for the site name, a large tubeworm colony inhabits the area of diffuse venting. The associated diffuse fluid samples were retrieved from Y vent, an adja-cent broken-off lava pillar that issued fluids of tempera-tures between 20 and 25°C in 1992-1995, dropping to 18°C in 1997 and finally to 12°C in 2000.
Case study 1 - Bio9 area
Shank et al. [27] studied the change in the vent commu-nity during the time period from 1991 to 1995 at the vents in the Bio9 area. These authors report of a magmatic event in 1991, followed by venting of fluids high in hydro-gen sulfide. These conditions boosted the establishment of
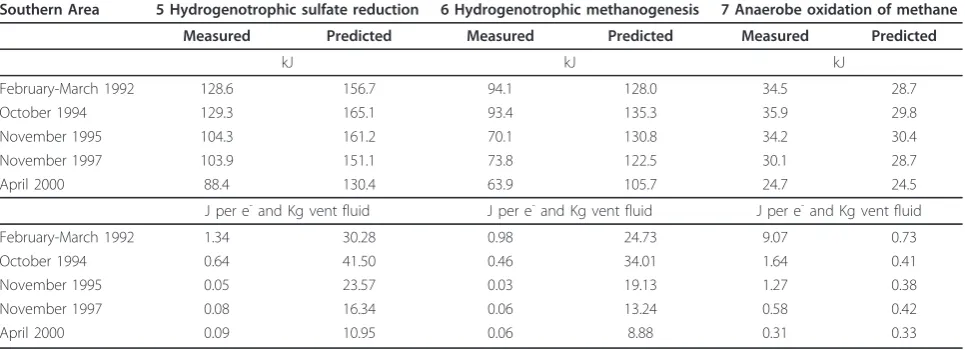
Table 2 Affinities for different catabolic reactions in kJ and normalized affinities in J per e-and Kg Vent-fluid at the Southern Area (TWP)
Southern Area 5 Hydrogenotrophic sulfate reduction 6 Hydrogenotrophic methanogenesis 7 Anaerobe oxidation of methane
Measured Predicted Measured Predicted Measured Predicted
kJ kJ kJ
February-March 1992 128.6 156.7 94.1 128.0 34.5 28.7
October 1994 129.3 165.1 93.4 135.3 35.9 29.8
November 1995 104.3 161.2 70.1 130.8 34.2 30.4
November 1997 103.9 151.1 73.8 122.5 30.1 28.7
April 2000 88.4 130.4 63.9 105.7 24.7 24.5
J per e-and Kg vent fluid J per e-and Kg vent fluid J per e-and Kg vent fluid
February-March 1992 1.34 30.28 0.98 24.73 9.07 0.73
October 1994 0.64 41.50 0.46 34.01 1.64 0.41
November 1995 0.05 23.57 0.03 19.13 1.27 0.38
November 1997 0.08 16.34 0.06 13.24 0.58 0.42
a strong population of the tubewormRiftia. During the following cruises in 1994, Shank et al. [27] observed the development of rusty spots that appeared within theRiftia colonies. In 1995, the rusty spots had spread and covered large areas of the Riftiapopulation. In 1997, theRiftia population had broken down largely, while the rust had extended to cover much of theRiftiapatch [13].
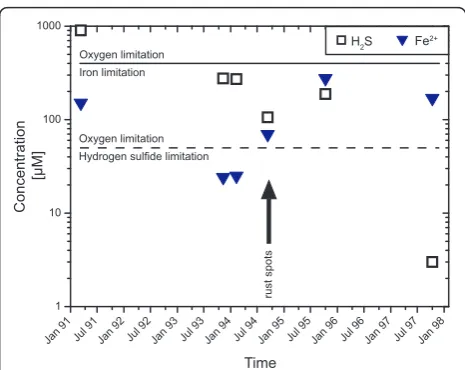
The temporal evolution of the fluid compositions in that time span reveals a decrease in hydrogen sulfide concentrations over the entire period after 1992 with a slight increase in November of 1995 (Figure 2). Before March of 1994, soluble iron follows the hydrogen sulfide concentration; afterwards the iron content increased and reached maximum concentrations during November of 1995. In November of 1997, the Fe concentration had dropped slightly, but was still much higher than during the beginning of the time series.
It has been suggested that the biological development of this area depends on the bioavailability of iron and H2S [13]. This interpretation is plausible, becauseRiftia
live in symbiosis with sulfide oxidizing bacteria [28] and depend on the energy associated with sulfide oxidation. Also, Fe-oxidizing bacteria oxidize Fe2+in the fluids to ferric hydroxide [29]. So the“rust”in the study area is an indicator that these microorganisms are thriving.
We determined the affinities for both catabolic pathways for the time period of critical geochemical and ecological changes (1991-1997) to improve the understanding of the biological evolution of the vent ecosystems. The calcula-tions make use of the measured concentracalcula-tions of iron, H2S and oxygen. Unfortunately concentrations of oxygen
and the pH for diffuse fluids are not available; therefore, these values are estimated from conservative mixing. Calculated pH values for the fluids show a narrow range of 5.3 to 5.7; likewise, small variations are predicted for oxygen concentrations (92 - 96μM). Both pH and O2
con-centrations reflect the large fraction of seawater calculated from the silica mass balance. Depending on the mixing ratio of vent fluid and seawater, either one of the electron donors (Fe2+, H2S) or oxygen is the limiting reactant
determining the amount of energy available per unit vent fluid based (Figure 2). Figure 2 shows the upper limit for iron and H2S oxidation based on an oxygen concentration
of the East Pacific bottom seawater of circa 100μM oxy-gen [30]. For H2S oxidation, O2is the limiting reactant,
while Fe-oxidation is limited by the availability of iron. An exception is the fluid sampled last in the time series; it exhibits exceptionally low sulfide concentrations and H2S
is the compound limiting energy availability.
Figure 3 illustrates the normalized affinities for both reactions. It shows the consequence of limitation; sulfide oxidation has the highest affinity when the fraction of vent fluid in the mixture is lowest (Table 1), because then oxygen contents are greatest. In contrast, the
normalized affinities for iron oxidation more closely mir-ror the iron concentration in the fluid. But affinities are also dependent on the vent fluid fraction, as increased pH favors ferric hydroxide precipitation from the mixed fluids.
The dynamic changes in the normalized affinities of sul-fide and iron oxidation (Figure 3 and Additional File 1) can fully explain the ecological changes within the system. The incipient occurrence of rusty staining in November of 1994 correlates with an increased normalized affinity of iron oxidation, while the normalized affinity for sulfide oxidation remains at the same level. In November of 1995 a further increase in iron concentration in the fluid explains the continued spreading of the iron oxide stain-ing. Tied to this change, the normalized affinity for Fe-oxidation almost quadrupled. The normalized affinity for hydrogen sulfide oxidation was only slightly decreased relative to 1994, which explains why the tubeworm colo-nies were still thriving, despite the increased development of rusty staining. Apparently, both metabolic pathways were favorable and were being exploited at that stage of system evolution. After 1995, the normalized affinity for hydrogen sulfide oxidation dropped as a consequence of the strongly decreased sulfide concentration in the fluid. Because of this drop in the affinity of sulfide oxidation, the tubeworm population, relying on favorable energetics for H2S oxidation, collapsed. Unlike sulfide oxidation, the
nor-malized affinity for iron oxidation remains high, so organ-isms with the ability to gain energy from iron oxidation
Jan 91 Jul 91 Jan 92 Jul 92 Jan 93 Jul 93 Jan 94 Jul 94 Jan 95 Jul 95 Jan 96 Jul 96 Jan 97 Jul 97 Jan 98
1 10 100 1000
Time
H2S Fe
2+
Concentration
[µM]
Oxygen limitation Iron limitation
Oxygen limitation Hydrogen sulfide limitation
rust spots
Figure 2Temporal changes in concentrations of dissolved iron
and hydrogen sulfide in diffuse fluids from the Bio9 area. The
can still thrive. Since both reactions depend on oxygen, the reactions are in competition for that electron acceptor and the calculated affinities (Figure 3) are the predicted maxima.
The thermodynamic calculations presented here vali-date the interpretation by Von Damm and Lilley [13] and confirm that the ecological changes are driven by changes in fluid composition.
Case study 2 - Tube Worm Pillar (TWP)
The fluid compositions of the diffuse fluids issuing in TWP area have been proposed to reveal insights in the redox reactions in the subseafloor [13,31]. Increased methane concentrations in the diffuse fluids led Von Damm and Lilley [13] to propose that hydrogenotrophic methanogenesis takes place in the subseafloor. Proskur-owski et al. [31] could confirm this interpretation through carbon stable isotope measurements of methane and CO2
demonstrating that the carbon isotope ratios are consis-tent with active microbial carbon cycling in this area.
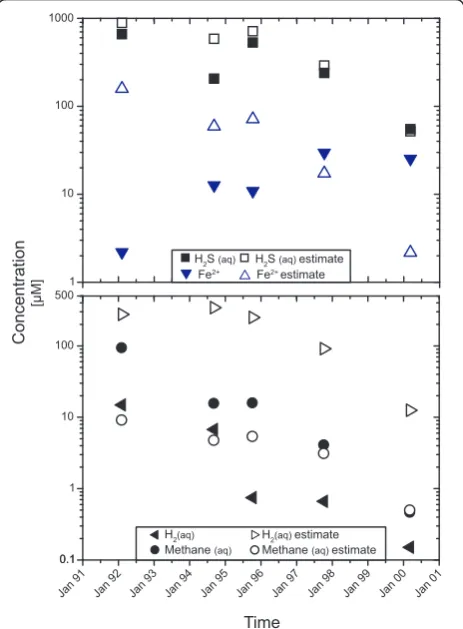
The compositional changes of diffuse fluid composi-tions relative to the concentracomposi-tions predicted from con-servative mixing are depicted in Figure 4. Throughout the time series, H2concentrations are decreased by 1.5 to
2 orders of magnitude relative to the concentrations expected from conservative mixing (cf. Table 1). Methane, in contrast, is enriched by a factor of ten rela-tive to the value predicted from conservarela-tive mixing in February-March of 1992. In October 1994 and November
1995 this enrichment is about 3-fold. By 2000, measured methane corresponds to those predicted from conserva-tive mixing, and no methane excess can be observed (Figure 4). The methane excess in 1992-1995 is consis-tent with the decrease in hydrogen, and ratios of H2
depletion to CH4excess between 3 and 6 are consistent
with the stoichiometry of the hydrogenotrophic metha-nogenesis reaction, from which that ratio would be pre-dicted to be 4. In 1997 and 2000, however, methane excess was minimal and H2depletion was still significant,
suggesting that other hydrogen-consuming reactions may have also played a role.
While methane enrichment and depletion of hydrogen are indicators for methanogenesis, some of the methane
0 20 40 60 80 100 120 140 160 180 200 220
Jan 91 Jul 91 Jan 92 Jul 92 Jan 93 Jul 93 Jan 94 Jul 94 Jan 95 Jul 95 Jan 96 Jul 96 Jan 97 Jul 97 Jan 98
Af
finity
[J/e
- in reaction and kg endmember fluid]
0
Time
Iron oxidation Hydrogen sulfide oxidation
rust spots
Figure 3Normalized affinities for the oxidation of Fe2+and
H2S in diffuse fluids from the Bio9 area during the period from
April 1991 until November 1997. The generally high affinities for
iron and hydrogen sulfide oxidation support life catabolizing these reactions. In October of 1994, affinities for both reactions are high, so that tubeworms (H2S-oxidizers) and iron oxidizing microorganism
(rusty staining) can grow simultaneously. The demise of theRiftia population in November of 1997 coincides with a sudden drop in the affinity of H2S oxidation.
1 10 100 1000
Concentration
[µM]
H2S (aq) H2S (aq) estimate
Fe2+ estimate
Fe2+
Jan 00 Jan 01
Time
Jan 91 Jan 92 Jan 93 Jan 94 Jan 95 Jan 96 Jan 97 Jan 98 Jan 99
0.1 1 10 100 500
0.1 Methane (aq) Methane (aq) estimate
H2(aq) H2(aq) estimate
Figure 4 Predicted and measured concentrations of iron, hydrogen sulfide, hydrogen, and methane for diffuse fluids in
the Tube Worm Pillar area. Hydrogen is strongly depleted over
the entire period. Methane is enriched in the diffuse fluids, which may show methanogenesis in the subseafloor [13]. Until 1997, iron and H2S concentrations are generally lower than predicted from
conservative mixing. In November of 1997 predicted and measured concentration are similar to each other. In April of 2000 measured H2S concentrations also correspond to the predictions from
conservative mixing, but Fe-concentrations are higher than predicted in the diffuse fluid. Loss of Fe2+and H2S may be
may be metabolized shallower in the system prior to venting by aerobic or anaerobic respiration (Figure 1). There are indications from the Guaymas Basin that anaerobic oxidation of methane (AOM) may take place in vent settings and at temperatures > 30°C [32]. Our calculations suggest that AOM is energetically feasible, so a loss of methane through AOM may be possible. If this reaction took place in the subseafloor, depletions of methane should be associated with increased hydrogen sulfide concentrations. This trend is not observed. AOM may still be taking place, but the rates are too small to affect the compositions of the diffuse fluids.
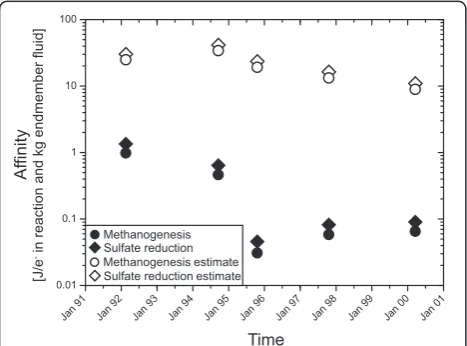
Affinity calculations for hydrogenotrophic methanogen-esis and sulfate reduction in the modeled fluid (Figure 5) indicate strong driving forces for both reactions. The affi-nity for the reaction is strongly controlled by the hydrogen activity, which has a power of 4 in the relevant mass action equations. Hydrogen endmember concentrations increase from 6460μM in February/March of 1992 to 8910μM in March of 1994. Hydrogen concentrations then decrease in the following years to 2700μM in April of 2000 (Table 1). Unfortunately, the time series contains three points with data lacking for either the diffuse or endmember fluid. In March of 1994, the highest hydrogen concentration in the endmember fluid was measured, but no diffuse fluid was sampled. Hence, in our calculations, the sample collected in October of 1994 has the highest predicted hydrogen content (Figure 4) and also the highest normalized affinity
for methanogenesis with 34.0 Joule per kg vent fluid and electron transferred in reaction (J/kg e-) or of 41.5 J/kg e -for sulfate reduction in the predicted diffuse fluid (Figure 5). The fluids sampled in April of 2000 have the smallest fraction of vent fluid and the lowest hydrogen endmember concentration of 12.5μM, yielding normalized affinities for methanogenesis of 8.9 J/kg e-and 11.0 J/kg e-for sul-fate reduction. In these diffuse fluids, hydrogen concentra-tions are still lower than predicted from conservative mixing and they do not correlate with the endmember concentration or extent of mixing with seawater.
Overall, hydrogen concentrations decrease linearly within the first four years of the time series from 14.9μM to 0.7μM. Hydrogen concentrations then remain fairly constant in the range of 0.7 to 0.2μM until 2000. Figure 5 shows the affinities of these reactions per mol electrons in the reaction and normalized to kg of vent fluid. The nor-malized affinities of sulfate reduction decrease from 1.4 J/ kg e-to 0.05 J/kg e-in 1995 and rebounds to 0.08-0.09 J/ kg e-in the following years. Hydrogenotrophic methano-genesis has an affinity of 1.0 J/kg e-in 1992 and decreases to 0.05 to 0.06 J/kg e-in 1995 - 2000 (Table 2).
The differences in the affinities (Table 2) reflect the variability in hydrogen concentrations, but the magnitude of these differences is quite small, because the intensive term (ΔrG°) in the Gibbs energy calculation is very large
for both reactions. The calculated affinities for methano-genesis and sulfate reduction (Table 2) lie above the esti-mated energy limit of microbial metabolism 10 kJ/8 e -[33]. Minimum H2concentrations required for microbial
harnessing of hydrogen at the temperatures of diffuse vent-ing (11.9 to 24.7°C) is on the order of 10-8M [33], which is considerably lower than the measured concentrations (> 2 × 10⁻⁷M). This result indicates that the microbial commu-nities consume hydrogen but do not control its abundance. Apparently, hydrothermally driven influx of H2into the
system is overall greater than the rate at which H2is
meta-bolized. The constant hydrogen concentrations between 1995 and 2000 probably indicate some sort of steady-state between influx of hydrogen from below and hydrogen con-sumption in the subseafloor ecosystem. The early phase of decreasing hydrogen concentrations in the diffuse fluids is not related to changes in endmember compositions (steady between 250 and 350μM), but may instead reflect the growth a hydrogenotrophic microbial community and increasing rates of consumption of H2advected into the
system by hydrothermal flow. In that early stage, there was a relation between H2depletion and methane production,
indicating that methanogenesis was responsible for both. In 1997 and 2000, H2was still consumed, but the methane
excess had disappeared. Instead, there was excess Fe in the fluids, suggesting that Fe-reduction was taking place, per-haps because it requires lower H2activities than
methano-genesis [33].
Jan 00 Jan 01
Time
Jan 91 Jan 92 Jan 93 Jan 94 Jan 95 Jan 96 Jan 97 Jan 98 Jan 99
0.01 0.1 1 10 100
Af
finity
[J/e
- in reaction
and kg endmember fluid]
Methanogenesis
Methanogenesisestimate
Sulfate reduction
Sulfate reductionestimate
Figure 5 Normalized affinities for sulfate reduction and
methanogenesis in the Tube Worm Pillar area. Affinities are high
in the hypothetical fluids calculated from conservative mixing of seawater and hydrothermal fluid. In the measured fluids the affinity is strongly decreased. Notably, affinities drop markedly in the first three years, which reflects the decrease in H2concentration in that
time span (Figure 4). The removal of H2and the lowering of affinity
reflect the exploitation of H2in fueling catabolic activity. During the
Conclusions
Thermodynamic calculations of energy yields of catabolic reactions from geochemical data of diffuse fluids facilitate an assessment of microbial metabolism in vent settings. This has been demonstrated in two case studies, both from the EPR 9°50’N region, where published geochemical data [13,14] where used in systematic calculations of affi-nities of different catabolic reactions.
In the Bio9 area, affinities for sulfide oxidation strongly decrease, which is in accordance with the dyingRiftia population. At the same time, an increase in the affinity for iron oxidation corresponds to a massive spread of red stain-ing in the area, which is likely evidence for Fe-oxidizstain-ing bacteria. The results of the energy calculations verify the idea that the sudden change in vent fauna is a result of changes in fluid chemistry.
The example from the Bio9 area is more relevant to sub-seafloor processes. Enrichment of methane in diffuse fluids points to methanogenesis in the mixing and cooling zone. Our calculations confirm that hydrogenotrophic catabolic reactions have large energy yields throughout the duration of the time series (1992-2000). A large discrepancy in the amount of H2predicted from conservative mixing and the
measured H2concentrations indicate effective scrubbing
of H2by subseafloor hydrogenotrophic microorganisms.
During the first three years of the time series, affinities for hydrogenotrophic reactions decreased despite continued high H2concentrations in the endmember fluids. This is
interpreted to indicate the development of a hydrogeno-trophic-based microbial ecosystem in the subseafloor. Between 1995 and 2000, the affinities remained constant and low (about an order of magnitude above the biological energy quantum). Apparently, influx of hydrogen from below and consumption of hydrogen within the subsea-floor had reached a steady state. In 1997 and 2000, methane excesses were minimal, but the fluids showed pronounced enrichment of Fe relative to the concentra-tions predicted from conservative mixing. This finding may indicate a switch within the system from methano-genesis to Fe-reduction.
Our results show how thermodynamic calculations can be used to examine the relations between changes in fluid chemistry and seafloor biology. They are also a helpful tool in examining processes in the subseafloor and help highlight the tight relations and interdependen-cies between geochemistry and microbiology in vent systems.
Additional material
Additional file 1: Table: Calculated normalized affinities for Aerobic
sulfide oxidation and iron oxidation in J per e-and kg Vent-fluid at
the Northern Area (Bio9). Additional Data to Figure 3
Acknowledgements
We are grateful to two anonymous reviewers for numerous helpful comments and suggestions and to Greg Druschel for efficient editorial handling. This work was funded through the German Research Foundation (Grant BA1605/6-1). WB acknowledges additional support through the University of Bremen and the MARUM Research Center and Cluster of Excellence.
Authors’contributions
The study was developed jointly by both authors. MH conducted the thermodynamic calculations. Both authors were involved equally in the interpretations of the results and in writing and editing of the manuscript. All authors have read and approved the final manuscript.
Competing interests
The authors declare that they have no competing interests.
Received: 28 June 2011 Accepted: 27 January 2012 Published: 27 January 2012
References
1. Jannasch HW:Microbial interactions with hydrothermal fluids.InSeafloor Hydrothermal Systems: Physical, Chemical, Biological, and Geological Interactions. Volume 91.Edited by: Humphris SE, et al. Washington, DC: American Geophysical Union, American Geophysical Union; 1995:273-273, Geophysical Monograph.
2. McCollom TM, Shock EL:Geochemical constraints on
chemolithoautotrophic metabolism by microorganisms in seafloor hydrothermal systems.Geochimica et Cosmochimica Acta1997,
61:4375-4391.
3. Amend JP, McCollom TM, Hentscher M, Bach W:Catabolic and anabolic energy for chemolithoautotrophs in deep-sea hydrothermal systems hosted in different rock types.Geochimica et Cosmochimica Acta2011,
75:5736-5748.
4. Shock E, Holland ME:Geochemical energy sources that support the subsurface biosphere.InThe Subseafloor Biosphere at Mid-Ocean Ridges. Edited by: Wilcock WSD, DeLong EF, Kelley DS, Baross JA, Cary SC. Washington, DC: American Geophysical Union; 2004:153-165, Geophysical Monograph.
5. Houghton JL, Seyfried WE Jr:An experimental and theoretical approach to determining linkages between geochemical variability and microbial biodiversity in seafloor hydrothermal chimneys.Geobiology2010,
8:457-470.
6. Huber JA, Butterfield DA, Baross JA:Bacterial diversity in a subseafloor habitat following a deep-sea volcanic eruption.FEMS Microbiology Ecology 2003,43:393-409.
7. Reysenbach A-L, Liu Y, Banta AB, Beveridge TJ, Kirshtein JD, Schouten S, Tivey MK, Von Damm KL, Voytek MA:A ubiquitous thermoacidophilic archaeon from deep-sea hydrothermal vents.Nature2006,442:444-447. 8. Kormas KA, Tivey MK, Von Damm K, Teske A:Bacterial and archaeal
phylotypes associated with distinct mineralogical layers of a white smoker spire from a deep-sea hydrothermal vent site (9°N, East Pacific Rise).Environmental Microbiology2006,8:909-920.
9. Perner M, Bach W, Hentscher M, Koschinsky A, Garbe-Schönberg D, Streit WR, Strauss H:Short-term microbial and physico-chemical variability in low-temperature hydrothermal fluids near 5°S on the Mid-Atlantic Ridge.Environmental Microbiology2009,11:2526-2541.
10. Petersen JM, Zielinski FU, Pape T, Seifert R, Moraru C, Amann R, Hourdez S, Girguis PR, Wankel SD, Barbe V,et al:Hydrogen is an energy source for hydrothermal vent symbioses.Nature2011,476:176-180.
11. Amend JP, Shock EL:Energetics of overall metabolic reactions of thermophilic and hyperthermophilic Archaea and Bacteria.FEMS Microbiology Reviews2001,25:175-243.
12. Helgeson HC:Mass transfer among minerals and hydrothermal solutions.
Geochemistry of hydrothermal ore deposits1979,2:568-610.
14. Von Damm KL:Evolution of the hydrothermal system at East Pacific Rise 9 50’N: Geochemical evidence for changes in the upper oceanic crust.In Mid-Ocean Ridges: Hydrothermal Interactions between the Lithosphere and Oceans.Edited by: German CR, Lin J, Parson LM. Washington, DC: American Geophysical Union; 2004:285-304, Geophysical Monograph.
15. Carroll S, Mroczek E, Alai M, Ebert M:Amorphous silica precipitation (60 to 120°C): comparison of laboratory and field rates.Geochimica et Cosmochimica Acta1998,62:1379-1396.
16. Edmond JM, Measures C, McDuff RE, Chan LH, Collier R, Grant B, Gordon LI, Corliss JB:Ridge crest hydrothermal activity and the balances of the major and minor elements in the ocean: The Galapagos data.Earth and Planetary Science Letters1979,46:1-18.
17. Bethke C:Geochemical reaction modeling: Concepts and applications.
Oxford University Press, USA; 1996.
18. Johnson JW, Oelkers EH, Helgeson HC:SUPCRT92: A software package for calculating the standard molal thermodynamic properties of minerals, gases, aqueous species, and reactions from 1 to 5000 bar and 0 to 1000°C.Computers & Geosciences1992,18:899-947.
19. Dick J:Calculation of the relative metastabilities of proteins using the CHNOSZ software package.Geochemical Transactions2008, 9. 20. Wolery T, Jove-Colon C:Qualification of thermodynamic data for
geochemical modeling of mineral-water interactions in dilute systems.In Energy.Edited by: US Department of Energy. Bechtel SAIC Company, Las Vegas, Nevadam, USA; 2004:.
21. Drummond SE:Boiling and mixing of hydrothermal fluids.Ph D thesis University Microfilms Int.; 1981.
22. Tivey MK, Humphris SE, Thompson G, Hannington MD, Rona PA:Deducing patterns of fluid flow and mixing within the TAG active hydrothermal mound using mineralogical and geochemical data.J Geophys Res1995,
100:12527-12555.
23. Foustoukos DI, Houghton JL, Seyfried WE Jr, Sievert SM, Cody GD:Kinetics of H2-O2-H2O redox equilibria and formation of metastable H2O2under
low temperature hydrothermal conditions.Geochimica et Cosmochimica Acta2011,75:1594-1607.
24. McCollom TM:Geochemical constraints on sources of metabolic energy for chemolithoautotrophy in ultramafic-hosted deep-sea hydrothermal systems.Astrobiology2007,7:933-950.
25. Fornari DJ, Shank T, Von Damm KL, Gregg TKP, Lilley M, Levai G, Bray A, Haymon RM, Perfit MR, Lutz R:Time-series temperature measurements at high-temperature hydrothermal vents, East Pacific Rise 9°49’-51’N: evidence for monitoring a crustal cracking event.Earth and Planetary Science Letters1998,160:419-431.
26. Sohn RA, Fornari DJ, Von Damm KL, Hildebrand JA, Webb SC:Seismic and hydrothermal evidence for a cracking event on the East Pacific Rise crest at 9° 50’N.Nature1998,396:159-161.
27. Shank TM, Fornari DJ, Von Damm KL, Lilley MD, Haymon RM, Lutz RA:
Temporal and spatial patterns of biological community development at nascent deep-sea hydrothermal vents (9°50’N, East Pacific Rise).Deep Sea Research Part II: Topical Studies in Oceanography1998,45:465-515. 28. Cavanaugh CM:Symbiotic chemoautotrophic bacteria in marine
invertebrates from sulphide-rich habitats.Nature1983,302:58-61. 29. Toner BM, Santelli CM, Marcus MA, Wirth R, Chan CS, McCollom T, Bach W,
Edwards KJ:Biogenic iron oxyhydroxide formation at mid-ocean ridge hydrothermal vents: Juan de Fuca Ridge.Geochimica et Cosmochimica Acta2009,73:388-403.
30. Betts JN, Holland HD:The oxygen content of ocean bottom waters, the burial efficiency of organic carbon, and the regulation of atmospheric oxygen.Palaeogeography, Palaeoclimatology, Palaeoecology1991,97:5-18. 31. Proskurowski G, Lilley MD, Olson EJ:Stable isotopic evidence in support of
active microbial methane cycling in low-temperature diffuse flow vents at 9°50’N East Pacific Rise.Geochimica et Cosmochimica Acta2008,
72:2005-2023.
32. Schouten S, Wakeham SG, Hopmans EC, Sinninghe Damste JS:
Biogeochemical evidence that thermophilic archaea mediate the anaerobic oxidation of methane.Appl Environ Microbiol2003,
69:1680-1686.
33. Hoehler TM:Biological energy requirements as quantitative boundary conditions for life in the subsurface.Geobiology2004,2:205-215.
doi:10.1186/1467-4866-13-2
Cite this article as:Hentscher and Bach:Geochemically induced shifts in catabolic energy yields explain past ecological changes of diffuse vents in the East Pacific Rise 9°50’N area.Geochemical Transactions201213:2.
Submit your next manuscript to BioMed Central and take full advantage of:
• Convenient online submission
• Thorough peer review
• No space constraints or color figure charges
• Immediate publication on acceptance
• Inclusion in PubMed, CAS, Scopus and Google Scholar
• Research which is freely available for redistribution