Page 372 www.ijiras.com | Email: [email protected]
Analyzing The Spatial And Temporal Variability Of Vegetation
Cover And Land Surface Temperature Over Ghana From 2005 To
2015
Ebenezer Tetteh Domaley
Edward Mathew Osei JNR
Samual Ato Andam Akorful
Lily Lisa Yevugah
Department of Geomatic Engineering, Kwame Nkrumah University of Science & Technology, Kumasi, Ghana
I. INTRODUCTION
From elementary science it is known that temperature is the degree of hotness or coldness of a substance. Land surface
temperature therefore is how hot or cold the “surface” of the Earth would feel to the touch in a particular location. From a satellite‟s point of view, the “surface” is whatever the satellite sees (or senses) when it looks through the atmosphere to the
Page 373 www.ijiras.com | Email: [email protected] ground. This could be snow and ice, the grass on a lawn, the
roof of a building, or the leaves in the canopy of a forest. Land Surface Temperature (LST) is an important variable required for a wide variety of applications, e.g. climatological, hydrological, agricultural, biogeochemical, and change detection studies, among many more. Land Surface Temperature is maintained by the incoming solar and longwave irradiation, the outgoing terrestrial infrared radiation, the sensible and latent heat flux, and the ground heat flux (Wang et al., 2010). Therefore, Land Surface Temperature is therefore a good indicator of Earth‟s surface energy balance. Researchers constantly monitor Land Surface Temperature on the grounds that the radiation emanating off the Earth's scenes impacts (and is also affected by) our world's climate and atmosphere patterns. Researchers need to continually assess how increasing atmospheric greenhouse gases affect Land Surface Temperature, and how rising Land Surface Temperatures influence ice sheets, glaciers, permafrost, and the vegetation in Earth's ecosystems.
Within the electromagnetic spectrum, the wavelength ranges that is most useful for land surface temperature (LST) measurements is the thermal infrared (TIR) region, which ranges between 8 μm and 15 μm as noted by Lillesand et al
(2004). An exception to this however, is the passive microwave technique which has been used for land surface temperature measurement in the southern part of China by Chen et al. (2011). Passive microwave remote sensing technique however, appears to have some shortcomings in terms of their coarse spatial resolution which is typically in the region of tens of kilometers.
The Normalized Difference Vegetation Index (NDVI) is an indicator ranging between -0.3 and 1.0 that quantifies vegetation by means of measuring the difference between the near-infrared (NIR) which is the wavelength that is strongly reflected by vegetation (Lillesand et al 2004) and red (R) which is also the wavelength that is highly absorbed by vegetation (Lillesand et al 2004; Brown 2015; Didan et al, 2015). When harnessed, NDVI possesses the capability of analysing remotely sensed measurements to assess whether or not the object (material) under observation contains live green vegetation. Because the spectral behaviour of foliage, soil, rocks and mineral components across the electromagnetic spectrum are known, it is then possible to obtain NDVI information by placing emphasis on the near-infrared (NIR) and red (R) bands of the sensor (Lillesand et al 2004). Therefore, the magnitude of the difference between the near-infrared and the red reflectance, then determines the amount of vegetation.
NDVI is a highly versatile indicator found in a wide field of applications. In the field of crop yield assessment, it has been used by Ban et al, (2017) to forecast regional corn yields, performance of pasture, and rangeland containment capacities and many more (Zewdie et al, 2017). NDVI is most often directly related to other surface parameters such as percentage of vegetation cover, photosynthetic activity of plants, rainfall, leaf area index, the amount of biomass and in some cases soil moisture content (Didan et al, 2015).
NDVI values when averaged over a certain time interval, establishes a "normal" growing condition in a region for a given time of year (Ban et al, 2017). According to Brown
(2015), Advance monitoring and assessment can then distinguish the health of vegetation in that place relative to the norm. When analyzed through time, NDVI can be used as an indicator to show where vegetation is striving well and where vegetation is not, as well as changes in vegetation cover or type due to human activities such as deforestation, life stock grazing, natural obstructions such as wild fires, or changes in plants' phenological stage (Brown 2015).
Vegetation is one of the key constituent of the global ecosystem, in the sense that, it maintains balance in the ecosystem by way of its ability to retain water, aid atmospheric circulation and maintain terrestrial soil stability (Leilei et al, 2014). Monitoring and mapping of vegetation are therefore very crucial for various modelling applications in such fields as; agro-ecosystem, climatology, crop yield and vegetation health.
This research seeks to relate the response of vegetation greenness to land surface temperature. The research will also assess the spatial variability and relationship between land surface temperature and vegetation by means of time series analysis and correlation analysis.
II. MATERIALS AND METHOD
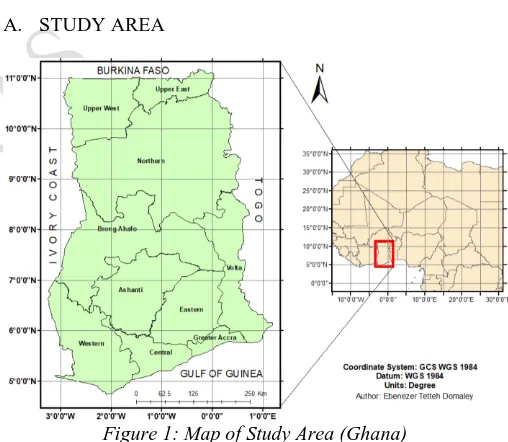
A. STUDY AREA
Figure 1: Map of Study Area (Ghana)
Ghana is found in the western part of Africa, along the Gulf of Guinea, between latitudes 4°44‟12.2” N and 11°10‟23.9” N and longitudes 1°11'30.4” E and 3°15'19.5” W, with an approximate land surface area of 239,460 square kilometers (World Book Encyclopedia, 1999b; AQUASTAT Survey, 2005).
Ghana has a tropical climate with two rainy seasons, from March to July and from September to October. The Northern part of Ghana has one wet season which spans from June to October (World Book Encyclopedia, 1999a; AQUASTAT Survey, 2005).
There are quite a wide range of vegetation types in Ghana. The major types being:
Strand and Mangrove; found along the coast or lagoons. Moist semi-deciduous; forest found in the southern part of
Page 374 www.ijiras.com | Email: [email protected] Sudan savannah; found in the northern part of Ghana
Guinea savannah; found in the transition zone of Ghana Tropical rain forest; found in the south-western part of
Ghana.
Coastal savannah and Shrubs found in the south-eastern coastal plains of Ghana.
B. BRIEF DESCRIPTION OF DATA
Data acquired for this study are;
MOD13C2: this is a version six MODIS Vegetation Indices product, obtained from the United States Geological Survey (USGS) website, at a special 0.05 Degree spatial resolution and temporal resolution of one month. MOD13C2 produced on a Climate Modelling Grid (CMG) and is a stage three validated data product (Didan, 2015). The data has a global coverage and available for all land areas.
MYD11C3: this is a version six MODIS Land Surface Temperature and Emissivity data product obtained from the United States Geological Survey (USGS) website at a special 0.05 Degree spatial resolution and at monthly temporal resolution. MYD11C3 produced on a Climate Modelling Grid (CMG) and is a stage three validated data product (Wan et al, 2015). The data has a global coverage and available for all land areas.
a. PRELIMINARY DATA PREPARATION
MOD13C2, obtained in hierarchical data format (. hdf) was imported into ERDAS Imagine and converted into imagine (.img) format. Area of Interest (for Ghana and all ten regions) were then clipped from the global dataset. The resulting raster was multiplied with the scale factor 0.0001 to convert from digital numbers into reflectance values ranging from -0.3 to 1.0 by use of a model I designed using the modelling tool in ERDAS Imagine.
The resulting raster was declared as float (this is to make raster arithmetic possible). The conversion from digital numbers to NDVI values was done.
MYD11C3, obtained in hierarchical data format (.hdf) was imported into ERDAS Imagine and converted into imagine (.img) format. Area of Interest (Ghana and all ten regions) were then clipped from the global dataset. The resulting raster was multiplied with the scale factor 0.02 to convert from digital numbers into surface temperature values and the resulting raster, declared as float. This was achieved by use of a model designed, using the modelling tool in ERDAS Imagine. The resulting raster was declared as „float‟
to make raster arithmetic possible.
C. DATA ANALYSIS
a. TIME SERIES ANALYSIS
Data for time series analysis was extracted from individual raster files of all 132 months (of the study period) for Land Surface Temperature and Vegetation Cover, at both national and regional level. These data were then fed into Microsoft Excel spread sheet and subsequently plotted. Times
series plots were produced for the entire study area (Ghana) and all ten regions of the country.
b. TEMPORAL CORRELATION ANALYSIS
Data extracted for the time series analysis was again used to perform the temporal correlation analysis to obtain correlation plots at both the national and regional level.
c. SPATIAL CORRELATION ANALYSIS
Data for spatial correlation was obtained by layer-stacking the various raster datasets into the following categories;
Monthly (from 2005 to 2015) e.g. Jan-2005, Jan-2006, Jan-2007 through to Jan-2015, then Feb-2005, Feb-2006, Feb-2007 through to Feb-2015 etc.
Yearly (from 2005 to 2015) e.g. (Jan to Dec 2005), (Jan to Dec 2006), (Jan to Dec 2007) through to (Jan to Dec 2015).
From January 2005, February 2005 through to December 2015
These data were then further processed and analyzed to obtain spatial correlation maps for the respective times.
III. RESULTS AND DISCUSSIONS
A. SPATIAL DISTRIBUTION OF LAND SURFACE TEMPERATURE AND VEGETATION
Page 375 www.ijiras.com | Email: [email protected]
(b)
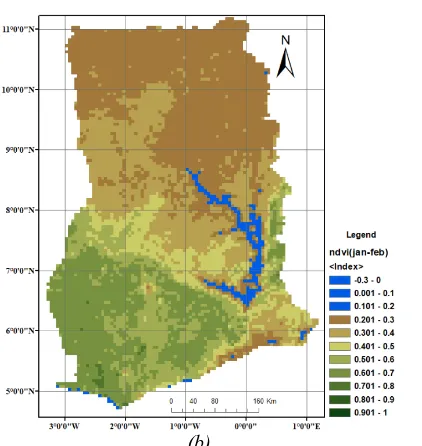
Figure 2: Spatial distribution of LST (a) and NDVI (b) for Ghana for January-February season
Figure 2 represents the first dry-season ( January-February) of every year in Ghana. During this time of year, as depicted by Figure 2 surface temperature in the northern sector of Ghana records land surface temperature readings between 310K and 320K (36.8℃ and 46.8℃) and NDVI readings around this time ranges between 0.20 and 0.41. This phenomenon is mainly due to the dominating savannah vegetation found in these parts of the country, which have a very high response to the availability of water and increasing temperature. The savannah grasslands in these areas lose their greenness in the presence of extreme temperature and low rainfall. As a result, low NDVI and high LST is recorded in the northern part of the country around this time of the year. The middle portions of Ghana down to the south-western part of the country around this time also records between 307K and 297K (33.8℃ and 22.8℃) as land surface temperature readings and between 0.40 and 0.70 for NDVI. The extreme south-eastern corner of the country at this time of the year recorded around 304K (30.8℃) and 312K (38.8) for surface temperature and 0.20 and 0.50 for NDVI.
(a)
(b)
Figure 3: Spatial distribution of LST (a) and NDVI (b) for Ghana for March-April-May season
Figure 3 demontrates the spatial variability of LST and NDVI from March to May. By this time of year, rainfall have begun in the southern parts and the mid-portions of the country. This is accompanied by increase in NDVI value as a result of fresh green leave sprouting from the vegetation vegetation types. Land surface temperature for the southern parts reads between 298K and 307K (24.85℃ and 33.85℃) around this time of year and NDVI records between 0.50 and 0.90. The northern part of the country at this time records between 0.20 and 0.40 in NDVI values and between 310 K and 320K (36.8℃ and 46.8℃) for surface temperature.
Page 376 www.ijiras.com | Email: [email protected]
(b)
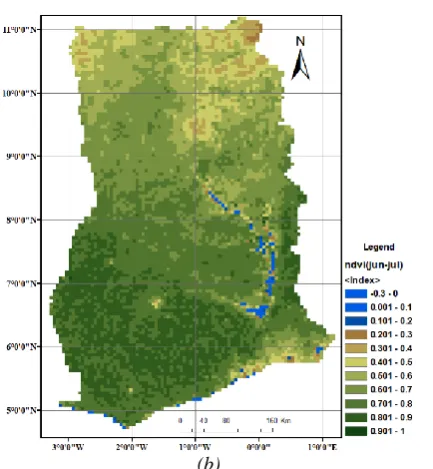
Figure 4: Spatial distribution of LST (a) and NDVI (b) for Ghana for June-July season.
By June-July all parts of the country is experiencing a fair amount of rainfall as a result, surface temperatures reduces and NDVI increases values. By this time the northern parts of the country records NDVI values between 0.30 and 0.7.
The southern and mid portions of the country records between 0.50 and 0.90 in NDVI values. In terms of surface temperature, the northern portions of the country record between 302K and 316K (28.85℃ and 42.85℃) and the mid portion to the southern parts of the country recorded between 301K to 296K (27℃ to 22.8℃).
(a)
(b)
Figure 5: Spatial distribution of LST (a) and NDVI (b) for Ghana for the months of August
In the months of August, it is still raining in the northern part of the country and there is a briesf pause in rainfall in the southern and mid portions of the country. This is characterised by the great improvement in the vegetation grow and the low surface temperature records. The NDVI records ranges between 0.401 and 0.90 in the northern part and between 0.50 to 0.90 in the southern parts of the country (as depicted by
Figure 5).
Page 377 www.ijiras.com | Email: [email protected]
(b)
Figure 6: Spatial distribution of LST (a) and NDVI (b) for Ghana for September-October season
By the September-October season (Figure 6) rainfall in the south have resume from its short break surface temperature is generally low and NDVI is at its highest during this time all through the country.
(a)
(b)
Figure 7: Spatial distribution of LST (a) and NDVI (b) for Ghana for November-December season
November-December (Figure 7) marks yet another period of dryness throughout the country. Surface temperature at this time reads between 310K to 317K (36.85℃ and 43.85℃) for the north, 304K to 309K (30.85℃ and 35.85℃) for the mid-portions and 299K to 304K (25.85℃ and 30.8℃) for the south. At this time there is a drastic decrease in vegetation greenness due to and increase in surface temperature. The north record NDVI values ranging 0.20 to 0.50, the mid portion records 0.4 to 0.70, the Volta region records 0.60 to 0.80 and the south-western corner records 0.60 to 0.90.
B. TIME SERIES ANALYSIS
To better understand the temporal relationship between LST and NDVI, time series analysis was performed for Ghana
on both national and regional scale, from January 2005 to December 2015.
Figure 8: Time series Plot of Land Surface Temperature and Vegetation for Ghana
Figure 8 shows the temporal distribution of Land Surface Temperature and Vegetation over Ghana from January 2005 to December 2015. Throughout the entire study period, a „crest‟
in vegetation plot coincides with a „trough‟ in the LST plot
and vice-versa. This demonstrates the fact that, on the national scale, low land surface temperature enhances vegetation greenness and high surface temperature hinders vegetation greenness.
Figure 9: Time series Plot of Land Surface Temperature and Vegetation for Northern Ghana
The time series plot of land surface temperature and vegetation for the northern part of Ghana (Figure 9), demonstrates that high surface temperature implies low vegetation greenness and vice-versa. From the graph, it can be deduced that highest NDVI values are recorded around September annually, and the lowest NDVI values are recorded between the months of January and February (by which time surface temperature records the highest annual values). This is the situation in all parts of the country.
Figure 10: Time Series Plot of Land Surface Temperature and Vegetation for the Southern Portions of Ghana.
Page 378 www.ijiras.com | Email: [email protected] dense tree canopies that maintain soil moisture all through the
year. There when energy is the limiting factor to vegetation growth, a rise in vegetation growth is noted at the presence of sunlight.
C. SPATIAL CORRELATION ANALYSIS
(a)
(b)
(c)
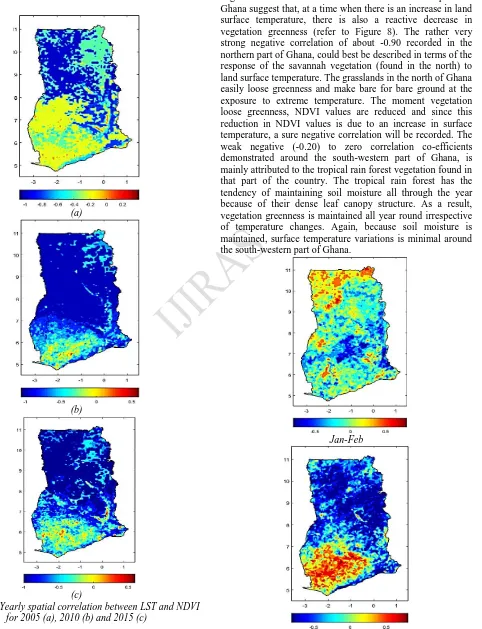
Figure 11: Yearly spatial correlation between LST and NDVI for 2005 (a), 2010 (b) and 2015 (c)
The yearly correlation analysis between surface temperature and vegetation demonstrated high negative (-0.90) co-efficient in almost all parts of Ghana except the southwestern part of Ghana where the correlation demonstrated a weak negative (0 to -0.2) correlation. The negative correlation co-efficient recorded in most parts of Ghana suggest that, at a time when there is an increase in land surface temperature, there is also a reactive decrease in vegetation greenness (refer to Figure 8). The rather very strong negative correlation of about -0.90 recorded in the northern part of Ghana, could best be described in terms of the response of the savannah vegetation (found in the north) to land surface temperature. The grasslands in the north of Ghana easily loose greenness and make bare for bare ground at the exposure to extreme temperature. The moment vegetation loose greenness, NDVI values are reduced and since this reduction in NDVI values is due to an increase in surface temperature, a sure negative correlation will be recorded. The weak negative (-0.20) to zero correlation co-efficients demonstrated around the south-western part of Ghana, is mainly attributed to the tropical rain forest vegetation found in that part of the country. The tropical rain forest has the tendency of maintaining soil moisture all through the year because of their dense leaf canopy structure. As a result, vegetation greenness is maintained all year round irrespective of temperature changes. Again, because soil moisture is maintained, surface temperature variations is minimal around the south-western part of Ghana.
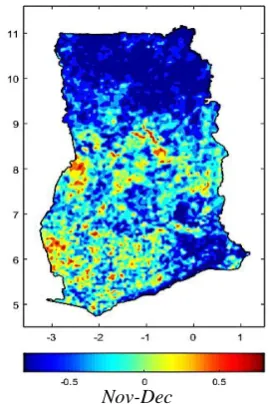
Page 379 www.ijiras.com | Email: [email protected] Mar-Apr-May Jun-Jul August Sep-Oct Nov-Dec
Figure 12: Seasonal spatial correlation plots between LST and Vegetation (from 2005 to 2015)
The seasonal spatial correlation analysis produced results suggesting a positive correlation between 0.2 and 0.4 for the north-western part of Ghana during the Jan-Feb season. The remaining part of the country recorded correlation co-efficients between -0.60 and +0.30 during the Jan-Feb season. During the March-April-May season throughout the study period, the south-western part of Ghana demonstrated a positive correlation (between 0.1 and 0.6) for surface temperature and vegetation. All other parts the country demonstrated negative correlation of about -0.60.
During the period of August and the September-October
season, the correlation ranges between -0.6 and 0.5 all round the country. Around this time, it is raining all over Ghana so a positive correlation co-efficient could mean energy is the limiting factor to vegetation growth (greenness).
The November-December period is another dry period throughout Ghana, during which land surface temperature is high and rainfall is absent. Grasslands become bare grounds at this time, and threes (denser vegetation) shed-off some leaves so they reduce water loss through evapotranspiration. As a result, vegetation greenness is reduced and NDVI values also reduces. Therefore, a reduction in one parameter coinciding with an increase in the other can only produce a negative correlation.
D. TEMPORAL CORRELATION ANALYSIS
TEMPORAL CORRELATION CO-EFFICIENTS
REGION 2005 2006 2007 2008 2009 2010 2011 2012 2013 2014 2015
Ashanti
0.04 -0.72 -0.60 -0.17 -0.56 -0.73 -0.17 -0.27 -0.50 -0.41 -0.38 Brong - Ahafo
-0.76 -0.88 -0.82 -0.57 -0.86 -0.87 -0.56 -0.59 -0.79 -0.87 -0.54 Central
-0.24 -0.78 -0.38 -0.22 -0.09 -0.55 -0.05 -0.20 -0.20 -0.61 0.12 Eastern
0.34 -0.76 -0.34 -0.27 -0.27 -0.30 -0.14 -0.27 -0.19 -0.38 -0.34 Greater Accra
0.12 -0.58 0.07 0.06 -0.19
-0.03
-0.12
0.48 0.38 -0.13
0.37
Northern
-0.29 -0.75 -0.67 -0.65 -0.58 -0.77 -0.56 -0.76 -0.52 -0.70 -0.69 Upper East
-0.55 -0.82 -0.86 -0.85 -0.86 -0.91 -0.87 -0.88 -0.87 -0.87 -0.82 Upper West
-0.56 -0.91 -0.76 -0.82 -0.73 -0.80 -0.85 -0.80 -0.74 -0.90 -0.90 Volta
0.15 -0.44 -0.63 -0.27 -0.69 -0.42 -0.52
0.20 -0.48
-0.39
-0.15
Western -0.13 -0.49
-0.05 -0.53 -0.08 -0.63 -0.12 -0.12 -0.06 -0.41 0.29
Page 380 www.ijiras.com | Email: [email protected] The temporal correlation analysis results presented in
Table 1 displays a positive correlation all through the study period for the three regions north (the Northern, Upper East, and Upper West regions) of Ghana. This is mainly due to the fact that the area is dry and the savannah vegetation found is these areas, easily gives way to bare ground at the presence of extreme surface temperature. Although some regions in certain years land surface temperature correlated positively (but weakly), it is a rare case scenario which could be interpreted as a case where energy (land surface temperature) was the limiting factor to vegetation growth.
IV. CONCLUSIONS
On the objective of examining the relationships between Vegetation Cover and Land Surface Temperature, It was observed that;
Vegetation and surface temperature correlated negatively throughout Ghana except for the year 2005 where the co-efficient of spatial correlation recorded between 0 and 0.4 in parts of Ghana. The strong negative correlation between surface temperature and vegetation recorded in the north was attributed to the fact that the vegetation in northern Ghana is predominantly savannah, which is very responsive to changes in rainfall and surface temperature. Western Region recorded the greenest vegetation cover
(in terms of NDVI values) and the lowest surface temperature variability, the region also recorded spatial correlation co-efficients ranging between 0 and 0.3 (representing a weak positive correlation) between Land Surface Temperature and Vegetation.
REFERENCES
[1] AQUASTAT survey (2005). Irrigation in Africa in Figures. www.fao.org/GHA/GHA_CP_eng
[2] Ban, H. Y., Kim, K. S., Park, N. W., and Lee, B.W. (2017). Using MODIS Data to Predict Regional Corn Yields. REMOTE SENSING, 9(1), 16. doi: 10.3390/rs9010016.
[3] Brown J. F. (2015) https://phenology.cr.usgs.gov/ndvi_ foundation.php [Accessed March, 2017]
[4] Chen S. S., Chen X. Z., Chen W. Q., Su Y. X., and Li D. (2011). A simple retrieval Method of land surface temperature from AMSR-E passive microwave data – a case study over Southern China during the strong snow disaster of 2008. International Journal of Applied Earth Observations and Geoinformation 13: 140–151.
[5] Didan, K. (2015). MOD13C2 MODIS/Terra Vegetation Indices Monthly L3 Global 0.05Deg CMG V006 [Data
set]. NASA EOSDIS LPDAAC. doi.
10.5067/MODIS/MOD13C2.006.
[6] Didan, K., Munoz, A. B., Ramon and Huete, S. A. (2015). MODIS Vegetation Index User‟s Guide.: California. [7] Leilei L., Jianrong F. and Yang C. (2014). The
relationship analysis of vegetation cover, rainfall and land surface temperature based on remote sensing in Tibet, China. Conf. Ser.: Earth Environ. Sci. 17 012034. http://iopscience.iop.org/1755-1315/17/1/012034.
[8] Lillesand, T. M., Kiefer, R. W. and Chipman, J. W. (2004). Remote Sensing and Image Interpretation (5th edition). U.S.A.: John Wiley & Sons, Inc.
[9] Wan, Z., Wang, P. and Li, X., (2004). Using MODIS land surface temperature and normalized difference vegetation index products for monitoring drought in the southern Great Plains, USA. International Journal of Remote Sensing, 25(1), pp.61-72.
[10] Wang, K., Liu Qiang and Liu Qinhuo, 2010. Localized land surface temperature retrieval from the MODIS level 1B data using water vapor and in situ data, Geoscience and Remote Sensing Symposium, (IGARSS): 2252-2254. [11] Wan, Z., Hook, S. and Hulley, G (2015). MYD11C3
MODIS/Aqua Land Surface Temperature/ Emissivity Monthly L3 Global 0.05Deg CMG V006 [Data set].
NASA EOSDIS LP DAAC.
doi.10.5067/MODIS/MYD11C3.006.
[12] World Book Encyclopedia, Millennium 2000 standard edition, 1999. “Climate”
[13] World Book Encyclopedia, Millennium 2000 standard edition, 1999. “Ghana”
[14] Zewdie, W; Csaplovics, E; Inostroza, L (2017). Monitoring ecosystem dynamics in northwestern Ethiopia using NDVI and climate variables to assess long term trends in dryland vegetation variability. APPLIED
GEOGRAPHY, 79, 167-178.