International Journal of Engineering & Technology IJET-IJENS Vol:15 No:06 42
155006-9191-IJET-IJENS © December 2015 IJENS
Efficient Soil Moisture Measurement Using
Microwave Surface Reflection Method
Yap C.W. *, Mardeni R. **, N.N.Ahmad**
*School of Engineering, Asia Pacific University of Technology and Innovation, Malaysia. **Faculty of Engineering, Multimedia University,63100, Cybejaya, Selangor, Malaysia.
Abstract-- Soil moisture determination is critical as the parameter affects the physical and characteristics of soil in civil, geological and agricultural industry. However, effective non-destructive model for accurate soil moisture determination is challenging to be discovered. In this article, the concept and development of soil moisture determination via ground penetrating radar (GPR) principle is explained. The system is designed to be used with standard horn antenna with a sweep frequency of 1.7 – 2.6GHz along with vector network analyzer (VNA). The proposed system can determine soil moisture of three types of soil samples such as sand, loamy, and clay with high degree of accuracy. In this work, microwave surface reflection method is applied to analyze the effect of soil moisture with its electrical properties using GPR principle. The result of the research is promising with high percentage of agreement with Topp theoretical value. The highest values are 61% 42% 54% for sand, clay and loamy, respectively. For system validation, a new soil type is used for measurement, and the result has an accuracy of 93%. By using the proposed developed models, soil moisture estimation can be determined with minimal data input through a novelty GPR principle.
Index Term-- Ground-penetrating-radar, microwave, radio wave, soil moisture, surface reflection
1. INTRODUCTION
Immense growth in radar technologies has increased its role in a variety of fields, and ground penetrating radar (GPR) is seen to gain tractions for increasing applications. Ground penetrating radar (GPR) principle has been widely employed in non-destructive tests (NDT) for a variety of fields [1]. The relationship of soil physical and electrical characteristics are often discussed by some researchers and these properties contributed in many aspects of structure estimation [2].
However, results often associated with drawbacks. Other researchers proposed a study of GPR measurement that relates density and attenuation of road pavement slabs, a frequency range of 1.7-2.6 GHz. The experiment was constructed using a signal generator, spectrum analyzer, directional coupler with adapter and a horn antenna [3]. But the drawback of the study was that soil moisture cannot be determined.
Jusoh studied the moisture content in mortar at near relaxation frequency, and developed an equation from the study [4], and parameter water content and attenuation with mortar is correlated. But, the drawback of the research is that it is simple and soil characterization overlooked and not
considered a variable in equation [4]. At another study, permittivity of a material is determined using a network analyzer connected to a GPR antenna and a resonator, but the drawback is that they are not able to characterize the sample permittivity [5]. Another current commonly used methods of soil moisture measurement is coring, which involved physical removal of soil from the ground [1], [3]. After removing soil from the ground, the soil is brought to the lab for moisture measurement. Unfortunately, coring is time-consuming and destructive to the ecosystem.
The study presented here is to investigate a better alternative to measure soil moisture via radio wave reflection method. In this article, we proposed a soil moisture model which gives a faster moisture estimation that can benefit agricultural surveyors performing routine soil moisture test. We are expecting to enable in-situ soil moisture measurement without damaging the soil ecosystem.
2. ELECTROMAGNETIC PROPERTY OF SOIL
Electromagnetic property of soil is another critical area to be assessed. Each soil type possesses unique characteristics such as permittivity, permeability and conductivity [6]. These characteristics are widely research as they influence moisture measurement. As with standard research methods, this study limits to permittivity determination. The notion of the work is that theoretical value of soil moisture is developed as a benchmark for the measurement result performed in the lab. This can be completed via comparing the result with nominal range of permittivity and development of electromagnetic method for radar.
2.1. Nominal Range of Return Loss
The nominal range for different soil of sand, loamy, and clay soil are investigated. Loamy soil and clayey soil has the closest relative dielectric constant or permittivity, which is in between 3 – 30. The relative dielectric constant of sandy soil is on the upper range which is in between 10 – 30. These permittivity data with corresponding return loss are used as a benchmark for the study [7].
2.2. Theoretical Estimation
International Journal of Engineering & Technology IJET-IJENS Vol:15 No:06 43
155006-9191-IJET-IJENS © December 2015 IJENS
GPR. Hence the theoretical method of soil moisture is derived from TDR method. In 1980, prominent researcher Topp and his team conducted a study via electromagnetic method and developed a formula to correlate soil water content with permittivity. The experiments were completed in laboratory where samples were positioned in a coaxial transmission line and the complex dielectric permittivity were determined from dry soil up to saturated condition. Empirical model of soil moisture content in terms of dielectric permittivity was introduced and expressed as (1) and (2) [8].
v= -5.3 × 10⁻² + 2.92 × 10⁻² - 5.5 × 10⁻⁴
+ 4.3 × 10⁻⁶(1)
= 3.03 + 9.3v+ 146.0v2 + 76.7v3 (2)
where ε represents real part of complex relative permittivity and θv represents volumetric water content.
Rearranging (1) for permittivity provides us with (2), which is known as the standard Topp equation [8].
Researcher Hallikainen had further the research and proposed a polynomial equation that correlates water content and permittivity, with the addition of a new variable soil type [9].
= (a0 + a1S + a2C) + (b0 + b1S + b2C)v + (c0 + c1S + c2C)v2
(3)
where a, b, and c are polynomial coefficients, S is sandy ratio and C is clay ratio. In the study, soil types have shown that dielectric permittivity changes significantly in the lower frequency range, particularly between 1.4GHz to 5GHz. According to the study, the permittivity at 1.4GHz is represented with polynomial coefficients as (4) and (5).
' = (2.862 – 0.012S + 0.001C) + (3.803 + 0.462S – 0.341)v +
(119.006 + 0.5S + 0.633C)v2 (4)
” = (0.356 – 0.003S – 0.008C) + (5.507 + 0.044S – 0.002)v
+ (17.753 – 0.313S + 0.206)v2 (5)
where ε’ and ε” are respectively the real part and imaginary part of complex dielectric permittivity. In this work, Topp and Hallikainen equations are used as a benchmark for the result. These equations will be correlated with the return loss, and integrated with the measurement using GPR principle.
Permittivity obtained from Topp Equation (2) and Hallikainen Equation (3) are derived further with GPR method. In the investigation of thin layers in concrete using reflection of GPR signals and pulse lengths where the wave travels from air to the material, the permittivity of a material, ɛ can be estimated in the expression of reflection coefficient, Γ by using (6) [1].
1 1
2 2
(6)
In this study, the equipment setup is conducted in the frequency of 1.7GHz to 2.6GHz. This range is within the microwave frequency range of 300MHz to 300GHz, where return loss can be correlated to reflection coefficient by (7).
RL = -20 log|| (7)
Following these equations, permittivity of a material can be converted to return loss. Through the derivation, permittivity from (2) and (3) can be expressed in terms of return loss. The theoretical determinations are then compared with the measurements from this work.
3. METHODOLOGY
This proposed study was implemented by investigating the properties of soil samples, collecting data from laboratory experiments, performed analysis and integrated the result with existing research.
3.1. Properties of Soil Sample
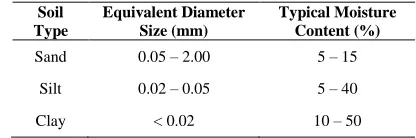
In this study, three types of soil were determined as samples in the lab experiment. The typical moisture content for three types of soil are also shown in Table 1, where moisture content, w, is the ratio of weight of solids (g) to weight of water (g) in percentage [7].
Table I
Units for Magnetic Properties Soil Texture Classification of Soil Samples with Equivalent and Typical Moisture Content
Soil Type
Equivalent Diameter Size (mm)
Typical Moisture Content (%)
Sand 0.05 – 2.00 5 – 15
Silt 0.02 – 0.05 5 – 40
Clay < 0.02 10 – 50
3.2. Soil Characterization
In this study, soil samples are selected and prepared through characterization process. Soil samples determined are clay, sand, and loamy, as these three types of soil are the standard for various different soil composition.
Soil samples are collected and prepared as laboratory test objects. The samples are weighed before drying, as the drying process takes 24 hours in the oven at 110oC per British Standards [10]. After drying, the soil is weighed and the moisture content are determined with (8).
(8)
where v is volumetric soil moisture, Vwater is the water
content, Vtotal is the total volume content including soil
volume, water volume and air volume.
After drying process, soil samples prepared is settled for soil characterization. In electromagnetic approach, soil
total water v
V
V
International Journal of Engineering & Technology IJET-IJENS Vol:15 No:06 44
155006-9191-IJET-IJENS © December 2015 IJENS
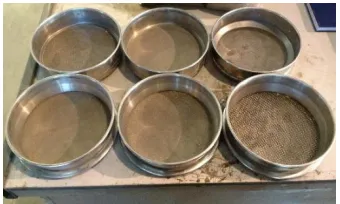
dielectric models are used to relate physical characteristics of soil with its electrical properties. In this study, the soil physical parameters are to be determined before experiment is conducted. Physical parameters of soil types are determined using sieve test analysis method as approved [10].
The sieving process uses different screen size of sieve containers as shown in Fig. 1. In this process, samples are placed in the top of the stacked sieve containers. The sieve containers are arranged as the containers with the largest screen size stays at the top and the finest screen size stays at the bottom. The stacked containers are placed in the sieve shaker for 10 minutes. During the sieving process, the coarse particles remain at the top and progressively to the finest particles at the bottom. The particles collected at each stage is weighed and the percentage of clay and sand is determined.
Fig. 1. Sieve containers of different mesh sizes are used for soil characterization.
Result of the sieving analysis is collected and analyzed and soil components are categorized and shown in Table II.
Table II
Result for Soil Characterization
Soil Type Clay (%) Sand (%) Silt (%)
Sand 0.02 0.96 0.02
Clay 0.5 0.37 0.13
Loamy 0.08 0.84 0.08
Referring to Table II, sand sample contains 96% of sand per classification, while clay sample contains 37% of sand and 5% of clay. Loamy soil contains 84% of sand and 8% of clay. This shows a diverse sample of soil components within the soil samples.
4. MEASUREMENT SETUP
In this work, the experiment is summarized in Fig. 2. The length, width and thickness of the glass container are 0.4m, 0.6m and 0.8m, respectively. Also, h is the soil thickness and d = 0.3m is the distance from antenna to the soil surface. The antenna height and sample surface area are calibrated and optimization is performed in order to comply with GPR setup requirement.
The objective of the experiment is to obtain the soil return loss in dB for each step of soil moisture. The data
measured isused to propose a new soil moisture model. The setup and experiment procedure are followed.
The experiment is conducted in a laboratory with horn antenna, vector network analyzer (VNA), N-type cable, glass container, soil samples and metal sheet. VNA used is manufactured by Agilent Technologies, model E5062A. The VNA operates in the range of 300kHz – 3GHz, and support the horn antenna operates in the range of 1.7GHz to 2.6GHz. The equipment setup is shown in Fig. 2, the setup is arranged with distance determined and components placed according to the GPR principle.
Fig.2. Lab measurement setup with standard horn antenna, antenna frame, soil samples, metal plate and VNA.
5. RESULTS ANALYSIS
As the soil sample is prepared, the experiment is performed in steps. For every step, 250cm3 of water is added to the soil sample and water volume percentage is calculated. Return loss is measured from the VNA and normalized return loss is determined. Normalized result only accounts for the changes in soil moisture with all other variables such as air to sample distance, cable and antenna impedance being constant.
Fig. 3. Plot of graph for normalized return loss in comparison with Topp and Hallikainen theoretical values.
From Fig. 3, it is shown that return loss decreases as water content increases. Topp and Hallikainen curves
VNA Fram
ee
Soil Sample
Horn Antenna
International Journal of Engineering & Technology IJET-IJENS Vol:15 No:06 45
155006-9191-IJET-IJENS © December 2015 IJENS
generally agree with each other within a range of 10%. The measurement of the soil, in particular loamy soil follows the curve but at a lower return loss. This is due to the different composition of soil that was used. The measurements of the three types of soil are shown in the polynomial equations (9) – (11). In these equations, return loss is expressed in terms of volumetric moisture. For example, in (9), return loss of sand, RLsand is expressed in terms of volumetric moisture, v. This
notation is followed by the subsequent equations.
RLsand= -819.6v3 + 216.3v2 – 129.5v + 4.224 (9)
RLclay= -821v3 + 339.5v2 – 47.59v + 7.702 (10)
RLloamy= -530.1v3 + 270.2v2 – 51.88v + 6.759 (11)
In order to observe the agreement between theoretical data and measurement, the errors against theoretical value of Topp and Hallikainen are calculated. Clay has the smallest error 4.93% to 42.01% when compared to Topp theoretical values; and 12.75% to 47.56% when compared to Hallikainen theoretical values. Sand has the largest error in comparison to both Topp and Hallikainen values, which are 31.21% to 63.96%, and 38.09% to 66.93% respectively.
Practical approach is developed to measure volumetric moisture in realistic environment where composition of the soil is unknown. In this scenario, further work is conducted to develop a General Equation that encompasses all soil types. Return Loss, RL is plot against Volumetric Moisture, v for measured data on loamy, sand and
clay. General Equation is formulated, based on the best-fit curve on the measured data as shown in (12). In this equation, return loss of General Equation, RLGen Eqis expressed in terms
of volumetric moisture, v.
6. MODEL OPTIMIZATION
Further study is conducted to optimize theoretical Topp and Hallikainen curves into the General Equation to improve the exisiting method and model for future engineering purposes. General Equation, Topp curve and Hallikainen curve are formed as cubic polynomial equations as shown in (13) - (15).
y= ax3 + bx2+ cx + d (13)
RLTopp= 29v3 + 50v2 – 41v + 12 (14)
RLHallikainen= 0.02v3 – 0.38v2 – 30v + 12 (15)
where a, b, c, and d are the polynomial coefficients of corresponding equations. For example, polynomial coefficient a, of Topp curve is 29, whereas polynomial coefficient b of Hallikainen curve is -0.38. RLTopp and RLHall represents return
loss of Topp curve and return loss of Hallikainen curve
respectively, expressed in terms of volumetric moisture, v. In
polynomial equation, polynomial coefficient determines the characteristics of the curves. Optimization process beginsfrom the source, which is the Topp curve or Hallikainen curve, and iterated to General Equation [11]. Five iterations are performed to transform the theoretical curves into General Equation. Each step of iteration is determined with progressive polynomial coefficient as shown in (16) - (18).
(16) ym|Topp= (aTopp + am,Topp)x3+ (bTopp + bm,Topp)x2 + (cTopp +
cm,Topp)x + (dTopp + dm,Topp) (17)
ym|Hall= (aHall +am,Hall)x3+ (bHall + bm,Hall)x2 + (cHall + cm,Hall)x +
(dHall + dm,Hall) (18)
where n is the total number of iterations and m represents each step of the iterations. In this optimization, there are five iterations, thus n = 5 and m ranges from 1 to 5. Iterations in steps are essentially represented by ym, which is defined by
individual polynomial coefficient in m steps, where ym|Topp are
iterations for Topp curve and ym|Hallare iterations for
Hallikainen curve.
Fig.4. Topp curve optimized to General Equation with a series of iterations. m
n a a
amTopp GenEq Topp
International Journal of Engineering & Technology IJET-IJENS Vol:15 No:06 46
155006-9191-IJET-IJENS © December 2015 IJENS
Fig. 5. Hallikainen curve optimized to General Equation with a series of iterations.
The process is repeated for iterations on Hallikainen curve with (18). The optimization result are as shown in Fig 4 and Fig 5. Referring to the figures, iteration 5 becomes the General Equation. Hence optimization is completed.This adds to the novelty of this work compared to the existing studies.
7. MODEL VERIFICATION
Three soil types are developed with mixed sand and loamy soil, mixed loamy and clay soil and mixed sand and clay soil. These new samples undergo the consistent procedure for volumetric moisture determination. Result from Fig. 6 shows that volumetric moisture measurement is within the range of new equation. General Equation is verified to operate with allowable error. Prefix M in the legend represents measured data.
Fig. 6. The study is repeated with 3 new soil types developed with mixed soil from clay, loamy and sand.
The performances of the return loss were measured and compared to the General Equation. New soil type agrees well with the General Equation. From the soil with less than 21.31% volumetric moisture, the corresponding error is less than 7%. This verifies that the model works with other general soil types.
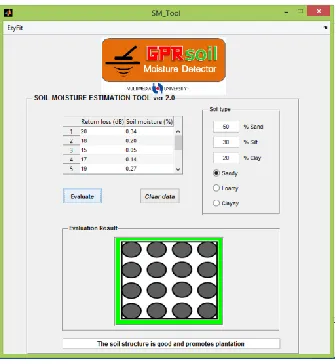
The verified model is developed into a Graphical User Interface (GUI) with MATLAB platform as shown in Fig. 7. In this GUI, the user inputs return loss indicated from GPR device and soil moisture is determined per model. It cross references with the type of soil and determines bulk density. The bulk density is referred for the suitability for agriculture activity [12].
Fig. 7. GUI developed in MATLAB platform with model of the General Equation for soil moisture determination.
Further work is to be performed on site. However, setting up the equipment outdoor requires protection to the equipment such as horn antenna, VNA, computer and cabling. These equipment are sensitive to heat and humidity and the protection is challenging and costly. Also, as composite layers presents challenging environment for soil moisture measurement. Hence, more work needs to be done to study the soil moisture in this scenario.
8. CONCLUSION
International Journal of Engineering & Technology IJET-IJENS Vol:15 No:06 47
155006-9191-IJET-IJENS © December 2015 IJENS
researchers who wish to evaluate soil moisture using the same parameters discussed in this article. The novel feature that contributes is the development of the soil moisture equation as an application of non-destructive technique for future engineering applications.
REFERENCES
[1] D. Daniels and M. Skolnik, Radar Handbook, 3rd Ed. USA: McGraw Hill, 2008.
[2] D.J. Daniels et al., “Introduction to subsurface radar,” IEEE Proceedings, vol. 135, no. 4, 1988.
[3] J.R. Leon Peters et al., “Ground penetrating radar as a subsurface environ-mental sensing tool,” IEEE, 1984.
[4] M.A. Jusoh et al., “Determination of moisture content in mortar at near relaxa-tion frequency 17GHz,” Measurement Science Review, vol. 11, no. 6, pp. 203-206, 2011.
[5] R.S.A Raja Abdullah et al., “Evaluation of road pavement density using ground penetrating radar,” Journal of Environmental Science and Technology, vol. 2, no. 2, pp. 100-111, 2009.
[6] A. Tarantino, M.A. Ridley, and G.D. Toll, “Field measurement of suction, water content, and water permeability,” Laboratory and Field Testing of Unsaturated Soils, pp. 139-170, 2009.
[7] S. Ahmed Turk, A. Koksal Hocaoglu, and A. Alexey, Vertiy: Subsurface Sensing, Wiley, pp. 62, 2011.
[8] G..C. Topp, J.L. Davis, and A.P. Annan, “Electromagnetic determination of soil water content: measurements in coaxial transmission lines,” Water Resources Research, vol. 16, no. 3, pp. 574– 582, 1980.
[9] T.M. Hallikainen et al., “Microwave dielectric behavior of wet soil – part I: mod-els and experimental observations,” IEEE Transactions on Geoscience and Remote Sensing, GE-23(1), pp. 25-34, 1985.
[10] British Standard Institution. British standard methods of test for soils for civil engineering purposes: part 2: classification tests. London: BSI., 1990.
[11] Kaltofen, Erich, Zhengfeng Yang, and Lihong Zhi, “Approximate greatest common divisors of several polynomials with linearly constrained coeffi-cients and singular polynomials,” Proceedings of the 2006 International Sympo-sium on Symbolic and Algebraic Computation, ACM, pp. 169-176, 2006.
[12] USDA, Soil quality indicators. USDA Natural Resources Conservation Ser-vice.[online]
http://www.nrcs.usda.gov/Internet/FSE_DOCUMENTS/nrcs142p2_053 256.pdf <Accessed 15 Febaruary 2015>, 2008.
BIBLIOGRAPHY OF AUTHORS
Yap Chee Wei received the B.Eng. and M.Eng from the University of Arkansas at USA. After his studies, he worked as a manufacturing engineer at an aluminum extrusion company at USA. With industrial experience, he has attained PE from USA and CEng from the UK. He furthershis studies in Doctor of Philosophy in the field ofsensor and microwave engineering at Multimedia University, Malaysia. His research work in ground penetrating radar produces results in patent application and gold awards in engineering technology competition, ITEX14 and ITEX15.
Dr. Mardeni Roslee received his Masters degree in Telecommunication and Doctor of Philosophy in Communication Network Engineering from UPM, respectively. He is a Chartered Engineer awarded from UK. He has been a faculty member at the Multimedia University, Malaysia from 2008 until now. He is a Senior Member of IEEE, USA, Senior Member of IACSIT, Singapore, and member of IET, UK. His current research interests are wireless and mobile communication with radar system. He has published over 49 international journal and conference papers. He has been involved in organizing a number of conferences including APWBF09, AFICT09, PIERS12, ISTT12 and MICC13. He has won some international research competitions including ITEX15, ITEX14, ITEX13 and PRPI09. He has 12 graduated postgraduate students in Masters and PhD. He has research grant amounting USD273,000.