e-ISSN: 2278-067X, p-ISSN: 2278-800X, www.ijerd.com
Volume 13, Issue 10 (October 2017), PP.71-79
Optimization of Short-Term Traffic Count Plan to Improve
AADT Estimation Error
YooSeok Jung
1, *JuSam Oh
212Korea Institute Of Civil Engineering And Building Technology, 283, Goyangdae-Ro Goyang-Si, Korea.
Corresponding Author: *JuSam Oh
ABSTRACT:
Due to limitation of budget, it is very limited that counting a traffic volume for 365 days for every sections of the road. In order to compensate, short-term count is applied. Usually once (24 hours) a year, the large AADT estimation error can be occurred. Establish an efficient survey plan to minimize AADT estimation error, the characteristics of the survey site is defined and appropriate number of count is proposed according to the characteristics.The characteristic of the section of road section is defined as COV (coefficient of variation) of the monthly correction factor. The data is sampled among ATR(Automatic traffic recorder)’s 356 day traffic data to show AADT estimation error. The AADT estimation error was calculated when the monthly and the weekly correction factor were applied. The AADT estimation error according to the survey season was considered as well.For the AADT estimation error of less than 10%, 2-count are recommended for the COV of the monthly correction factor is 15.5% or more. In addition, 3-count are recommended for 21.2% or more. In case of corrected with monthly correction factor and weekly correction factor, 2-count is expected for higher that 18.2% of COV of monthly correction factor.As the number of counts increased, the AADT estimation error decreased. Although the AADT estimation error is larger as the traffic volume change at the road section is larger, the estimation error reduction is also greater as the number of count increases. Almost all of the road sections satisfied the estimated error criterion within 10% in three investigations. Especially the winter is the season that has the greatest influence on the traffic volume count. Therefore, it is necessary to avoid the investigation at winter or estimate the AADT using the monthly correction factor.Keywords: AADT estimation error, Short-term traffic count, Regression analysis, traffic monitoring plan
I.
INTRODUCTION
In South Korea, national scale traffic counts have been conducted since 1955, short-term traffic counts and permanent traffic counts have been carried out in parallel for national highways since 1985. The traffic in all road sections are counted by considering a large section with a road section between junctions where a national highway and a national highway meet or between junctions where a national highway and expressway meet and considering a small section with a section between junctions where local roads or major city/town roads meet. At the 796 short-term traffic road sections, the traffic is measured for 24 h once a year, and the annual average daily traffic (AADT) is estimated; these data contain errors according to sample count. Particularly, because the traffic volume level of the counting position changes according to the characteristics of the road, errors occur according to AADT estimation, and it is difficult to accurately reflect the actual traffic level. In addition, it is difficult to increase the count frequency owing to limitation of budget and human resources. Therefore, a method to establish an effective short-term traffic count plan by determining an appropriate count frequency in accordance with the characteristics of counting position is necessary. If the short-term traffic count plan is established by changing the count frequency according to the traffic volume characteristic of counting position, more effective and precise traffic count result will be obtained.
In this study, AADT estimation errors by count frequency were analysed by using 365 daily traffic volume data values obtained through the permanent count. The characteristics of the counting position were defined by the MF(monthly factor) and WF(weekly factor), and corresponding samples were selected from 365 daily traffic volume values. An effective count plan could be established according to the characteristics by confirming the errors by positions at different count frequencies.
II.
BACKGROUND
urban areas and 7 days count in rural areas [4]; in New York state, the count is performed in 15 min units in urban areas and 1 h units in rural areas [5]. This means that different count plans have to be applied according to the traffic volume characteristics of road sections.
The earlier studies have been carried out for classifying road sections by traffic volume characteristics to minimize the errors occurring when estimating AADT through short-term traffic count. Various methods of estimating AADT have been considered.For example, a method of considering the seasonal factor in the conventional process of estimating AADT [6]. A method of estimating AADT by using the Poisson model [7]. A study considering the effects of weather, bicycles, and pedestrians [8]. A study for reasonable grouping by using past traffic volume patterns to estimate AADT [9] and a method of classifying road sections according to characteristics by using a neural network method [10, 11] or cluster analysis [12]. The studies have proposed a method for reducing the error by classifying the road section and establishing an effective short-term traffic count plan.
The precision of AADT estimation increases as the number of traffic counts increases. At 95% confidence level, the error decreased from 8% of two counts to 4.50% and 3.61% at 3 counts and 4 counts, respectively [13]. In another study stated that as the COV (Coefficient of Variance) for traffic volume increases, the AADT estimation error increases. The road section having less than 20% COV has less than 10% error. Further, the error that can be reduced by increasing the count frequency is less than 1% and proposed performing traffic counts twice a year [14]. According to these study results, it can be seen that increasing the number of count is helpful for reducing AADT estimation error. However, because there is a limitation in increasing the count frequency owing to reasons such as budget, engineering decision-making is necessary for deciding the count frequency by position.
In this study, analysis was conducted for increasing the count frequency rather than using continuous counts such as 48 h and 72 h counts. The study was based on previous study results that suggested that if monthly and weekly corrections are done well, the estimation error will be less than 15% in the case of 24 h measurement. However short-term counts measured for 24 h or 48 h have to be replaced with seasonal measurements (Davis, 1997). Further, the idea that errors occurring at small measurement frequency increase as the variability of traffic volume increases, such as in the recreational route. The reduced error becomes large as the measurement frequency is increased was considered based on a study that compared ADT difference rates by measurement frequency according to road characteristics of commuter, rural, and recreational roads (Sharma and Allipuram, 1993). Based on this idea, the present study focused on a method of determining count frequencies and classifying road sections for large variabilities.
III.
METHODA. Traffic Data Collection
The short-term traffic count of national highways is conducted once a year by using a portable traffic volume-counting device from March to November in a year. After selecting weekdays (Tuesday, Wednesday, and Thursday) for traffic counts, the portable counting device was installed, and the traffic volumes were collected for 24 h or more. Locations (urban area and inner town) where movements of vehicles are within small sections were avoided, and positions where the proportions of vehicles passing through small sections were large were selected to show average traffic volume of the counting section. In principle, the locations of implemented road sections were not changed, but when the traffic volume was influenced by change in the road network, e.g., opening of detours in the vicinity, the position was changed to a location where traffic volume was not affected.
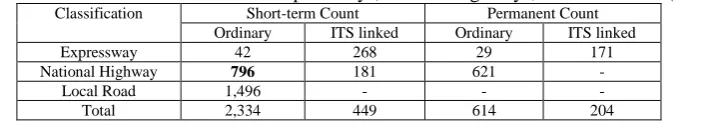
Table 1: Traffic count statements of expressways, national highways, and local roads (2014)
Classification Short-term Count Permanent Count
Ordinary ITS linked Ordinary ITS linked
Expressway 42 268 29 171
National Highway 796 181 621 -
Local Road 1,496 - - -
Total 2,334 449 614 204
Table 1 lists the number of traffic road sections in 2014. This study is limited to 1,598 positions on the national highways managed by the Ministry of Land, Infrastructure and Transport, and Korea Institute of Construction Technology; the main goal is to increase the counting efficiency by reducing the AADT estimation errors at short-term traffic road sections (796 positions).
B. Coefficient of Variation (COV)
to the MF showing monthly traffic volume trend, the characteristics of traffic volume can be shown, and whether the characteristic of the counting position is “commuter” or “recreational” can be expressed quantitatively. For example, it can be said to be closer to commuter if COV is low and closer to recreational if COV is high.
C. Evaluation measurement (MAPE)
In this study, errors were evaluated by using 2014 AADT when reducing the short-term counting section by using Mean Absolute Percentage Error (MAPE) shown in Equation 1 (Wang and Tsai, 2013).
Equation 1
Where, =a measured AADT through traffic count in section; = predicted AADT of section; and = total number of predicted AADT. The measured AADT difference obtained using 365-day data and the AADT predicted by using sample ADT were defined as the error.
IV. ANALYSIS
AND
RESULT
A. Determining the Independent variable
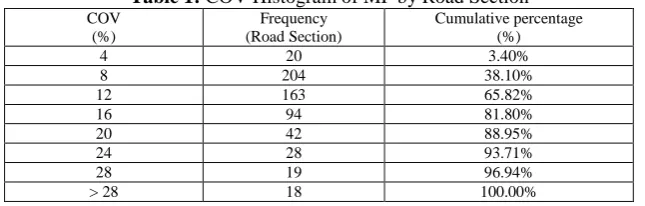
Error occurrences were checked according to traffic volume collection time, frequency, and variability. To establish an effective short-term traffic count plan, appropriate count frequencies should be set according to the characteristics of count positions; for this purpose, the following process was adopted. During collection of permanent counts, the MF and WF were calculated automatically to use them in the AADT estimation of short-term counts; they showed the variation characteristics of the counting position. Therefore, when showing a position’s monthly variability and weekly variability with the COV, each position’s MF and WF were used. Table 2 lists the frequency and cumulative percentage by class to compare the monthly variation factors of positions. More than half showed a COV of less than 12%, but the positions where the COV exceeded 20% accounted for more than 10% of the total.
Table 1: COV Histogram of MF by Road Section COV
(%)
Frequency (Road Section)
Cumulative percentage (%)
4 20 3.40%
8 204 38.10%
12 163 65.82%
16 94 81.80%
20 42 88.95%
24 28 93.71%
28 19 96.94%
> 28 18 100.00%
Table 2 lists the frequency and cumulative percentage by class of the COV of the WF showing weekly traffic volume changes. The frequency by class shows a trend similar to that of monthly variability.
Table 2: COV Histogram of WF by Road Section COV
(%)
Frequency (Road Section)
Cumulative percentage (%)
4 25 4.25%
8 281 52.04%
12 145 76.70%
16 68 88.27%
20 28 93.03%
24 21 96.60%
28 10 98.30%
> 28 10 100.00%
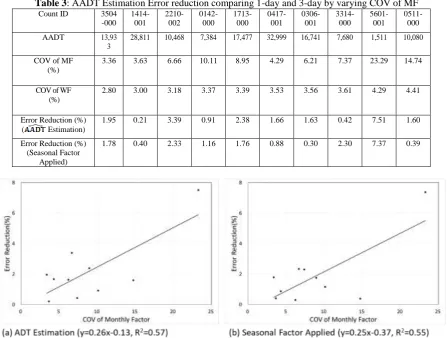
The error of each traffic volume was evaluated with the ten-time average. The error reduction according to COV of MF as shown in Table 3and Figure 1 indicates that as the COV of the MF increases, the error reduction effect according to the three-time measurements increases.
Table 3: AADT Estimation Error reduction comparing 1-day and 3-day by varying COV of MF
Count ID 3504
-000 1414-001 2210-002 0142-000 1713-000 0417-001 0306-001 3314-000 5601-001 0511-000
AADT 13,93
3
28,811 10,468 7,384 17,477 32,999 16,741 7,680 1,511 10,080
COV of MF (%)
3.36 3.63 6.66 10.11 8.95 4.29 6.21 7.37 23.29 14.74
COV of WF (%)
2.80 3.00 3.18 3.37 3.39 3.53 3.56 3.61 4.29 4.41
Error Reduction (%) ( Estimation)
1.95 0.21 3.39 0.91 2.38 1.66 1.63 0.42 7.51 1.60
Error Reduction (%) (Seasonal Factor
Applied)
1.78 0.40 2.33 1.16 1.76 0.88 0.30 2.30 7.37 0.39
Figure 1: Regression analysis of AADT Estimation Error reduction comparing 1-day and 3-day by varying COV of MF
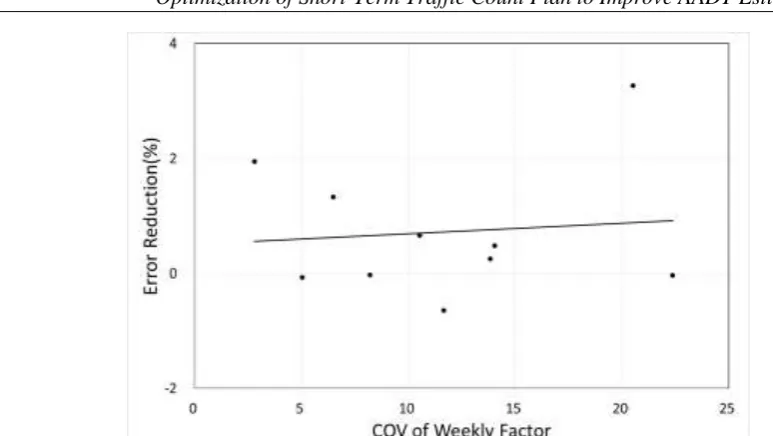
As shown in Table 4and Figure 2, the variability of the WF and the error reduction according to the increase in the measurement frequency are not related when the error reductions are shown by measuring once and thrice. By the method, same as that explained earlier for the road sections of traffic counts where the COV of the MF is controlled with a small value of 5% or less, and COVs of the WF are different from each other. Therefore, with respect to the characteristics of road sections for determining the traffic count plan, only the COV of MF has to be taken into consideration.
Table 4: AADT Estimation Error reduction comparing 1-day and 3-day by varying COV of WF
Count ID
0701-001 0134-000 1412-000 3504-000 5803-000 3802-000 0212-000 3801-004 0212-004 8201-004
AADT 39,091 42,440 32,365 13,933 4,864 44,367 27,453 32,419 6,315 32,289
COV of MF (%)
2.07 2.45 2.97 3.36 3.40 3.42 3.44 3.46 4.57 4.85
COV of WF (%)
5.03 8.20 6.48 2.80 13.84 10.53 11.66 14.05 22.38 20.52
Error Reduction (%) ( Estimation)
Figure 2: Regression analysis of AADT Estimation Error reduction comparing 1-day and 3-day by varying COV of WF (R2=0.01)
B. Analysis of AADT Estimation Error
Table 5 lists the averages of AADT estimation errors analyzed 10 times each by changing the 24-h ADT count frequency by using the positions (5 or less COV of WF) used in the analysis for examining whether the COVs of the MF are valid as a factor for defining the characteristics of road sections. It was assumed that the measurements were taken on arbitrary dates on Tuesday, Wednesday, or Thursday except in winter, and two-time and three-time measurements were assumed to be performed at four-month and three-month intervals, respectively. As expected, as the COV of the MF increased, and larger errors occurred; as the number of measurements increased, the AADT estimation error decreased for cases of seasonal factor (MF and WF) not applied. The table shows the results of AADT estimation error when correcting with the seasonal factor as well, while counting with the method same as the earlier method. As the COV of MF increased, a larger error occurred, and as the measurement frequency increased, the AADT estimation error decreased; in general, a smaller error was shown compared to the case in which no correction was applied.
Table 5: AADT Estimation Error by varying COV of MF and Count Number Seasonal
Factor
Number of Measurement
COV of MF
3.36 3.63 4.29 6.21 6.66 7.37 8.95 10.11 14.74 23.29
Not Applied
1 Count 3.35 2.26 3.54 4.20 6.52 4.60 6.94 4.45 6.64 16.74 2 Counts 2.72 2.26 2.14 2.76 3.74 2.52 3.11 3.55 4.25 13.17 3 Counts 1.39 2.05 1.88 2.57 3.13 4.17 4.56 3.54 5.04 9.23 Applied 1 Count 2.99 2.18 2.07 3.17 6.63 5.76 4.74 4.83 6.84 13.39
2 Counts 2.48 2.27 1.53 2.79 4.13 4.46 4.42 2.70 3.34 6.35 3 Counts 1.21 1.78 1.19 2.87 4.29 3.46 2.98 3.67 6.45 6.02
C. Error Prediction by Statistical Theory
The margin of error can be calculated with Equation 2 and Equation 3. Then the relation between error and COV can be represented as Equation 4. According to equation, the margin of error is related the reciprocal COV.
Equation 1
Where, E = margin of error, Z = standard normal random variable, = population standard deviation, n = sample size
Equation 2
Where, = sample mean, = population mean
Equation 3
Equation 4
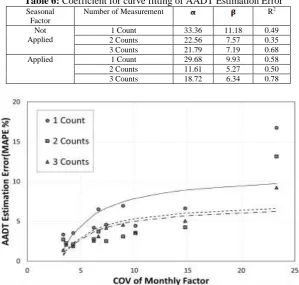
Table 6 shows the results of the coefficient for curve fitting, and the results are plotted in Figure 3 for seasonal factor not applied cases. A difference between 2-count and 3-count is not able to represent by theoretical curve fitting. Results of seasonal factor applied cases are plotted in Figure 4. A trend of 3-count overtake the 2-count’s, representing a difference is limited as well.
Table 6: Coefficient for curve fitting of AADT Estimation Error Seasonal
Factor
Number of Measurement R2
Not Applied
1 Count 33.36 11.18 0.49
2 Counts 22.56 7.57 0.35
3 Counts 21.79 7.19 0.68
Applied 1 Count 29.68 9.93 0.58
2 Counts 11.61 5.27 0.50
3 Counts 18.72 6.34 0.78
Figure 3: Theoretical plot of AADT Estimation Error by varying COV of MF and Count Number (Seasonal Factor Not Applied)
Figure 4: Theoretical plot of AADT Estimation Error by varying COV of MF and Count Number (Seasonal Factor Applied)
D. Appropriate Count Frequency according to the Characteristics of Counting Position
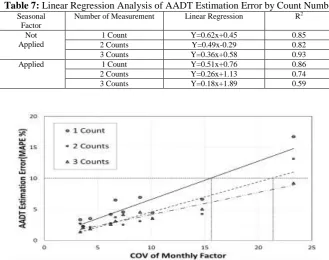
Table 7 shows the results of the linear regression analysis of the COV of the MF and AADT estimation error, and these results of seasonal factor not applied cases are plotted in Figure 5. To reduce the AADT estimation error to less than 10%, traffic count has to be performed twice for the road sections with 15.5 or higher COV and thrice for the road sections with 21.2 or higher COV. According to the result of regression analysis of AADT estimation errors after correcting with the COV of the MF thatis plotted in Figure 6, to reduce the AADT estimation error to less than 10%, the traffic count should be performed twice at road sections where COV of MF is 18.2 or higher.
Table 7: Linear Regression Analysis of AADT Estimation Error by Count Number Seasonal
Factor
Number of Measurement Linear Regression R2
Not Applied
1 Count Y=0.62x+0.45 0.85
2 Counts Y=0.49x-0.29 0.82
3 Counts Y=0.36x+0.58 0.93
Applied 1 Count Y=0.51x+0.76 0.86
2 Counts Y=0.26x+1.13 0.74
3 Counts Y=0.18x+1.89 0.59
Figure 5: Plot of AADT Estimation Error by varying COV of MF and Count Number (Seasonal Factor Not Applied)
Figure 6: Plot of AADT Estimation Error by varying COV of MF and Count Number (Seasonal Factor Applied)
Table 8: Linear Regression Analysis of AADT Estimation Error by Count Number (Seasonal Factor Applied)
Number of Measurement Linear Regression R2
1 Count Y=0.51x+0.76 0.86
2 Counts Y=0.26x+1.13 0.74
E. AADT Estimation Error according to Counting Position Characteristics and Counting Seasons
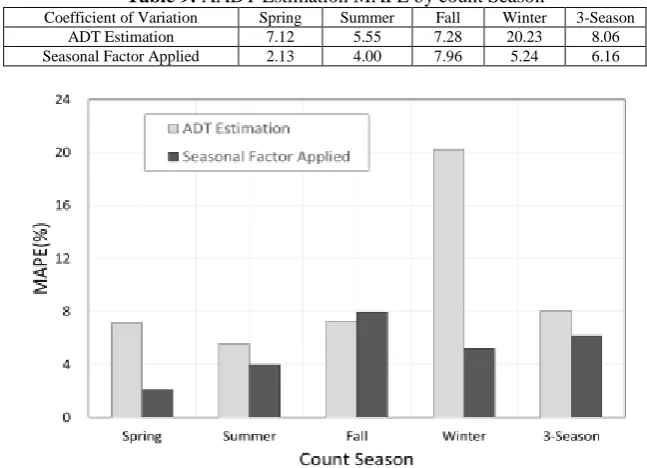
To compare the errors according to the target region according to the time of counting, the 365-day traffic volume data of permanent traffic counting device were divided into spring (March–May), summer (June– August), autumn (September–November), and winter (December–February) data, and AADT was estimated by selecting 96-h traffic volume samples. The results of estimating AADT with 24-h traffic volume samples of spring, summer, and autumn were also compared. Because it was revealed earlier that the AADT estimation error were different according to the variability of road sections, the target road sections were listed in the order of the COV of the MF, and 10 equally spaced positions were selected and analyzed. In Table 9, averages of the AADT estimation errors are shown according to seasonal traffic counts, and they are plotted in Figure 7. The figure shows the comparisons of AADT and ADT, in which correction factors for AADT estimation were not applied, and comparisons of when AADT was estimated by applying MF and WF. When the correction factors were not applied, a large difference occurred between AADT and ADT measured in winter. However, since the seasonal traffic volume difference is reflected in MF, MAPE is less than 10% in every season when the correction factors were applied, and thus, it is expected that the traffic volume collection can be conducted regardless of the season.
Table 9: AADT Estimation MAPE by count Season
Coefficient of Variation Spring Summer Fall Winter 3-Season
ADT Estimation 7.12 5.55 7.28 20.23 8.06
Seasonal Factor Applied 2.13 4.00 7.96 5.24 6.16
Figure 7: AADT Estimation MAPE by count Season
V.
CONCLUSION
Owing to limitation of budget, etc., the positions where 365-day permanent traffic counts are possible are very limited along many sections of roads. To supplement these counts, short-term counts are used, and usually, traffic volumes of road sections cannot be accurately reflected through 24-h counts conducted once a year. To minimize the errors and establish an optimized short-term count plan, the characteristics of road sections were defined and the increases in the count frequency and decrease in the AADT estimation error occurrence were analyzed.
The AADT estimation errors differdepending on the characteristics of road sections, and the characteristics of road sections can be shown with the COV of the MF. This is because as the monthly variability of counting position increases, the AADT estimation error increases, and the error reduction effect according to the increase of count frequency is large, whereas there is no such trend in the AADT estimation error according to the COV of the WF.
REFERENCES
[1]. Aunet, B., 2000. Wisconsin’s approach to variation in traffic data. Report, Wisconsin Department of Transportation, Madison, Wisconsin, EUA.
[2]. Davis, G.A., 1997. Accuracy of estimates of mean daily traffic: a review. Transportation Research Record: Journal of the Transportation Research Board 1593, 12–16. DOI: 10.3141/1593-02
[3]. Faghri, A., Hua, J., 1995. Roadway seasonal classification using neural networks. Journal of Computing in Civil Engineering 9, 209–215. DOI: 10.1061/(asce)0887-3801(1995)9:3(209)
[4]. Figliozzi, M., Johnson, P., Monsere, C., Nordback, K., 2014. Methodology to Characterize Ideal Short-Term Counting Conditions and Improve AADT Estimation Accuracy Using a Regression-Based Correcting Function. Journal of Transportation Engineering 140(5). DOI: 10.1061/(asce)te.1943-5436.0000663
[5]. Ha, J.A., 2014. A Comparison of Short Duration Traffic Counts Methodologies for Estimating Annual Average Daily Traffic, in: Applied Mechanics and Materials. Trans Tech Publ, pp. 657–663. DOI: 10.4028/www.scientific.net/amm.607.657
[6]. Hu, P.S., Wright, T., Esteve, T., 1998. Traffic count estimates for short-term traffic monitoring sites: Simulation study. Transportation Research Record: Journal of the Transportation Research Board 1625, 26–34. DOI: 10.3141/1625-04
[7]. LeBoeuf, C.W., 2014. Estimating Annual Average Daily Traffic for Non-State Roads in Louisiana. UNIVERSITY OF LOUISIANA AT LAFAYETTE.
[8]. New York State Department of Transportation, 2011. Traffic Data Report for New York State.
[9]. Rossi, R., Gastaldi, M., Gecchele, G., 2014. Comparison of Clustering Methods for Road Group Identification in FHWA Traffic Monitoring Approach: Effects on AADT Estimates. Journal of Transportation Engineering 140. DOI: 10.1061/(asce)te.1943-5436.0000676
[10]. Sharma, S.C., Allipuram, R.R., 1993. Duration and frequency of seasonal traffic counts. Journal of Transportation Engineering 119, 344–359. DOI: 10.1061/(asce)0733-947x(1993)119:3(344)
[11]. Sharma, S.C., Wu, Y., Kilburn, P., 1996. The precision of average annual daily traffic volume estimates from seasonal traffic counts: Alberta example. Canadian Journal of Civil Engineering 23, 302–304. DOI: 10.1061/(asce)0733-947x(1993)119:3(344)
[12]. State of California The Transportation Agency Department of Transportation, 2013. Annual Average Daily Truck Traffic on the California State Highway System.
[13]. Vandervalk-Ostrander, A., 2009. AASHTO Guidelines for Traffic Data Programs. AASHTO
[14]. Wang, C. (Ross), Tsai, Y. (James), 2013. Use of Reduction-Effectiveness Ratios to Evaluate Reduced Traffic Data Collection Plans. Transportation Research Record: Journal of the Transportation Research Board 2339, 13–18. DOI: 10.3141/2339-02
[15]. Zhong, M., Bagheri, E., Christie, J., 2012. Improving group assignment and AADT estimation accuracy of short-term traffic counts using historical seasonal patterns & Bayesian statistics. Procedia-Social and Behavioral Sciences 43, 607–617. DOI: 10.1016/j.sbspro.2012.04.134
[16]. Ministry of Construction and Transportation, 2001. Road Traffic Count Guidelines. [17]. Ministry of Land, Infrastructure and Transport, 2015. 2014 Annual Road Traffic Statistics.
[18]. Joo-sam Oh, Seong-hanIm, Yoon-ho Cho, 2005. Division of Homogeneous Road Sections for National Highway by Genetic Algorithms. Journal of Korean Society of Road Engineers 7, 41–47.