Design and optimization of the Automatic Brown
PlantHopper (BPH) light trap surveillance network
Huong Hoang Luong
1,∗, Thanh Hai Nguyen
2, Hung Huu Huynh
3and Hiep Xuan Huynh
41CUSC-CTU, Cantho, Vietnam
2Ministry of Education and Training, Vietnam 3The University of Danang, Vietnam
4DREAM-CTU/IRD, CICT-CTU, Cantho, Vietnam
Abstract
Communicating coverage of automatic BPH light trap surveillance network characterizes how well an area is monitored or tracked by automatic light traps. Connectivity is an important required that shows how nodes in a automatic BPH light trap surveillance network (BSNET) can effectively communicate. Some areas in the deployment region are more important than other areas and need to be covered. In this paper, we propose a new approach based hexagonal cellular automata to find the automatic light trap node distribution. This approach are ensure the deployment region that maximizes the coverage area of BSNET, and preserve connectivity between nodes provided.
Receivedon 02 January, 2016;acceptedon 29 March, 2016;publishedon 02 May, 2016
Keywords: light trap, BPH, surveillance network, optimization, optimal- design, hexagonal cellular automata.
Copyright© 2016 H. H. Luong etal., licensedto EAI. Thisisanopenaccess articledistributedunderthe termsofthe Creative Commons Attribution license (http://creativecommons.org/licenses/by/3.0/), which permits unlimited use,distributionandreproductioninanymediumsolongastheoriginalworkisproperlycited.
doi:10.4108/eai.2-5-2016.151211
1. Introduction
The light trap surveillance network [1] in Mekong Delta region is one kind of representative sampling applying for the geographical region. The light trap surveillance network that can capture multiple kinds of insects, especially BPH, and which data (the density of insects per trap) is collected and analyzed daily. The light trap surveillance network is deployed in the experiments where the BPH trapped density is considered as monitoring called BPH light trap surveillance network (BSNET). BSNET is a spatial sampling network applying for the geographical region. The light trap [19] is one kind of passive trap helping to catch only the mature insects, and it operates only at night. A light trap uses light as an attraction source [20]. Light traps depend on the positive phototactic response of the insects, physiological as well as abiotic environmental factors which can influence the behavior [21]. Many kinds of insect will be caught and counted every day to observe the current density of them. BPH monitoring process is done manually. To automate the
∗
Corresponding author. Email:[email protected]
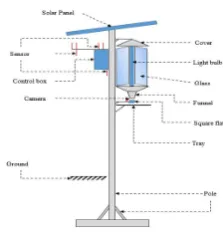
process of monitoring BPHs, a network of automatic BPH light traps need building. An automatic BPH light trap includes some functions such as detecting the BPHs and counting the number of BPHs in the trap. Also, the automatic BPH light trap can trasmit data to other(s). An automatic BPHs light trap [2] was equipped with light source, tray, a camera, communication devices, some sensors and a power. The camera is programmed to capture the images from tray. Also, it can recognize the BPHs and count the number of BPHs in the image. The sensors includes temperature, light, humidity, wind speed,and wind direction. The communication devices which use radio are used to transmit or receive data.
In this paper, we propose a new approach based hexagonal cellular automata[3] to find the automatic light trap node distribution. This approach are ensure the deployment region that maximizes the coverage area of BSNET, and preserve connectivity between nodes provided
This paper contains 6 sections. Some related works are introduced in the next section. Automatic Brown PlantHopper surveillance network is presented in the section 3. Section 4 will decscribe how to optimize the
Figure 1. An automatic light trap
light trap position for Brown PlantHopper surveillance network (This method is called OBSNET). Section 5 will introduce some experimental results by applying the new approach. The last section summarizes the contribution and suggests some researches in the future.
2. Related works
The surveillance network is applied in many domain of environment and ecological research such as in the agricutural management[4], in the fishery surveillance, and in the forest management[1] [5]. Light traps are used to monitor the kinds of insect in the agricutural such as BPHs.
Optimization for wireless sensor network or particu-lar light trap network is an important research. In fact, there are many related researches such as layout opti-mization [8], optimization for energy [9], optimization for coverage - connectivity - topology... [10], schemes optimization [11], optimizing for environment surveil-lance network [12], and etc [13] [14] [15].
In optimal design, optimization for location wireless sensor network or light trap network that ensures the network is coverage or connectivity and so on, which is a popular research. Many researches for that are presented in [12] [16] [17] [18] [10].
3. Automatic Brown PlantHopper surveillance
network
An automatic BPH light trap surveillance network is a graphG=(V, E). This graph built from a set of vertices V={v1,v2, ...,vn}and the set of edgesE={e1,e2,...,em}.
The verticevi withi∈ {1..n}is an automatic light trap. The edge ek with k∈ {1..m}, i∈ {1..n}, j∈ {1..m} is an edge between two verticesviandvj. The weights of the edges are defined by W={w1, w2, ..., wm}where the value
ofwkis given by distance functionfd(vi, vj).
Fig. 2 illustrates the logical graph of a light trap network where the black dots mean the vertices in V and the red lines mean the edges in E. The graph contains 9 vertices V =
Figure 2. A light trap network is presented as a graph
{v1, v2, v3, v4, v5, v6, v7, v8, v9} and 10 edges E = {e1 =e(v1, v2), e2=e(v1, v4), ..., e9=e(v6, v7), e10 =e(v7, v8)}.
Each node of light trap network has a communication range that is indicated by a circle with radius r. Conditions to define existence of an edge are introduced as following:
Definition 1 (Established edge): An edge is
estab-lished if and only if the distance between a pair of vertices is less or equal to the minimum value of their radius -fd(vi, vj)≤min(ri, rj).
Definition 2 (Unestablished edge): An edge is not
established if distance between a pair of vertices is greater than the minimum value of their radius -fd(vi, vj)> min(ri, rj).
Figure 3. The communication range of light traps that is used to establish the egdes between the light traps
In the Fig.3, the graph contains 1 subgraph and an isolated node. The sub graph consists of 8 nodes since distaces among these nodes are less than the radius r while the vertex v9 is an isolated node because all distance values between it to others are insufficient to the definition 1.
4. Optimization of the Automatic Brown
PlantHopper (BPH) light trap surveillance network
The BSNET will be deployed based on hexagonal cellular automata [22]. In [23], this paper specifies the condition that ensures the coverage of the region and guarantees network connectivity [24] [22] [25] [26] [27] [28] [29]. If R ≥ r and 0 ≤ Rr ≤ 123
3
4, the hexagonal
cellular automata is the best deployment, it ensured the region is full coverage, the network is connected and it requires the minimum number of light trap nodes. Otherwise, if R≥
√
3r , the triangle lattice is the optimal deployment pattern to ensure full region coverage and network connectivity.
To determine the automatic light trap node distribu-tion is initiated by placing a light trap in the center hexagon cell. The others will be set based on the first light trap. For example, the first light trap is located at (x,y) in Euclidean space, the neighbor light traps are located at (x, y±
√
3r), and (x±1.5r, y± √
3r
2 ). Through the recursive this construction, we not only determine the position for all the light traps in the surveillance region with the minimum number of the light traps but also ensure the surveillance region that is full coverage about the communication.
There are two cases for optimizing the BSNET. In the first case, the deployment region will be devided into smaller units based on some conditions such as river, road, province, district and so on. After that, the biggest unit will be considered and hexagon cell at this unit will be created. Also, a hexagon grid will be created based on the first hexagon cell. The light traps will be located at the center of the hexagon cell. The pseudo-code for this case is presented in Alg.1
Algorithm 1: Optimizing the BSNET for the first
case
Data: Deployment Region Result: Light trap network begin
Divide deploytment region into smaller unit; Get the biggest unit;
Let w is the width of the biggest unit;
Let c is center coordinates of the biggest unit; list<hexagon>←−gridBuilder(c,w);
list<lighttrap>←−trapBuilder(list<hexagon>);
network←−networkBuilder(list<lighttrap>);
return network; end
In the second case, a hexagon grid will be created by using the same method of the first case. If there are more than an unautomated light traps in a hexagon cell, build the unautomated light trap which is nearest from center of the hexagon cell to become the automatic
light trap. After that, if the BSNET is not connected or not covered the deployment region about the communication, a light trap will be added at the center of the blank hexagon cell. Then, the connectivity will be checked again. If the BSNET is still not connected, move the light trap in the hexagon cell which is not connected with the network to the center of that hexagon cell or intersection of communication range between two automatic light traps (choose the nearest point). The pseudo-code for the second case is presented in Alg.2
5. Experiment
5.1. Data used
The data of experiment is a GIS map data of the Hau Giangprovince at administrative levels including province, district, and commune. The data is stored as a table includings id, name (province, district, commune), shape length, shape area and so on (Fig.4).
Figure 4. Data of Hau Giang province
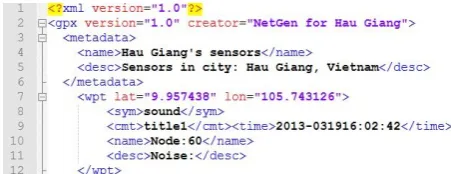
The position of the light traps are stored in the plain text with xml format (*.gpx) that are used as input data. Fig.5presents the structure of the data with three types of information including date, coordinate of the light trap (longitude, latitude), and name. This file is created by using NetGen platform (a platform is developed by Brest university - France) [30]. Also, an abstract network of the light traps for BPH surveillance region atHau Giangprovince was generated from NetGen [30].
Figure 5. The position of the light traps in the xml format
5.2. OBSNET tool
Algorithm 2:Optimizing the BSNET with existing unatomatic light traps
Data: Deployment region, unautomatic light trap position
Result: light trap network begin
Divide deploytment region into smaller unit; Get the biggest unit;
Let w is the width of the biggest unit;
Let c is center coordinates of the biggest unit; list<hexagon>←−gridBuilder(c,w);
foreachcellin thelist < hexagon >do
ifthere are more than unautomated light trap in a hexagon cellthen
Build the nearest unautomated light trap from center to automatic light trap; end
end
Build the automatic light trap network; repeat
ifautomatic light trap network is not connectivitythen
Find all isolated light trap; repeat
foreachltin
list < isolatedlighttrap >do
move it to center of hexagon cell or intersection of communication range;
end
untilautomatic network is connectivity; end
ifautomatic light trap network is not coverage then
foreachcellinlist < hexagon >do ifno light trap in a cellthen
Create a light trap at the center of the cell;
end end end
Build the automatic light trap network; untilautomatic light trap network is connectivity and coverage;
return automatic network; end
show the GIS map data, determine the position of the light trap on a map, create and display a hexagon grid on map,and build the network. Besides, OBSNET tool is also used to determine the communication range for automatic light trap based on honeyComb network.
5.3. Experiment 1: optimizing the light trap position
for BPH surveillance network on the surveilance
region without existing unautomated light trap
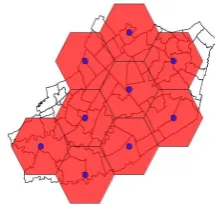
The requirement for this experiment must create a automatic BPH light trap network for Hau Giang province. First, the experiment will display the gis map data of Hau Giang province as communes. Then, it will determine the biggest commune on the map and construct the hexagon grid based on that commune. The result shown as Fig.6.
Figure 6. Hexagon grid for Hau Giang province
In Fig. 6, we obtain a hexagon grid with 9 hexagons. Each hexagon has a radius with 8,842 (m). Therefore, the minimum communication range is proposed 8,842*
√
3= 15,315 (m).
Figure 7. Light trap position in hexagon grid for Hau Giang province
Figure 8. Light trap communication range in Hau Giang
Fig.9is present the OBSNet for automatic light traps in Hau Giang province.
Figure 9. The OBSNET for the automatic light traps in Hau Giang
The logical network of the OBSNet in Hau Giang province is present as below:
Figure 10. The logical network for the automatic light traps in Hau Giang
5.4. Experiment 2: optimizing the light trap position
for BPH surveillance network with existing
unautomated light trap
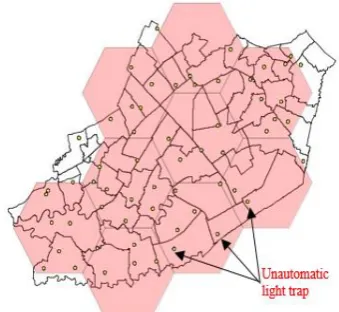
In this experiment, we will build the hexagon grid on the surveillance region that have some existing unautomated light traps. First, we need to consider to build some unautomated light traps to become automatic light traps. Second, we will build the network. If the network is not connected (there are some isolated automatic light traps), these automatic light traps will be considered moving to a new location. The hexagon grid on the surveillance region with existing unautomated light trap is shown as in Fig.11. There are two cases about the unautomated light trap position. They are the unautomated light trap is located inside or outside the hexagon grid.
Figure 11. The hexagon grid on Hau Giang with existing non-auto light traps
Then, skip all the unautomated light traps outside the hexagon grid. After that, we will traverse every hexagon cell in hexagon grid, and get the unautomated light trap nearest from the center of the cell and skip all the others. The result is shown as in Fig.12
The nearest unautomated light traps from center of the hexagon cell will become an automatic light trap with communication range that is calculated in the experiment 1. Now, we will build the network for the automatic light traps (Fig.13).
Figure 13. Skip the unautomated light trap
In the Fig. 13, there is an isolated automatic light trap, so the network is not connected. Therefore, we must move the isolated to new position that helps the network connect. There are two new positions including the center of the cell and the intersection between two communication of two automatic light traps in neighbor cells. In this experiment, we will choose the nearest position that helps network connect. It is the intersection between two communication ranges.
The Fig. 14 shows the network after moving the isolated light trap to new position (intersection between two communication ranges of two automatic light traps).
Figure 14. OBSNet is built after moving the isolated automatic light trap to new position
The logical network for OBSNet after moving the isolated automatic light trap to new position (Fig.15).
Figure 15. Logical network for OBSNet
6. Conclusion
The research on the optimization for automatic Brown PlantHopper surveillance network is one of the important trends in the environment and ecological research. This trend solves some questions such as where light traps are placed, how to fully cover the surveillance region and so on. Therefore, we propose a new approach to design and optimize the light trap position for BPH surveillance network based on hexagonal cellular automata.
Building the hexagon grid and network helps to determine the number of light traps needed and their positions. The result of the network model is deployed in Hau Giang province, a province in Mekong Delta. Based on the experiment results, we can deploy the OBSNET in the Mekong Delta region.
The experiment results show the effects of OBSNET based on hexagonal cellular automata. Using this method not only helps to optimize the light trap position for BPH surveillance network but also saves the cost in actual deployment. Actual data is used to validate the correctness of the OBSNET.
6.1. Acknowledgements
The work of this paper was in the scope of the "OBSNET - Optimizing the Brown Planthopper surveillance network using automatic light traps in the Mekong Delta region" project of the Ministry of Education and Training, Vietnam.
References
[1] Michael, K.M.M.,Steen, S.M., (2006) Sampling Methods, Remote Sensing and GIS Multiresource Forest Inventory. InSpringer-Verlag Berlin Heidelberg.
Information and Communication Technology 2015, Can Tho University, Vietnam.
[3] Wang, B.(2011) Coverage problems in sensor networks: A survey. InACM Comput. Surv., vol. 43, no. 4, 1-53. doi: 10.1145/1978802.1978811
[4] Marcin, K.R. W. (2005) Ps sampling versus stratified sampling comparison of efficiency in agricultural surveys. In Statistics in transition, vol. 7, no. 1, 5-12.
[5] Talvitie, M., Leino, O., and Holopainen, M. (2006) Inventory of sparse forest populations using adaptive cluster sampling. InThe Finnish Society of Forest Science, Silva Fennica, 0037-5330.
[6] Warrick, A.W. and Myers, D.E. (1987) Optimization of sampling locations for variogram calculations. In emphWater Resources Research, vol. 23, no. 3,496-500, 1987. doi: 10.1029/WR023i003p00496
[7] Brus, D.J. andHeuvelink, G.B.(2007) Optimization of sample patterns for universal kriging of environmental variables. InGeoderma, vol. 138, no. 12, pp. 86-95. [8] Jourdan, D.andWeck, O.(2004) Layout optimization for
a wireless sensor network using a multi-objective genetic algorithm. InVehicular Technology Conference, vol. 5, 2004, 2466-2470.
[9] Lee, J.H.andMoon, I.(2014) Modeling and optimization of energy efficient routing in wireless sensor networks. InApplied Mathematical Modelling, vol. 38, no. 78, 2280-2289.
[10] Gogu, A., Nace, D., Dilo, A. and Mertnia, N.(2011) Optimization problems in wireless sensor networks. In International Conference on Complex, Intelligent and Software Intensive Systems (CISIS), 302-309.
[11] Niewiadomska, S.E.andMarks, M.(2009) Optimization schemes for wireless sensor network localization. InInt. J. Appl. Math. Comput. Sci., vol. 19, no. 2, 291-302.
[12] Viet, T.X., Hiep, H.X., Minh, L.N. and Drogoul, A. (2013) Optimizing an environmental surveillance network with gaussian process entropy - an optimization approach by agent-based simulation. In 7thInternational KES Conference on Agents and Multiagent Systems -Technologies and Applications, Vietnam.
[13] Aio, W.,Mateus, G., andQuintao, F.(2007) Optimiza-tion issues and algorithms for wireless sensor networks with mobile sink. InProc. INOC.
[14] Iqbal, M., Naeem, M., Anpalagan, A., Ahmed, A.and Azam, M.(2015) Wireless sensor network optimization: Multi-objective paradigm. InSensors, vol. 15, no. 7, 17572. [15] Madan, R., Cui, S.,Lall, S.andGoldsmith, A.(2007) Modeling and optimization of transmission schemes in energy-constrained wireless sensor networks. In IEEE/ACM Transactions on Networking, vol. 15, no. 6, 1359-1372.
[16] Gopakumar, A. and Jacob, L. (2008) Localization in wireless sensor networks using particle swarm optimization. In International Conference on Wireless, Mobile and Multimedia Networks, 227-230.
[17] Mollaebrahim, G.P.,Shahbazian, R.andGhorashi, S.A. (2014) Localization in Wireless Sensor Networks Using Quadratic Optimization. InArXiv e-prints.
[18] Monica, S. and Ferrari, G. (2013) Particle swarm optimization for auto-localization of nodes in wireless sensor networks. Adaptive and Natural Computing Algorithms. In Tomassini, M., Antonioni, A., Daolio, F. and Buesser, P. Lecture Notes in Computer Science, Eds. Springer Berlin Heidelberg, vol. 7824, 456-465.
[19] Vaithilingam, D.C.(2013) Role of insect light trap in organic agriculture. InRomvijay Biootech Private Limited. [20] Linker, D.B.O.H.M. and Barbercheck, M.E. (2009)
Insect management on organic farms.
[21] Brown planthopper: Threat to rice (1979). In Interna-tional Rice Research Institude.
[22] KhouïňĄ, I., Minet, P., Laouiti, A.andMahfoudh, S. (2014) Survey of Deployment Algorithms in Wireless Sensor Networks: Coverage and Connectivity Issues and Challenges. In International Journal of Autonomous and Adaptive Communications Systems (IJAACS), 24.
[23] Baltzis, K.B. (2011) Hexagonal vs circular cell shape: a comparative analysis and evaluation of the two popular modeling approximations. In INTECH Open Access Publisher.
[24] Sun, Y., Yu, Z., Ge, J., Lin, B. and Yun, Z. (2009) On deploying wireless sensors to achieve both coverage and connectivity. In Proceedings of the 5th International Conference on Wireless Communications, Networking and Mobile Computing(IEEE Press),3369-3372.
[25] Ghosh, A.andDas, S.K. (2008) Coverage and connec-tivity issues in wireless sensor networks: A survey. In Pervasive and Mobile Computing, vol. 4, no. 3, 303-334. [26] Zhu, C.,Zheng, C.,Shu, L.andHan, G.(2012) Review:
A survey on coverage and connectivity issues in wireless sensor networks. InJ. Netw. Comput. Appl., vol. 35, no. 2, 619âĂŞ632. doi: 10.1016/j.jnca.2011.11.016
[27] Zhang, H. and Hou, J.C. (2005) Maintaining sensing coverage and connectivity in large sensor networks. InAd Hoc and Sensor Wireless Networks, vol. 1, no. 1-2.
[28] Bai, X.,Kumar, S.,Xuan, D.,Yun,Z.andLai, T.H.(2006) Deploying wireless sensors to achieve both coverage and connectivity. InProceedings of the 7thACM International Symposium on Mobile Ad Hoc Networking and Computing, 131-142. doi: 10.1145/1132905.1132921
[29] Wang, Y.c., Hu, C.C. andTseng, Y.C. (2005) Efficient deployment algorithms for ensuring coverage and connec-tivity of wireless sensor networks. InWICON, S. Imreand J. Crowcroft, Eds. IEEE Computer Society,114-121.
[30] netgen website, A generator of concurrent systems, http://wsn.univ-brest.fr/NetGenNews (accessed on 21 December 2015)