http://dx.doi.org/10.19045/bspab.2017.60068
Research Article
Performance evaluation of tomato
accessions across two locations of Khyber
Pakhtunkhawa
Izhar Hussain
1, Sher Aslam Khan
1, Haneef Raza
2*, Ayub Khan
1, Abid
Farid
1, Shah Masaud Khan
1, Ijaz Hussain
1, Naushad Ali
1and Ahmad
Ali
11. Department of Agricultural Sciences, University of Haripur Khyber Pakhtunkhwa-Pakistan
2. Department of Plant Breeding and Genetics, Khyber Pakhtunkhwa Agricultural University, Peshawar-Pakistan *Corresponding author’s email:[email protected]
Citation
Izhar Hussain, Sher Aslam Khan, Haneef Raza, Ayub Khan, Abid Farid, Shah Masaud Khan, Ijaz Hussain, Naushad Ali and Ahmad Ali. Performance evaluation of tomato accessions across two locations of Khyber Pakhtunkhawa. Pure and Applied Biology. Vol. 6, Issue 2, pp657-663. http://dx.doi.org/10.19045/bspab.2017.60068
Received: 08/02/2017 Revised: 28/04/2017 Accepted: 16/05/2017 Online First: 19/05/2017
Abstract
Identification of adaptable and stable genotypes is an important aspect of applied crop breeding which can insure sustainable crop production. Adaptability studies in tomato is an essential part of breeding for adequate evaluation of genotypes accomplished through environments (years/locations). A set of forty tomato accessions of diverse origin were tested at Swabi and Haripur locations to assess their performance. The experiment was carried out in randomized complete block design with three replications. Data were recorded on 50% flowering, days to fruiting and yield per hectare. Genotype (G), environment (E) and GEI share in total sum of squares were also studied. Significant (p≤0.01) differences were observed among the accessions, environments (locations) and G × E interaction means for majority traits, which assured greater genetic variability among the accessions due to their divergent genetic make-up, as well as environments. On average, the accessions showed best performance in Swabi location than Haripur for yield and duration parameters. Overall, the promising accessions could be further explored for improvement in tomato fruit yield.
Keywords: Genotypes; Environments; Genotype-by-environment interaction Introduction
Tomato (Solanum lycopersicum Mill.) is relatively a new addition to the world food crops, used in various forms both fresh and processed. Although tomato does not rank high in terms of caloric value, by virtue of volume consumed in its various forms such as cooked, salad, soup, preserves, pickles, ketchup sauces and many other products, it
vitamin A, B, C and essential minerals [1].
tomato production was 4965.35 tones, fresh or chilled worth US$ 0.829 million [2]. In Pakistan, very little efforts have been made for improving vegetable crops including tomato, because of their secondary importance in the crop husbandry [3]. Consequently, very few local varieties of tomato are available for cultivation and most of them are selections from the introduced germplasm. Furthermore, the available varieties are poor in quality traits, and therefore, are unable to get consumer's attraction. In Pakistan tomato is grown on an area of 44460 hectare with annual production of 491370 tones [4]. Amongst the several reasons of low production of tomato the two reasons appears to be reasonable, firstly locally developed varieties are not available and secondly the non-existence of local tomato seed industry. Almost the total seed supply of tomato requirement is fulfilled through import of hybrid seed, and during 2005-06 Pakistan imported 72.75 tons of tomato seeds worth 2.09 million US$, while it was increased
significantly to US$ 5.1 million in 2009 [5]. This expensive seed supply of tomato necessitates the vegetable breeders to breed varieties/hybrids having great yield potential under local environments. For this purpose, irrespective of the tools adopted during the breeding process, the breeder has to take two major steps: first to find and/or create genetic variation and secondly to select the best genotypes [4]. In present study, small samples of 40 tomato accessions were evaluated for their performance across two locations of Khyber Pakhtunkhawa.
Material and methods
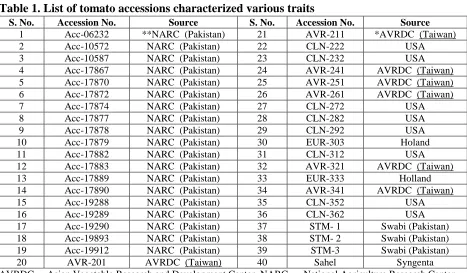
The present investigation was conducted to categorize native and foreign tomato germplasms from diverse genetic sources. For morphological characterization tomato germplasm, consisting of 40 tomato genotypes, were acquired from national agriculture research center (NARC), Islamabad and federal Seed certification and registration department (FSC and RD), Islamabad, Pakistan in January, 2013 (Table 1).
Table 1. List of tomato accessions characterized various traits
AVRDC = Asian Vegetable Research and Development Center, NARC = National Agriculture Research Center
S. No. Accession No. Source S. No. Accession No. Source
1 Acc-06232 **NARC (Pakistan) 21 AVR-211 *AVRDC (Taiwan)
2 Acc-10572 NARC (Pakistan) 22 CLN-222 USA
3 Acc-10587 NARC (Pakistan) 23 CLN-232 USA
4 Acc-17867 NARC (Pakistan) 24 AVR-241 AVRDC (Taiwan)
5 Acc-17870 NARC (Pakistan) 25 AVR-251 AVRDC (Taiwan)
6 Acc-17872 NARC (Pakistan) 26 AVR-261 AVRDC (Taiwan)
7 Acc-17874 NARC (Pakistan) 27 CLN-272 USA
8 Acc-17877 NARC (Pakistan) 28 CLN-282 USA
9 Acc-17878 NARC (Pakistan) 29 CLN-292 USA
10 Acc-17879 NARC (Pakistan) 30 EUR-303 Holand
11 Acc-17882 NARC (Pakistan) 31 CLN-312 USA
12 Acc-17883 NARC (Pakistan) 32 AVR-321 AVRDC (Taiwan)
13 Acc-17889 NARC (Pakistan) 33 EUR-333 Holland
14 Acc-17890 NARC (Pakistan) 34 AVR-341 AVRDC (Taiwan)
15 Acc-19288 NARC (Pakistan) 35 CLN-352 USA
16 Acc-19289 NARC (Pakistan) 36 CLN-362 USA
17 Acc-19290 NARC (Pakistan) 37 STM- 1 Swabi (Pakistan)
18 Acc-19893 NARC (Pakistan) 38 STM- 2 Swabi (Pakistan)
19 Acc-19912 NARC (Pakistan) 39 STM-3 Swabi (Pakistan)
http://dx.doi.org/10.19045/bspab.2017.60068
Nursery preparation
Sowing of the accessions was done at Agriculture Research Farm, University of Haripur, in February 2013 for raising nursery seedlings. For sowing different soils like sandy, light, well drained and high in organic matter were selected by keeping a row to row distance of 10 cm and plant-to-plant distance of 5 cm.
Transplantation
Transplantation of the seedlings was carried out into well prepared field plots rich in organic matter after 4 weeks from the nursery at the evening time so to reduce the risk of transplant shock. Each field plot was composed of 4 rows of 1 meter with a row to row distance of 120 cm and a plant to plant space of 40 cm.
Field management
FYMs [(@ 15 tones per hectare) and NPK (@ 100:80:60 kg per hectare)] was applied at the time of seed bed preparation, followed by irrigation. Total amount of organic manure, P2O5, K2O and 1/3 N was applied at the time of seed bed preparation and the rest of nitrogen was side dressed in two splits i.e., 20 days after transplantation and at pre-flowering stage. Furadon granules were also applied to the soil before transplantation to
aviod any insect attack on young plantlets. In order to keep the block weed free,
mechanical weeding was done from
transplantation till harvest. Earthing up and supporting and training with vertical strings was done after 15th day of transplantations. Traits measurement and statistical analysis
Data were recorded on days to 50% flowering, days to fruiting and yield per hactare. Data were subjected to analysis of variance (ANOVA) according to Steel & Dickey [6]. After getting the significant variations among genotypes performance for various parameters, the means for each trait were further separated and compared by using the least significant difference (LSD) test at 5% level of probability.
Results and discussion
Pooled analysis of variance across two locations revealed significant (p<0.01) differences among genotypes, environment and genotype × environment interaction for days to 50% flowering and yield per hectare; however environment and genotype × environment interaction was non-significant for days to fruiting(Table 2).Similar results were out lined by Panthee et al.[7].
Table 2. Mean square values of ANOVA for yield and yield related traits of 40 Accessions across two location of Khyber Pakhtunkhwa
Parameters Mean squares CV (%)
Locations Genotypes G × L
d.f. 1 39 39
Days to germination 0.33750** 6.19135** 1.10673** 3.45
Days to 50% Flowering 49.504** 59.849** 16.111** 1.49
Days to Fruiting 42.504** 36.668** 18.12** 3.26
Yield per Plot 8.0656** 4.4246** 3.1279** 6.41
**, Significant at p≤0.01
Days to 50 % flowering
Category wise comparison for mean ranges at both locations were Acc-17889 (41.00) to STM-2 (52.00) days in indigenous group, EUR-333 (46.00) to EUR-303 (53.00 days)
days to 50% flowering was 47.37 and 48.27 days under Haripur and Swabi environment, respectively, indicating a net difference of 0.92 days between two tested environments (Table 3). Similarly Ghosh et al. [8]
reported a wide range of variation for days to initial flowering in tomato. Wider variation in respect to days to first flowering was also reported by Prema et al.[9] among six cherry tomato lines. This scenario was manifested in Tropimech which has shorter
days to flowering and performs better than the other genotypes in terms of yield. Similar results have been reported by Dhankhar & Dhankhar [10]. Comparison between the environments showed that genotype EUR-312 revealed maximum (54.67 days) in Haripur environment followed by the same genotype in Swabi location; however, lowest (42.33 days) were observed in Swabi.
Table 3. Days to 50% flowering, days to fruiting and yield per hectare (tons) comparison of 40 Accessions across two locations of Khyber Pakhtunkhwa
Days to 50% flowering Days to fruiting Yield per hectare (tons)
Accessions Haripur Swabi Mean Haripur Swabi Mean Haripur Swabi Mean
Europe 49.67 50.17 49.92 19.67 20.33 20.00 33.10201 20.57801 26.84001
EUR-303 53.33 53.67 53.50ab 23.33 23.00 23.17b 33.01929 17.76045 25.38987e/k
EUR-333 46.00 46.67 46.34kl 16.00 17.67 16.84n/p 33.18474 23.39556 28.29015c/f
Indigenous 47.43 47.96 47.70 17.81 18.13 17.97 24.78620 30.05211 27.41916
Acc-06232 50.33 50.67 50.50c/f 20.33 20.67 20.50c/g 22.54043 16.75183 19.64613n
Acc-10572 46.33 49.67 48.00h/j 16.33 20.67 18.50k/m 25.56827 25.13373 25.35100e/k
Acc-10587 45.33 50.67 48.00h/j 15.33 20.67 18.00l/n 26.41743 28.72768 27.57256c/h
Acc-17867 42.33 43.00 42.67o 14.00 15.33 14.67rs 24.57162 34.38272 29.47717cd
Acc-17870 51.67 47.33 49.50e/h 21.67 17.33 19.50f/k 26.37357 31.76151 29.06754c/e
Acc-17872 43.00 45.67 44.34mn 14.33 16.33 15.33qr 21.62749 28.79545 25.21147e/k
Acc-17874 50.00 48.67 49.34e/h 20.00 18.67 19.34g/k 20.06871 33.46380 26.76626d/i
Acc-17877 53.00 43.00 48.00h/j 23.00 14.67 18.84j/l 24.94038 30.79076 27.86557c/g
Acc-17878 47.67 44.33 46.00kl 17.67 15.33 16.50o/q 21.08331 52.14517 36.61424b
Acc-17879 46.00 51.33 48.67g/j 16.00 20.67 18.34k/m 24.61746 23.87993 24.24870g/m
Acc-17882 51.33 49.33 50.33d/f 21.33 18.33 19.83e/j 25.45665 27.13502 26.29584d/j
Acc-17883 52.67 48.00 50.34d/f 22.67 18.00 20.34c/h 27.24266 29.55291 28.39779 c/f
Acc-17889 40.33 41.67 41.00p 13.33 14.33 13.83s 28.85924 30.58545 29.72235 cd
Acc-17890 45.00 47.00 46.00kl 15.00 16.33 15.67p/r 22.84740 32.00270 27.42505 c/h
http://dx.doi.org/10.19045/bspab.2017.60068
Acc-19289 43.67 45.00 44.34mn 15.00 16.33 15.67p/r 20.54113 28.96688 24.75401 f/l
Acc-19290 48.67 52.33 50.50c/f 18.67 22.67 20.67c/f 20.35176 26.20414 23.27795i/n
Acc-19893 51.67 51.33 51.50cd 21.67 16.67 19.17h/l 24.80085 32.95750 28.87918c/e
Acc-19912 46.33 51.00 48.67g/j 16.33 21.67 19.00i/l 27.23070 28.00012 27.61541c/h
Sahel 43.33 44.67 44.00m/o 14.67 14.67 14.67rs 42.96993 48.85021 45.91007a
STM-1 48.33 46.67 47.50i/k 18.33 16.67 17.50m/o 18.87272 25.14768 22.01020k/n
STM-2 51.33 52.67 52.00bc 21.33 21.67 21.50c 25.38688 27.42605 26.40647d/j
STM-3 45.67 46.67 46.17kl 15.67 18.00 16.84n/p 27.20877 21.18298 24.19588g/m
Taiwan 45.43 48.05 46.74 16.14 19.14 17.64 29.28325 28.60580 28.94453
AVR-201 48.33 52.67 50.50c/f 18.33 22.00 20.17d/i 33.03524 29.25990 31.14757c
AVR-211 45.33 47.00 46.17kl 15.33 22.67 19.00i/l 27.19881 25.10383 26.15132d/j
AVR-241 43.00 43.33 43.17no 14.33 20.67 17.50m/o 33.42792 44.09615 38.76204b
AVR-251 45.67 52.33 49.00f/i 16.00 15.00 15.50qr 32.19805 21.08730 26.64268d/j
AVR-261 50.67 51.00 50.84c/e 20.67 21.67 21.17cd 30.89442 40.18925 35.54184b
AVR-321 43.33 44.67 44.00m/o 14.67 15.67 15.17r 27.82471 18.37838 23.10155i/n
AVR-341 41.67 45.33 43.50no 13.67 16.33 15.00rs 20.40359 22.12582 21.26471l/n
USA 48.29 48.92 48.61 18.38 18.88 18.63 25.97890 25.52567 25.75229
CLN-222 46.00 44.67 45.34lm 16.00 17.00 16.50o/q 34.72956 25.07991 29.90474cd
CLN-232 49.67 49.33 49.50e/h 19.67 15.33 17.50m/o 31.51832 27.67720 29.59776cd
CLN-272 52.00 51.00 51.50cd 22.00 20.00 21.00c/e 21.85074 23.68459 22.76767j/n
CLN-282 44.33 42.67 43.50no 15.00 14.67 14.84rs 25.66196 29.08448 27.37322c/h
CLN-292 47.00 47.67 47.34jk 17.00 18.00 17.50m/o 17.49534 23.99355 20.74445mn
CLN-312 55.00 54.33 54.67a 25.00 24.33 24.67a 20.65674 19.20959 19.93317n
CLN-352 45.67 52.33 49.00f/i 15.67 22.33 19.00i/l 37.90690 24.52178 31.21434c
CLN-362 46.67 49.33 48.00h/j 16.67 19.33 18.00l/n 18.01161 30.95422 24.48292f/m
Days to fruiting
Mean values for tomato accessions for days to fruiting were 17.72 and 18.57 days under
Haripur and Swabi environment,
respectively, indicating a net difference of 0.85 days between two tested environments
maturing by taking less days to maturity. Whereas, maximum value of (24.67 days) was observed for CLN-312 followed by EUR-303 (23.17 days), STM-2 (21.50 days) and AVR-261 (21.17 days). These were grouped in late maturing. Similar trend was also observed by Sunnadagudi [11] in
tomato. Comparison between the
environments showed that genotype EUR-303 revealed maximum number of days to
fruiting (23.33 days) in Haripur
environment. However, in Swabi the genotype CLN-312 revealed maximum days to fruiting with a mean value of 24.33. Category wise, over all mean across two
locations ranged between Acc-17889
(13.83) to STM-2 (21.50 days) for indigenous group, EUR-333 (16.84) to EUR-303 (23.17 days) for European, AVR-341 (15.00) to AVR-261 (21.17 days) for Taiwan and CLN-282 (14.84) to CLN-312 (24.67 days) for American germplasm. Yield hectare-1 (tons)
Mean values of 40 tomato genotypes for yield per hactare was 26.22 and 28.42 tons per hectare under Haripur and Swabi environment, respectively, indicating a net difference of 2.20 tons between two tested environments (Table 3). Maximum value of 45.91 tons per hectare were observed in Sahel followed by AVR-241 (38.76), Acc-17878 (36.61), AVR-261 (35.54) and CLN-352 (31.21) whereas, minimum (19.65 tons) was observed for Acc-06232 followed by CLN-312 (19.93), CLN-292 (20.74), AVR-341 (21.26) and STM-1 (22.01) for yield per hectare (Table 3). A wide range of yield/ha (27.91 to 75.55 t/ha) was also reported in six cherry tomato lines by Ingale [12]
Comparison between the environments showed that genotype Acc-17878 revealed maximum (52.14 tons) yield per hectare in Swabi environment followed by the Sahel genotype in the same location with an average yield of 48.85 tons per hectare; however, minimum (17.49 tons) yield per
hectare was observed in Swabi. Indigenous, European, Taiwan and USA group ranged from 19.64 ton (Acc-06232) to 36.61 ton (Acc-17878), 25.38 ton (EUR-303) to 28.29 ton (EUR-333), 21.26 ton (AVR-341) to 38.76 ton (AVR- 241) and 19.93 ton (CLN-292) to 29.90 tons (CLN-222), respectively. Fruit yield is the final products of various characters and here it was considered to be the resultant variable while the rest of the variables were casual variables. Each character influence fruit yield by its direct and indirect contributions with other characters. An aggregate residual factor that includes all other factors affecting fruit yield and not yet accounted was treated as independent of the rest of factors considered.
Conclusions
Based on two-location studies, it was concluded that environments in combination with genotypes play principal role in phenotypic manifestation of the various traits followed by G × E interaction. Overall, accession Sahel followed by STM-3 and AVR-321 showed best performance and found more adaptive to the existing environmental conditions of Swabi. These accessions could be grown for improvement in fruit yield of tomato.
Authors’ contributions
Conceived and designed the experiments: I Hussain, Performed the Experiments: N Ali & A Ali, Analyzed the Data: A Farid, Contributed reagents/ materials/ analysis tools: SM Khan, I Hussain, N Ali and A Ali, Wrote the paper: SA Khan, A Khan, SM Khan & H Raza.
References
1. Tigchelaar EC (1986). Tomato Breeding. In: Vegetable Breeding. Mark J. Bassett (Ed). AVI publishing Co Inc Westport Connecticut p.137.
2. Anonymous (2006). Fruit, Vegetables and Condiments Statistics of Pakistan
http://dx.doi.org/10.19045/bspab.2017.60068
Ministry of Foods, Agriculture and Livestock (Economic Wing) Islamabad. 3. Shokat S, Azhar FM & Zia MB (2011).
Path coefficient analysis of total soluble solids in Solanum lycopersicum L. The Nucleus 48(4): 339-342.
4. Passam HC, Karapanos IC, Bebeli PJ & Savvas D (2007). A Review of Recent Research on Tomato Nutrition, Breeding
and Post-Harvest Technology with
Reference to Fruit Quality. The European J Plant Sci & Biotec 1(1): 1-21.
5. Anonymous. (2011). Tomato crop status, Pakistan Rain/Flood. Report on Flash floods, breaches in canals and damage to infrastructure and agriculture sectors in Sind Province 24 September.
6. Steel RG & Dickey JH (1997). Pinciples and procedures of statistics a biometrical approach (No. 519.5 S8).
7. Panthee DR, Brown AF, Yousef GG, Ibrahem R & Anderson C (2013). Novel molecular marker associated with Tm2a gene conferring resistance to tomato mosaic virus in tomato. Plant Breeding. 132(4): 413-416.
8. Ghosh KP, Islam AKMA, Mian MAK & Hossain MM (2010). Variability and Character Association in F2 Segregating Population of Different Commercial
Hybrids of Tomato (Solanum
lycopersicum L.). J Applied Sci and Environ Manag 14(2): 91-95.
9. Prema G, Indiresh KK & Santosha HM (2011b). Evaluation of cherry tomato (Solanum lycopersicum var. cerasiforme) genotypes for growth, yield and quality traits. Asian J Hort 6(1): 181-184.
10.Dhankhar SK & Dhankhar BS (2006). Variability, heritability, correlation and path-coefficient studies in tomato. Haryana J Hort Sci 35(1/2): 179.
11.Sunnadagudi RB (2011). Molecular,
morphological and chemical
characterization of tomato (Solanum lycopersicumL.) genotypes and influence of different organic manures on seed yield, quality in tomato cv. Dmt-2. M.Sc Thesis Univ Agric Sci Dharwad India. 12.Ingale BV (1993). Diversity, heterosis
and genetics of yield and quality
parameters in brinjal (Solanum