ORIGINAL ARTICLE DOI 10.1007/s10086-002-0508-4
Anim Boanyo Dansoh · Akio Koizumi · Takuro Hirai
Compressive and tensile properties of a butt-jointed lamination model
Received: June 26, 2002 / Accepted: November 18, 2002
Abstract A study was undertaken to evaluate the effect of
glue application and placement of butt-joints on the com-pressive and tensile properties in a butt-jointed lamination. The aim was to provide background information for producing butt-jointed, glued, laminated timber. Three butt-jointed lamination models were prepared from spruce-pine-fir (S-P-F) dimension lumber with glued and nonglued butt joints, with different placements of the butt joints in the models. The axial stiffness and strength properties were assessed using both compressive and tensile tests. The re-sults of the study indicated that for the compressive lamina-tion model the applicalamina-tion of glue at the butt joint gave more stiffness than the nonglued butt joint. Neither glue application nor placement of the joint had a statistically significant effect on the compressive strength. There were no significant differences between the glued and nonglued butt joint for either tensile strength or stiffness.
Key words Butt joint · Glued joint · Glulam · Compression ·
Tension
Introduction
The feasibility of upgrading small, low-quality timber re-sources for the production of glulam is currently an impor-tant subject in the timber industry. Butt-jointed glulam is one of the solutions to utilizing small-diameter, under-utilized timber resources.
ASTM-D37371
forms the basis for assigning design stresses to glulam timber. Because glulam beams are usually used for bending members, emphasis is placed on design strength and stiffness during bending, with the primary
A.B. Dansoh (*) · A. Koizumi · T. Hirai
Laboratory of Timber Engineering N218, Graduate School of Agriculture, Hokkaido University, N9 W9, Kita-ku, Sapporo 060-8589, Japan
Tel. 81-11-716-2111; Fax 81-11-716-0879 e-mail: [email protected]
design loads applied perpendicular to the wide face of the laminations. Glulam can also be used as tension members in truss chords or as compression members in columns2
; and in that case the load-carrying capacity is specifically deter-mined from the axial forces and the effective cross section. In one of our previous tests the bending stiffness and strength of a five lamination butt-jointed glued laminated timber (glulam) were studied.3
A model equation based on the strain energy distribution in a notched wood beam4,5
was developed to predict the bending stiffness and strength re-duction caused by the butt joint in a glulam. The bending stiffness and strength properties of beams with different placement of a butt joints were investigated.
The strength reduction effect of a butt joint at the com-pression side of the glulam was observed from the initial stage of the loading process up to when the contact ends of the lamination at the butt joint have closed enough to transmit compressive stress across the butt joint.3
This experiment was conducted to study further the effect of compressive and tensile stresses on butt joints in a lami-nated model using glued and nonglued butt joints. The ap-plication of glue at the butt joint, which has been observed to provide more compressive stiffness than that of a nonglued butt joint in short wood columns,6
can increase the bending strength of the glulam beam.
To arrive at a rational design for glulam beams contain-ing laminated butt joints made from low-grade timber re-sources, compression and tensile properties of the butt jointed lamination should be studied. The objective of this study was to determine the effect of glue application and placement of a butt joints on compressive and tensile strength properties of a butt-jointed lamination model.
Materials and methods
Material selection
lumbers. The lumbers were planed to 33 88 mm cross section to expose the visible defects that could adversely affect the tensile and compressive properties. A total of 45 wood samples were selected from 80 lumbers. The dynamic modulus of elasticity (MOE) for each of the selected wood samples was determined by the longitudinal vibration tech-nique. The samples were ranked by their dynamic MOE. The test pieces were carefully matched on the basis of the dynamic MOE in the various butt joint variables for the compression and tension tests. This was done to ensure equal distribution of MOE values among the butt joint variables for the tension and compression samples.
Experimental design
The joint variables were specifically designed to assess the effect of glue application at the butt joint and the placement of butt-jointed lamination on the performance of compres-sive and tensile laminated models. In this experiment, speci-mens with glue application at the butt joint were identified as glued butt-jointed lamination, and those without glue application at the butt joint were identified as nonglued butt-jointed lamination. With regard to placement of the butt joints, specimens with the inner lamination-containing butt joint were identified as the inner butt-jointed lamina-tion model, whereas specimens with outer laminalamina-tion- lamination-containing butt joints were identified as the outer butt-jointed lamination model.
Compression test specimen
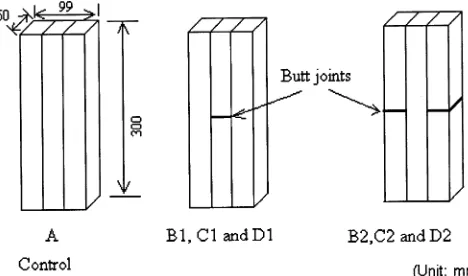
For compression, 300 mm length wood pieces were cut from the originally selected wood samples. Models of three-lamination compression test samples were prepared by glu-ing three of the 300-mm cut pieces for each model. One-component polyurethane glue (Sunstar no. 930; Sunstar, Japan) was used. The butt-joint placements and the glue application at the butt joint for the three-lamination model were fabricated according to the following specifica-tions (Fig. 1).
A: continuous lamination without a butt joint as a control B1: glued butt joint in the inner lamination
B2: glued butt joints in the outer laminations C1: nonglued butt joint in the inner lamination C2: nonglued butt joints in the outer laminations D1: 2 mm clearance in the inner lamination D2: 2 mm clearance in the outer laminations
The thickness of the individual lamination for the compres-sion samples was 33 mm. The final dimencompres-sions of the lami-nated model were 60 99 300 mm. All the butt joints were located at the middle of the laminated model. Groups D1 and D2, which had 2 mm clearance, were designed to determine the highest strength reduction effect of butt joints on the laminated model. Ten specimens were pre-pared for each group.
Tension test specimen
To determine the tension, the selected lumber samples were further planed into 30 mm thickness. Wood pieces of 800 mm length were cut from the lumber samples. The three-lamination model containing butt joints were pre-pared by gluing three of the 800-mm cut pieces using the same polyurethane glue type that was used for preparing the compression specimens. Each of the lamination models was further cut through the wide face into three test pieces. Final planing was done to produce a smooth-faced, glued, lamination tension piece.
The application of glue at the butt joints and the butt-joint placements for the three-lamination model for the tension test were grouped as follows (Fig. 2).
A: small sample specimen as a control B1: glued butt joint in the inner lamination B2: glued butt joints in the outer laminations C1: nonglued butt joint in the inner lamination C2: nonglued butt joints in the outer laminations
The cross-sectional area of the lamination containing a butt joint was 10 30 mm. The dimensions for lamination mod-els containing an inner butt joint (i.e., groups B1 and C1) were 10 60 800 mm, and that of lamination models containing outer butt joints (i.e., groups B2 and C2) were 10 90 800 mm. All the butt joints were located at the
Fig. 1. Design of the butt joint in the compression test. A is the control sample. B1 and B2 have glue application at the butt joints. C1 and C2 have no glue application at the butt joint. D1 and D2 have 2-mm clearance between the ends of the lumber pieces in the lamination
middle of the laminated model. To reduce the effect of bearing stress due to pin connections during the tension test, 10-mm S-F-P board and 12-mm plywood were glued to either side of the test piece at the top and bottom parts, as shown in Fig. 2. Two 30-mm diameter holes were drilled over a span of 600 mm across the center of the specimen for the pin connections of the test setup (Fig. 2). Twelve speci-mens were prepared for each group.
Test method
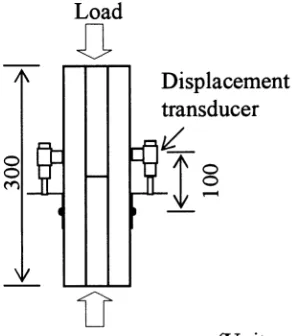
The compressive and tensile tests were conducted using hydraulic test machines with static loading capacities of 500 and 100 kN, respectively. The compression test setup is shown in Fig. 3, and the tension test setup is shown in Fig. 2. Displacement for the compressive test was measured using two displacement transducers over a distance of 100 mm with the butt joint at the center. The displacement trans-ducer was at least 0.001 mm.
For the tension test, the specimen was set between the grips such that the butt joint was at the mid-span position of the 600 mm free span. Displacement for the tensile test was measured using two strain gauges placed at the center of the specimen. The length of the strain gauge used for the ten-sion test was 10 mm.
Each specimen was tested to failure to determine the ultimate compressive and tensile stress and the static MOE. After the test, the moisture content and specific gravity of the specimens were measured using ASTM 2395-93 methods.7
The specific gravity measurement was based on the oven-dried weight and volume at the moisture content during the test.
Method of evaluation
To determine the effect of the butt-joint variables, the glued butt-jointed lamination model was compared with the nonglued jointed lamination model, and the inner butt-jointed lamination model was compared with the outer
butt-jointed lamination. The apparent stiffness was calcu-lated from the basic stress – strain relation. To assess the reduced cross section due to the 2-mm clearance in groups D1 and D2 during the compression test, the model calcula-tion developed by Dansoh et al.3
for butt-jointed glulam was applied to estimate the effective stiffness. The ultimate stress was calculated from the maximum load during the test. The butt-joint efficiencies for both the compression and tension tests were calculated as a ratio of the ultimate stress of the butt-jointed specimens to the ultimate stress of the control specimens. The load–displacement curves of the compression test were used to analyze the deformation characteristic of the joints in the lamination as subjected to compressive stress.
A two-sample t-test assuming equal variance8,9
was per-formed at the 5% significance level to assess whether statis-tically significant differences existed between the stiffness and strength properties of the various butt-joint placements and glue applications applied during the test. An attempt was made to estimate the 5% exclusion lower limits of the strength values using normal and Weibull distributions. For the parameters of the normal distribution, Student’s t-distribution was used considering the small sample size. The mean and sample standard deviation for each test group was calculated, and the 5% exclusion lower limit was calcu-lated as follows
X0 05. µ ts
where X0.05 is the 5% exclusion lower limit; t is the Student’s
t statistic; µ is the mean; and s is the sample’s standard deviation. A computer program was written to construct the probability plot, which was used to estimate the parameters of the Weibull probability function.10
The 5% exclusion limits can be calculated11
as follows
X0 05 x0
1
0 95
. η .
(
)
[
]
where x0, , and η are the location, shape, and scale
param-eters of the Weibull distribution, respectively.
Results and discussion
Compression
The apparent stiffness of the glued butt-jointed lamina-tions (groups B1 and B2) was higher than the nonglued laminations (groups C1 and C2) by 13% and 39% for the inner and outer butt joints, respectively (Table 3). In a compression test on short butt-jointed columns, Sasaki et al.6
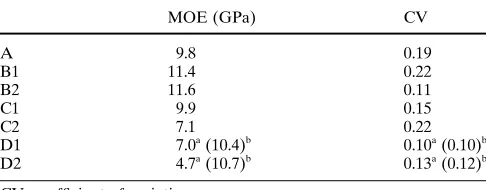
indicated that the glued butt-jointed column had 15% higher stiffness properties than the nonglued butt-jointed column. The increase in stiffness was due to the fact that the glued butt joint acted as a hardened plate, enabling stress transmission through the glued butt joint, resulting in im-proved stiffness. The t-test analysis (Table 2) performed indicated that glue application had a statistically significant effect on stiffness for the outer butt-joint placement but not for the inner butt-joint placement (α 0.05). The average moisture content and specific gravity for the compressive test were 15.4% and 0.43%, respectively.
Table 1. Mean ultimate compressive stress, strength efficiency, and 5% exclusive limits for the compression test
Groupa Mean (MPa) Butt joint 5% Lower limits (MPa)
σ SD
efficiency
Normal Weibull
(σ/A)
L5% L5%/A L5% L5%/A
A 29.96 5.15 1.00 26.08 1.00 24.24 1.00
B1 28.81 4.47 0.96 25.51 0.98 22.86 0.94
B2 28.38 3.22 0.95 25.95 0.99 25.73 1.06
C1 28.60 3.48 0.95 25.97 1.00 25.64 1.06
C2 28.17 2.29 0.94 26.44 1.01 26.44 1.09
D1 23.69 3.52 0.70 21.04 0.81 18.80 0.78
D2 27.11 4.56 0.90 23.67 0.91 20.55 0.85
σ, ultimate compressive stress; σ/A, joint efficiency for ultimate compressive stress; L5%, 5% lower limits for ultimate compressive stress using normal and Weibull distributions
aThere were 10 specimens tested for each group
Table 2. Two-sample t-test assuming equal variance for differences in butt-joint variables for the compression test at 0.05 significance level
Constant variable Source of MOE Strength tcritical
variation
P t P t
Inner joint B1,C1 0.129 1.592 0.908 0.117 2.101
Outer joint B2,C2 0.000 7.309 0.867 0.169 2.101
Glued joint B1,B2 0.770 0.297 0.805 0.250 2.101
Nonglued joint C1,C2 0.001 4.225 0.746 0.329 2.101
MOE, modulus of elasticity
Characteristics of load–displacement curves for the compression test
Typical load–displacement curves for the compression test are illustrated in Fig. 4. Groups A, B1, B2, and C1 had identical load–deflection curves, increasing linearly at the beginning and changing to a smooth curve up to the ulti-mate load. The load–displacement curve of group C2 with outer butt joints and the 2-mm clearance lamination model (D1 and D2) gave not only larger deflections per unit load, they exhibited two linear phases. Group C2 showed an ap-parent yield point between the two linear phases. Groups D1 and D2 had a large displacement with a reduced load between the linear phases, indicating clearance in the lami-nations of the specimen. The yielding between the two lin-ear phases in C2 indicates the loading processes when the butt joints in the compression face have closed up enough to transmit compressive stress across the contact ends of the lumber pieces in the lamination. In effect, this raised the effective load-carrying capacity of the specimen. The results obtained for the load–displacement curve seemed to agree with the previous study conducted on butt-jointed lamina-tion glulam by Dansoh et al.3
Tension
The mean ultimate tensile stress of the control test was 90.07 MPa (Table 4). The glued butt-jointed lamination groups had apparent tensile strengths of 47.38 and Table 3. Stiffness properties for the compression test
MOE (GPa) CV
A 9.8 0.19
B1 11.4 0.22
B2 11.6 0.11
C1 9.9 0.15
C2 7.1 0.22
D1 7.0a (10.4)b 0.10a (0.10)b
D2 4.7a (10.7)b 0.13a (0.12)b
CV, coefficient of variation
aCalculation assuming full cross section without considering the 2-mm clearance
40.42 MPa for groups B1 and B2, respectively, and the nonglued butt-jointed lamination groups had 47.21 and 40.99 MPa for groups C1 and C2, respectively. The butt-jointed groups exhibited a considerable reduction in tensile strength compared to the control specimen. The butt-joint efficiency ranged from 0.45 for B2 to 0.53 for B1 and C1 (Table 4). Failure in the butt-jointed laminations was ob-served to be initiated at the tips of the butt joints, propagat-ing along the weak grain direction, which in effect reduced the effective cross section to produce a brittle failure. Dur-Fig. 4. Typical load–displacement curves for the compression test
Table 4. Mean ultimate tensile stress, strength efficiency, and 5% exclusive limits for the tension test
Groupa Mean (MPa) Butt joint 5% Lower limits (MPa)
σ SD
efficiency
Normal Weibull
(σ/A)
L5% L5%/A L5% L5%/A
A 90.07 16.81 1.00 78.92 1.00 66.77 1.00
B1 47.38 9.87 0.53 40.83 0.52 34.64 0.51
B2 40.42 7.69 0.45 35.32 0.45 33.87 0.51
C1 47.21 7.69 0.53 38.52 0.49 28.97 0.43
C2 40.99 13.11 0.46 37.33 0.47 35.60 0.53
σ, ultimate tensile stress; σ/A, joint efficiency for ultimate tensile stress; L5%, 5% lower limits for ultimate tensile stress using normal and Weibull distributions
aThere were 12 specimens tested for each group
ing the loading process the internal stress path is deviated at the butt joints, resulting in stress concentration at the tips of the butt joints to initiate failure, resulting in reduced tensile strength. The groups containing inner butt-jointed lamina-tion (i.e., B1 and C1) had higher strength values than the outer-jointed lamination groups (i.e., B2 and C2) (Table 4). The t-test analysis showed that both placement of the butt joint and glue application had no significant effect on the apparent tensile strength of the butt-jointed lamination model at the 0.05 significance level (Table 5). The 5% exclu-sive lower limits of the apparent tensile strength values calculated from the Weibull distribution were lower than that of the normal distribution.
The apparent stiffness for the tension test ranged from 10.51 GPa for C2 to 11.81 GPa for B1 (Table 6). The t-test analysis, however, showed no significant differences in the stiffness properties among the tension groups. The average moisture content and specific gravity for the tension test were 13.0% and 0.44, respectively.
Table 5. Two-sample t-test assuming equal variance for differences in butt joint variables for the tension test at 0.05 significance level
Constant variable Source of MOE Strength tcritical
variation
P t P t
Inner joint B1,C1 0.142 1.523 0.972 0.036 2.074
Outer joint B2,C2 0.218 1.269 0.836 0.210 2.074
Glued joint B1,B2 0.113 1.653 0.067 1.928 2.074
Nonglued joint C1,C2 0.572 0.574 0.144 1.515 2.074
Table 6. Stiffness properties for the tension test
Group MOE (GPa) CV
A 11.66 0.07
B1 11.81 0.09
B2 11.12 0.09
C1 10.88 0.17
Conclusions
The application of glue at the butt joint in a compressive lamination model has a performance advantage in terms of stiffness over the nonglued butt joint for the outer-joint lamination model. For the glued butt joint, placement of the joint had no statistically significant effect on the stiffness of the compression; whereas for the nonglued butt joint, place-ment of the joint had a statistically significant effect on the stiffness of the compression. Neither glue application nor placement of the joint had a statistically significant effect on compressive strength. There were no significant differences between the glued and nonglued butt joints in terms of either tensile strength or stiffness.
References
1. American Society for Testing and Materials (1996) Standard prac-tice for establishing stresses for structural glued laminated timber (glulam). ASTM D 3737-96. ASTM, West Conshohocken, PA 2. Falk R (1997) Design and performance aspects of United States
and European glulam. In: Proceedings of the conference on
re-search standardization applications. Institute for Steel Construc-tion, Wood ConstrucConstruc-tion, and Industrial ConstrucConstruc-tion, Graz, Aus-tria, pp C/2-1–C/2-21
3. Dansoh AB, Ueda K, Hirai T (2002) Bending strength and stiffness analysis of butt-jointed glulam beams for residential construction. For Prod J 52(9):82–87
4. Hirai T, Sawada M (1979) Stiffness and load carrying capacity of square-notched beams. 1. On the estimating of the effective stiff-ness (in Japanese). Res Bull Coll Exp For Coll Agric, Hokkaido Univ 36:387–420
5. Hirai T, Sawada M (1980) Stiffness and load carrying capacity of square-notched beams. 3. On maximum failure moments (in Japa-nese). Res Bull Coll Exp For Coll Agric, Hokkaido Univ 36:759– 788
6. Sasaki T, Koizumi A, Jensen JL, Iijima Y, Tamura Y, Komatsu K (1999) End joint with glued in hardwood dowels in timber con-struction. 1. (in Japanese). Mokuzai Gakkaishi 45:1–76
7. American Society for Testing and Materials (1994) Standard test method for specific gravity of wood and wood-base materials. ASTM D2395-93. ASTM, West Conshohocken, PA
8. Hinkelmann K, Kerpthorne O (1994) Design and analysis of experiments. Vol 1: Introduction to experimental design. Wiley, New York, pp 145–218
9. Montgomery DC (1997) Design and analysis of experiments, 4th edn. Wiley, New York, pp 20–125
10. Dodson B (1994) Weibull analysis. American Society of Quality Control. Quality Press, Milwaukee, WI, pp 15–90