Article
1
Assessing the Effect of ADS-B Message Drop Out in
2
Detect and Avoid of Unmanned Aircraft System
3
using Monte Carlo Simulation
4
Asma Tabassum1 and William Semke2
5
1 University of North Dakota; [email protected]
6
2 University of North Dakota; [email protected]
7
* Correspondence: [email protected];
8
9
Abstract: This work analyzes the severity and risk associated with Automatic Dependent
10
Surveillance-Broadcast (ADS-B) message drop out in Detect and Avoid (DAA) function of
11
Unmanned Aircraft System (UAS). Performance assessment of the Universal Access Transceiver
12
(UAT) ADS-B message implies that in some cases ADS-B fails to update within a specified update
13
interval, which is referred to as drop out in this work. ADS-B is a fundamental surveillance sensor
14
for both class 1 and class 2 DAA systems. Message loss or drop out has been found as one of the
15
common limitations of the ADS-B system. The key feature of this study is incorporating the update
16
rate of real ADS-B data transmitted from the manned aircraft. The data were received from the
17
Grand Forks International Airport, North Dakota. Monte Carlo method has been adopted to
18
resolve encounter scenarios in the presence of drop out. The change in the alert triggered by the
19
UAS DAA in the presence of ADS-B drop out has been investigated. Furthermore, the risk matrices
20
are created to quantify the associated risk with drop out affected alerts. Simulation results depict
21
that both the duration of drop out and DAA look-ahead time affect the alert-triggering function of
22
UAS. With a small look- ahead window and longer duration of drop out, the number of warning
23
alerts increases. Also, alerts are affected more during an overtaking encounter than that of a
head-24
to-head encounter. A system-level analysis is also carried out to recognize the potential reasons
25
behind the ADS-B drop out.
26
Keywords: UAS; ADS-B; Drop Out; DAA; Well clear; Monte Carlo Simulation; Risk Matrix
27
28
1. Introduction
29
Over the past several years, airspace has become congested with the increasing number of flights
30
[1]. The introduction of Unmanned Aircraft Systems (UAS), also known as Remotely Piloted Aircraft
31
Systems (RPAS), into the National Airspace System (NAS) has further increased the congestion
32
especially below the transition altitude where most of the general aviation aircraft fly. According to
33
the Federal Aviation Administration (FAA), the use of small unmanned aircraft systems (SUAS) for
34
commercial operations has greatly increased in recent years. This is not only for the commercial
35
purpose, but hobbyists are also using this platform for various recreational activities. The FAA also
36
states that more than 6,800 airspace waiver requests were submitted for operations in controlled
37
airspace by the end of December 2016 [2]. While almost half of them were for operations in class D
38
airspace (i.e., smaller airports with control towers), other classes were also requested and regularly
39
flown. These statistics of UAS integration indicate a unified airspace for both manned and unmanned
40
aircraft in the future.
41
The Next Generation Air Transportation System, in short NextGen, is a series of inter-linked
42
programs, systems, and policies that implement advanced technologies and capabilities [3]. ADS-B
43
is the backbone of this NextGen program that utilizes the Global Navigation Satellite System (GNSS)
44
technology to provide the pilot and Air Traffic Control (ATC) with more information which enables
45
an efficient navigation of aircraft in the increasingly congested airspace. The FAA mandated all
46
aircraft must be equipped with ADS-B out by the year 2020 to fly within the designated controlled
47
airspace, as stated in Federal Regulation 14 CFR 91.225 [4]. The General Aviation ADS-B Rebate
48
Program [5] was introduced by the FAA to encourage and help owners to equip aircraft with the
49
required avionics for NextGen. Radio Technical Commission for Aeronautics (RTCA) [6] defines
50
ADS-B as a function on an aircraft or a surface vehicle operating within the surface movement area
51
that periodically broadcasts its position and other information without the knowledge of the identity
52
of the recipients and without expecting acknowledgments. ADS-B is a cooperative system because it
53
requires common equipage for aircraft, or vehicles on the airport surface, to exchange information. It
54
also provides aircraft state information such as horizontal position, altitude, vector, velocity and
55
trajectory intent information. In the United States, ADS-B works on two different frequencies; one is
56
at the 1090 MHz Extended Squitter and the other is UAT at 978 MHz.
57
According to Minimal Operational Performance Standard (MOPS) for UAS [7], UAS Detect and
58
Avoid (DAA) will have two different classes of surveillance systems onboard. Both the class 1 and
59
class 2 will have ADS-B In onboard. As the onboard computer will make use of surveillance sensor
60
data to trigger alert in the absence of the “human eye,” it is crucial to have robust and efficient
61
surveillance sensors. However, studies have shown that, both the 1090ES and UAT ADS-B are prone
62
to significant message degradations [8][9][10][11][12][13][14][15][16]. One of the drawbacks of
ADS-63
B is message loss or dropout. In our previous studies, ADS-B has shown significant message loss
64
along with different message anomalies [14][15][13][16]. In this work, the severity and risk associated
65
with ADS-B drop out in DAA function are investigated utilizing Monte Carlo Simulation. Two
66
different encounter scenarios are generated using the aircraft dynamic model parameters. This
67
analysis resolves how ADS-B message drop out could affect UAS DAA alerting if used as a single
68
mean of surveillance without any ATC interaction. Different durations of ADS-B update rate that are
69
detected in the data analysis [16] are used as input to the encounter simulations. Section two provides
70
a background of ADS-B Message dropout and introduces the well-clear metric for evaluating
self-71
separation criteria of UAS. Section three describes the experimental design, assumptions and
72
simulation methods. Section four discusses the simulation results and section 5 relates the drop out
73
to the system level failure, ties to potential technical reasons and discusses how ATC and aerospace
74
are impacted by the occurrence of drop out.
75
2. Background of ADS-B Message Drop out and UAS Well Clear
76
As one of the fundamental components of NextGen, significant researches are ongoing on
77
various aspects of ADS-B. This includes, but is not limited to, security and verification of
78
messages[17][18][19], experimental attack analysis[20][21][22][23][24][25], safety assessment
79
[26][27][28] etc. A handful of studies were found on 1090ES ADS-B data assessment [10][12][8]
80
describing the data integrity, accuracy, error detected and potential risk. Busyairah et al evaluate
81
ADS-B messages collected from London Terminal Area Ground Receiver and describes an
82
assessment framework [26]. This framework provides an outline for evaluating 1090ES ADS-B data
83
performance. This involves comparing onboard GPS data collected from British Airways with
84
received ADS-B data from a ground station [26]. This study showed that ADS-B message failed to
85
update within a specified interval and also revealed that it failed to assign correct Navigation
86
Integrity Category (NIC) and Navigation Accuracy Category for position (NACp) values. Busyairah
87
et al [12] also developed a generalized linear model to mathematically represent ADS-B message
88
discontinuation.
89
2.1. UAT ADS-B Drop Out
90
Our initial work as a part of the FAA ASSURE A6 surveillance criticality team [13] studied drop
91
out in UAT ADS-B. The test data received from Grand Forks International Airport was in GDL-90
format. This is the format of the data interface to the serial communication and control panel ports of
93
the Garmin AT UAT Data Link Sensor, model GDL 90 [29]. A python module was developed to
94
decode the archived data as defined in RTCA DO 282B [30]. The anomalies revealed in step by step
95
assessment can be divided into five distinct categories namely dropout, missing payload, low
96
confident data, data jump and altitude discrepancy [15][16]. A summary of the ADS-B message
97
evaluation is provided in Table 1
98
Table 1: Data Anomaly Summary adopted from [16].
99
Checks/Assessment Anomalies % Failure
FCS Calculation and Authentication
Message Loss 13% of the messages loss prior to parsing
Payload Check Missing Payloads 0.40% of the messages missed one payload
Update Rate Dropout 32.49% of the messages
exhibits dropout Accuracy and Integrity
Check
Non-precision Data 3% of the position data are of non-precision
Kinematic Check Data Jump 0.67% of the participating aircraft showed data jump Kinematic Check Altitude Deviation 93% of the participating
aircraft showed altitude deviation
100
International Civil Aviation Organization (ICAO) listed update rate as one of the important
101
parameters to characterize the performance of any surveillance system [31]. ADS-B is envisioned to
102
provide continuous surveillance and address the limitation of radar systems with a lower update
103
rate. This is one of the most concerning issues because it degrades the situational awareness and
104
increases the risk, especially in a high-density airspace. Figure 1 is a visual presentation of the
105
discontinuation of update rate in a flight.
106
107
Figure 1. Multiple drop outs in a flight. Latitude data is used to represent the data gap. In the X-axis, time is
108
represented as thecurrent time-of-day in whole seconds elapsed since Coordinated Universal Time
109
(UTC) midnight. In the 70 minutes’ flight span, data were missed several times. This flight is
110
randomly chosen to visually represent drop out. Adopted from [16].
111
The continuity of the ADS-B system is measured in seconds at which rate the message received
112
at the ground receiver. The continuity of the data stream is one of the crucial metrics for considering
113
the performance of the surveillance system. The expected continuity or update rate for ADS-B
114
according to ICAO [31] is no more than 2 s, significantly faster than the radar system’s 4–15 s update
115
rate.
116
8 8.05 8.1 8.15 8.2 8.25
x 104 46.8
47 47.2 47.4 47.6 47.8 48 48.2
UTC Timestamp, Second
Lat
itud
2.2. UAS Well Clear
117
Well Clear is the separation standard for UAS similar to the separation standard of manned
118
aircraft, named separation minima[32] The concept of well clear has been proposed as an airborne
119
separation standard to which an unmanned DAA system must adhere to in order to maintain
self-120
separation. [33] Well clear is the condition of maintaining a safe distance from other aircraft so that it
121
would not be the cause of initiate a collision avoidance maneuver by either aircraft. The quantitative
122
definition of well clear separation minima is based on acceptable collision risks in consideration of its
123
operating environment and compatibility with aircraft collision avoidance systems [7]. Horizontal
124
separation minima are based on the time-based parameter, and the vertical separation minima are
125
based on distance. Figure 2 illustrates the well clear volume.
126
dh*
DMOD τmod*
127
Figure 2: Well Clear Volume Representation
128
Well clear thresholds are estimated from the recommendation made by Special Committee -228
129
[7] and the FAA stands with the recommendation with a slight modification of vertical separation
130
changing vertical separation thresholds from 750 feet to 450 feet. Table 3 represents the well-clear
131
definition thresholds.
132
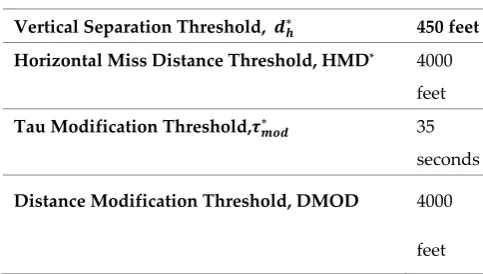
Table 2. Well Clear Thresholds
133
Vertical Separation Threshold, 𝒅𝒉∗ 450 feet Horizontal Miss Distance Threshold, HMD* 4000
feet Tau Modification Threshold,𝝉𝒎𝒐𝒅∗ 35
seconds
Distance Modification Threshold, DMOD 4000
feet
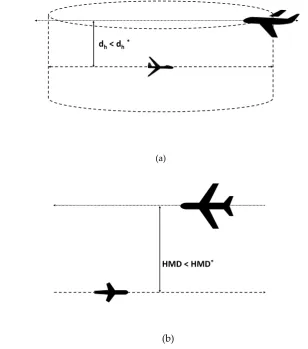
Hence, the loss of well clear (LoWC) can be defined as the situation where UAS is near with
134
another aircraft such that the following three conditions are concurrently true:
135
i. Current Vertical Distance, dh ≤ dh*
136
ii. Horizontal Miss Distance, HMD ≤ HMD*
137
iii. Tau Modification, τmod ≤ τmod*
The loss of well clear in an encounter scenario is represented in Figure 3. Two different views
139
are provided to distinguish horizontal well clear and vertical well clear.
140
dh< dh*
141
(a)
142
HMD < HMD*
143
(b)
144
Figure 3: Loss of Well Clear in a head to head encounter. (a) Side view, (b) Top view. The dashed objects/lines
145
are projections of the future path.
146
The DAIDALUS [33] DAA alerting criteria are based on “time to loss of well clear”. The
well-147
clear detection logic is implemented to determine the time to loss of well clear with a look-ahead
148
time. Look-ahead time is a time interval [34] which is used to determine if two aircraft conflict within
149
that time considering constant velocity. Figure 4 is a simple illustration of time to loss of well clear in
150
an encounter.
151
time to loss of well clear
152
Figure 4. Time to Loss of Well Clear in Horizontal Direction
The predictions made by the detection logic are based on pairwise, constant-velocity projections.
154
The logic returns empty if there is no loss of well clear within the look-ahead time. The time to loss
155
of well clear is used to alert the DAA pilot about potential risk level. Table 4 shows the value of
156
different alerting criteria based on time to loss of well clear.
157
Table 3. Alerting Criteria in DAA of UAS
158
Time to Loss of Well Clear
DAA Alert Level
Attention Response
25 Seconds Warning Immediate Immediate 55 Seconds Corrective Immediate Subsequent
Two different alerts are triggered; one is corrective, and the other is a warning [35]. The DAA
159
corrective alert is intended to get the Pilot In Command’s (PIC) attention, get the PIC to determine a
160
needed maneuver, start PIC coordination with ATC, and is the initiating point at which maneuvering
161
will likely be started based on PIC judgment [36]. The DAA warning alert is intended to inform the
162
PIC that immediate action is required to maintain well clear.
163
3. Simulation Scenario and Assumptions
164
The goal of this analysis is to estimate the number of alerts triggered in enroute airspace given
165
no ATC interaction and ADS-B as a single surveillance mean onboard. To accomplish this, a model
166
is constructed from the perspective of two flights; UAS as ownship and manned aircraft as intruder
167
such that the UAS will experience a loss of well clear T seconds after the beginning of the simulation
168
with complete certainty in the absence of a collision avoidance maneuver and ATC interaction. A
169
Monte Carlo simulation approach has been adopted to resolve what happens with different update
170
rate occurs at time=t. The key feature of this simulation is that the input i.e. the update rate is derived
171
from the actual ADS-B data from manned aircraft. Hence, it exhibits the actual ADS-B update rate
172
properties in the current airspace. The function detection_WCV [7] was used to calculate the time to
173
loss of well clear. This function takes the relative position and velocity of the aircraft and a look-ahead
174
time interval [𝐵, 𝑇] as inputs and returns a time interval [𝑡in, 𝑡out] within [B,T]. B is typically 0 and T
175
represents the look-ahead time. If tin ≤ tout, the tin represents time to LoWC and tout represents the time
176
to exit LoWC, assuming constant velocity. The returned time interval is empty, i.e., tin > tout, if the
177
aircraft are not predicted to be a LoWC state within the interval [𝐵, 𝑇]. The complete description of
178
the logic can be found in [33].
179
3.1. Encounter Generation
180
A constant velocity model is assumed to generate the encounters. The velocity can be
181
represented by
182
𝑉 = 𝐺𝛽 𝑣
183
where Gs is ground speed, β is the bearing and vv is the vertical speed. The ownship position is
184
known as well as the velocity. To encode the encounter three other parameters are utilized. They are:
185
• Look-ahead time, T. This is the time after which the UAS will experience a loss of well clear
186
assuming continues velocity projection
187
• R, the relative distance between two aircraft at the beginning of the simulation and
188
• θ, the angle of approach at the well clear volume.
Therefore, using these parameters several encounter scenarios can be generated. So, the model
190
can be described as
191
𝑀 = {𝑉 , 𝑉 , 𝑇, 𝑅, 𝜃}
192
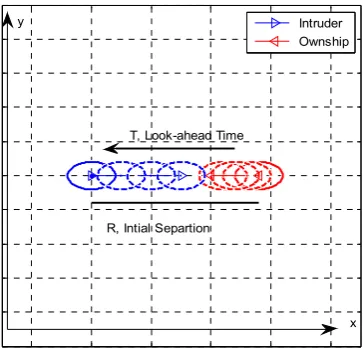
Figure 5 illustrates a simple head-to-head encounter in 2-D plan.
193
194
Figure 5: Head-to-Head Encounter in 2-D plane
195
Using a constant-velocity model, two most common scenarios; head-to-head and overtaking
196
were generated for this study. Hence, θ, the angle of approach will be 0 and 180 consecutively.
197
3.2. Input Data Generation
198
The empirical data utilized in this study came from our previous studies [16][15] and transmitted
199
from actual ADS-B from the manned aircraft. A total of 12852609 messages archived though four
200
weeks were analyzed. The preliminary analysis of the test data demonstrates that approximately
201
67.51% of the messages were updated within the specified update rate. Dropouts were those 32.49%
202
instances where the update rate is greater than or equal to 3s . Table 4 illustrates the update rate
203
category based on the duration of update interval. The frequency of each drop out occurrence was
204
calculated based on the total message received. The update rate categorized into eight different group
205
and the frequency of each group’s dropout occurrence is provided in the Table 4.
206
Table 4: Update Rate Categorizations
207
Category Duration Frequency Group 0 Within 3 seconds 0.6752 Group 1 3 seconds to 5 seconds 0.3081 Group 2 5 seconds to 15 seconds 0.0140 Group 3 15 seconds to 30 seconds 0.0100
Group 4 30 seconds to 60 seconds 0.0085 Group 5 60 seconds 120 seconds 5.4031E-04 Group 6 120 seconds to 300 seconds 2.2148E-04 Group 7 More than 300 seconds to less than
600 seconds
7.3177E-05 Intruder Ownship
x y
As the frequency of occurring a group 7 drop out 7.3177E-05, to achieve desired level accuracy
208
the number of runs must be 105. An update rate matrix is created based on the frequency of drop out
209
on our datasets.
210
3.3. Simulation Assumptions
211
The horizontal velocity for the manned aircraft is 200 knots and the UAS is 80 knots, and these
212
are kept constant. According to the US Department of Defense (DoD), for a small UAS, the maximum
213
airspeed must not exceed 100 knots [37], we arbitrarily chose the value as 80 knots. The values chosen
214
are meant to be representative velocities for each of the aircraft. Both aircraft are assumed to fly level
215
flight. As the detection logic predicts the LoWC within look-ahead time, three different look-ahead
216
time were used to study the severity of dropout duration. The first look-ahead time, T chosen was
217
180 seconds and the second and the third look-ahead times were 120 seconds and 60 seconds,
218
respectively. The different time windows were chosen to mimic the situation where drop out occurs
219
at different time. Each simulation trial consists of one encounter that may experience drop out and
220
alert will be generated given no air traffic control intervention. Also, it assumed ADS-B as a sole
221
surveillance mean which implies no other traffic data can be obtained if the onboard ADS-B
222
surveillance system fails. Each simulation runs as follows:
223
i. Initialize ownship and intruder position, starts calculating with constant velocity projection
224
ii. At T, insert the update rate. Note that, the update rate might be a drop out depending on the
225
assigned probability
226
iii. If update rate inserted > T, consider the loss of well clear
227
iv. If tloss<= 55 seconds at the immediate step, consider count an alert either corrective (1 or 2) or
228
warning (3 or 4) depending on the time to loss of well clear value otherwise continue
229
v. If an alert is found terminate run and go back to step i.
230
DAA computer discards an aircraft as a potential threat if the data is not updated for a certain
231
time-period. This points to the fact that in the event of drop out, a potential threat might be excluded
232
and will not be considered as a threat even when the threat may still be present. This leads to the
233
generation of sudden alert after the regaining the specified update rate. Therefore, these alerts are
234
called drop out affected alert in the analysis. To further understand the effect of alert, the corrective
235
and warning alerts are categorized into two types based on how much time has left for the pilot to
236
respond. Total response time is a measure of the time it takes a UAS operator to upload a final
237
maneuver resolution to the aircraft in response to a traffic alert [38]. Studies [38][39] show that the
238
total response time depends on the UAS DAA display as well as the alerts, inter-action time with
239
ATC, and pilot workload. DAA MOPS [7] specifies minimum time for a pilot to respond to an alert
240
is approximately 15 seconds during a corrective alert and approximately 10 seconds during a warning
241
alert. The greater the time window i.e. time to loss of well clear, the greater the response time. Hence,
242
the severity increases as the time to loss of well clear decreases. This time is calculated as the time
243
between the initial appearance of the traffic alert and the final maneuver upload to the UAS. The
244
classification of alert based on the response time is illustrated in Table 5.
245
Table 5: Alert Classification
246
DAA Alert Level
Response time Type
Corrective 15 seconds 1 Less than 15 seconds 2
A single Monte Carlo simulation with 100,000 trials is carried out. According to the encounter
247
setup, drop out will occur at the beginning of the look-ahead time. The number of alerts triggered is
248
determined. The alert count is based on the “time to loss of well clear.” If the time to loss of well clear
249
is less than or equal to the alert threshold, the associate alert is assumed to be triggered. For example,
250
if the “time to loss of well clear” is less than 25 seconds, a warning alert is counted. If the “time to
251
loss of well clear” is greater than 55 seconds, it is counted as a successful alert as it would eventually
252
generate an alert on time.
253
When any dropout duration was higher than the look-ahead time, those are automatically
254
considered as the loss of well clear, as no information is available over the look-ahead time. At the
255
event of data loss, the DAA logic does not predict the encounter in a timely manner. This could lead
256
to an abrupt maneuver of the ownship to avoid a potential well clear violation.
257
4. Results and Analysis
258
The number of alerts triggered in three different simulations is provided in Table 6. An alert is
259
counted only when tloss<=55 seconds at the subsequent step after the update rate is inserted. As the
260
look-ahead time decreases the number of warning alerts increases and successful alert number
261
decreases. If there were no dropouts, considering continuous velocity projection all the alerts
262
triggered would be corrective, as DAA would detect the intruder at the appropriate time.
263
Table 6: Total Drop out Affected Alert Triggered in different look-ahead time out of n=10^5 runs
264
Approach Look-ahead time, 180 seconds Look-ahead time, 120 seconds Look-ahead Time, 60 seconds
Loss Warning Corrective Loss Warning Corrective Loss Warning Corrective
Head to
Head
22 2 4 29 20 31 84 687 12750
Overtaking 22 6 27 29 167 1556 84 2419 96716
Simulation results show that most of the alerts generated are corrective alerts. Only a small
265
number of runs created a loss of well clear scenario. Also, as the look-ahead time decreases the
266
number of alerts triggered increases. The change in the look-ahead time allowed to visualize the
267
situation the drop out would take place at a different time. As stated earlier, if after inserting the
268
update rate no alert is generated, it is assumed to a successful alert generation event. This indicates
269
the ownship will experience an alert which is not affected by a drop out. Table 7 provides the overall
270
statistics of the simulation.
271
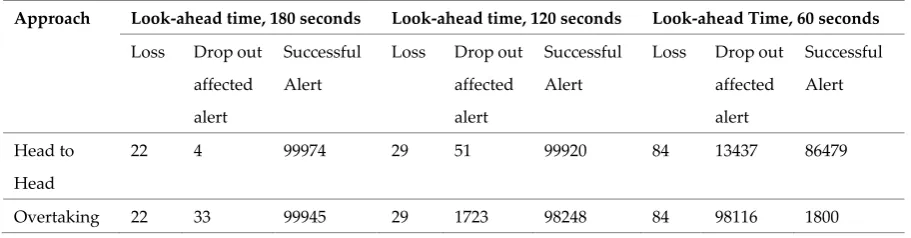
Table 7: Summary of simulations
272
Approach Look-ahead time, 180 seconds Look-ahead time, 120 seconds Look-ahead Time, 60 seconds
Loss Drop out
affected
alert
Successful
Alert
Loss Drop out
affected
alert
Successful
Alert
Loss Drop out
affected
alert
Successful
Alert
Head to
Head
22 4 99974 29 51 99920 84 13437 86479
Overtaking 22 33 99945 29 1723 98248 84 98116 1800
The result from Table 7 indicates that, the alerts affected by drop out as well as by the encounter
273
geometry. The number of alerts increase when the look-ahead time decrease for both scenarios. For
274
the overtaking, the number of alerts generated is higher than a head-to-head encounter scenario for
275
same look-ahead time. In the cases, where UAS will be overtaken by manned aircraft, drop out will
276
affect the UAS safety more severely.
Hazard analyses are performed to identify and define hazardous conditions/risks for their
278
elimination or control. One of the crucial steps is to perform a risk assessment of the severity of
279
consequence and likelihood of occurrence. To assess risk, the FAA and other organizations use Safety
280
Risk Management (SRM), which is a process to analyze, assess, and accept risk for designs, policies,
281
and many other aspects. A risk matrix is one of the tools that helps quantify the amount of risk. The
282
risk matrix considers the severity and likelihood of an event, then using the combination of both
283
interactions, assigns a rating in terms of risk: unacceptable risk, acceptable risk with mitigation, and
284
acceptable risk.
285
A risk matrix for dropout was created based on the percent of dropout occurred in dataset and
286
the value of time to loss of well clear. The likelihood and the severity definition developed for the
287
dropout hazard assessment along with the FAA likelihood definitions, the FAA severity definitions
288
are described in Table 8 and Table 9. Table 8 is derived from the FAA system safety handbook[40].
289
Table 8: Likelihood Definition
290
Frequency Qualitative definition Quantitative Definition
Frequent, A Expected to occur routinely Probability of occurrence per flight hour is within 1 x10⁻³ to 1.00
Probable, B Expected to occur often Probability of occurrence per operational hour is less than 1 x 10⁻⁵, but greater than 1 x 10⁻³ Remote, C Expected to occur infrequently Probability of occurrence per operational hour
is less than 1 x 10⁻⁵, but greater than 1 x 10⁻⁷
Extremely Remote, D
Expected to occur rarely Probability of occurrence per operational hour is less than 1 x 10⁻⁷, but greater than 1 x 10⁻⁹
Extremely Improbable, E
So unlikely that it is not expected to occur, but it is not Impossible
Probability of occurrence per operational hour is less than 1 x 10⁻⁹
The severity of the alert was decided based on the “time to loss of well clear”, tloss value. Table 9
291
summarizes the qualitative definition of the severity level and provides a quantitative measure based
292
on the time to loss of well clear.
293
Table 9: Severity Definition
294
Scale Minor Major Catastrophic
Minimal,1 Minor,2 Major,3 Hazardous,4 Catastrophic,5
FAA
definition
Does not significantly reduce airplane safety (Slight decrease in safety margins). Crew actions well within capabilities (Slight increase in crew workload)
Reduce capability of airplane or crew to cope with adverse operating conditions. Significant reduction in safety margins. Significant increase in crew workload.
Conditions which prevent continued safe flight and landing.
tloss is in between 40
-55 seconds
tloss is in between
25-40 seconds
tloss is in between
10-25 seconds
tloss is less than 10
seconds
tloss=0
A value of tloss = 55 seconds will trigger a corrective alert where as a value of tloss=26 seconds
295
will also trigger a corrective alert, but the risk associated with both alerts is not the same. The severity
296
is dependent on the total response time [39] the pilot will have at the time alert. To quantify the
297
severity based on the tloss, the response time was utilized. The qualitative severity definition is derived
298
from the FAA system safety handbook and the quantitative value was chosen based on the previous
299
study and DAA MOPS. The severity is minimal if the time to loss of well clear is greater than 55
300
seconds which implies a successful alert generation. The severity is minor if during a corrective alert
301
the time to loss of well clear provides at least 15 seconds to the pilot to respond. The severity is
302
considered major if tloss allows the pilot maximum of 15 seconds to respond during the corrective
303
alert. If the time to loss of well clear is less than or equal to 25 seconds, the severity increases and in
304
the worst case can deteriorate the safe flight conditions. An event is categorized as catastrophic if the
305
time to loss of well clear provides less than or equal to 10 seconds response time to the pilot.
306
To generate the risk matrix, the first task is to calculate the probability of dropout affected alert.
307
The probability of triggering an alert affected by drop out is calculated using the following formula:
308
𝑝(𝑎𝑙𝑒𝑟𝑡) = 1
𝑁 𝑛𝑢𝑚𝑏𝑒𝑟 𝑜𝑓 𝑎𝑓𝑓𝑒𝑐𝑡𝑒𝑑 𝑎𝑙𝑒𝑟𝑡
309
This value represents, the probability of drop out affected alert in terms of the simulation run.
310
In order to scale them to flight hour, we calculated the total flight hour summing up the update rate.
311
The probability of drop out affected alert per flight hour is calculated by
312
𝑝(𝑎𝑙𝑒𝑟𝑡) =∑ 𝑢𝑝𝑑𝑎𝑡𝑒 𝑟𝑎𝑡𝑒𝑝(𝑎𝑙𝑒𝑟𝑡)
313
The total flight hour for this simulation is 85.865 hours. Table 8 and Table 9 provides the
314
summary of dropout affected alert probability per flight hour as well as the probability from the
315
number of runs.
316
Table 10: Alert Probability Summary, Head-to-Head Encounter
317
Severity Look Ahead Time 180 seconds 120 seconds. 60 seconds
Corrective Alert , 1 No. of alert 3 17 11877
Probability 3E-5 1.7E-04 1.18E-1
Probability/fl hr 3.4938E-07 1.9798E-06 1.4E-3
Corrective Alert , 2 No. of alert 1 14 873
Probability 1E-05 1.4E-04 8.73E-03
Probability/fl hr 1.1646E-07 1.6305E-06 1.0167E-04
Warning Alert, 3 No. of alert 1 15 391
Probability 1E-05 1.5E-04 3.91E-03
Probability/fl hr 1.1646E-07 1.7469E-06 4.5536E-05
Warning Alert, 4 No. of alert 1 5 296
Probability 1E-05 5E-05 2.96E-03
Probability/fl hr 1.1646E-07 5.8231E-07 3.4473E-05
From table 10, it can be seen that when the look-ahead time window is smaller, the probability of a severe
318
alert increases. For a fixed look-ahead time, the number of corrective alerts generated is higher than the number
319
of warning alerts generated.
Table 11: Alert Probability Summary, Overtaking Encounter
321
Severity Look Ahead Time 180 seconds 120 seconds. 60 seconds
Corrective Alert , 1 No. of alert 15 593 0
Probability 1.5E-04 5.93E-03 0
Probability/fl hr 1.7469E-06 6.9062E-05 0
Corrective Alert , 2 No. of alert 12 963 96716
Probability 1.2E-04 9.63E-03 9.67E-01 Probability/fl hr 1.3975E-06 1.1215E-04 0.0113
Warning Alert, 3 No. of alert 4 154 1702
Probability 4E-05 1.54E-03 1.70E-03
Probability/fl hr 4.6585E-07 1.7935E-05 1.9822E-04
Warning Alert, 4 No. of alert 2 13 717
Probability 2E-05 1.3E-04 7.17E-03
Probability/fl hr 2.3292E-07 1.5140E-06 8.3503E-05
Based on the definition, the number of events that generated an alert on different severity scale
322
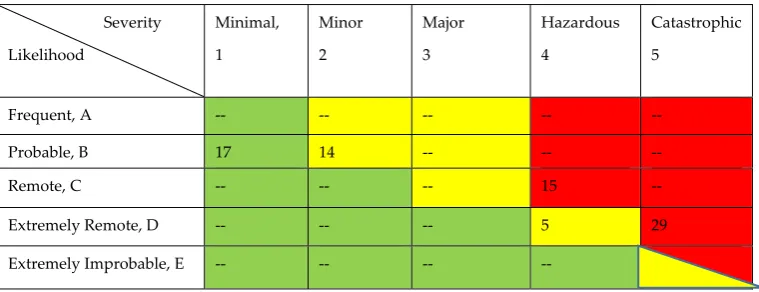
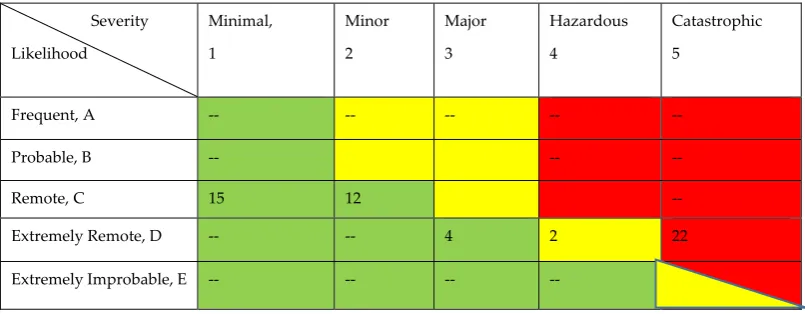
is placed on the risk matrix. The risk rating matrices for three different look-ahead times are
323
represented through Table 12- Table 17. Hence, the number of events placed on the matrix is based
324
on the type of alert and their likelihood as described in table 11.
325
Table 12. Risk Matrix with look-ahead time 180 Seconds, Head-to-Head Scenario
326
Severity Likelihood
Minimal, 1
Minor 2
Major 3
Hazardous 4
Catastrophic 5
Frequent, A -- -- -- -- --
Probable, B -- --
Remote, C -- -- --
Extremely Remote, D 3 3 1 1 22
Extremely Improbable, E -- -- -- --
Table 13. Risk Matrix with look-ahead time 120 Seconds, Head-to-Head Scenario
327
Severity Likelihood
Minimal, 1
Minor 2
Major 3
Hazardous 4
Catastrophic 5
Frequent, A -- -- -- -- --
Probable, B 17 14 -- -- --
Remote, C -- -- -- 15 --
Extremely Remote, D -- -- -- 5 29
Extremely Improbable, E -- -- -- -- --
Table 14. Risk Matrix with look-ahead time 60 Seconds, Head-to-Head Scenario
329
Severity Likelihood
Minimal, 1
Minor 2
Major 3
Hazardous 4
Catastrophic 5
Frequent, A 11877 -- -- -- --
Probable, B -- 873 -- --
Remote, C -- -- 391 296 --
Extremely Remote, D -- -- -- 84
Extremely Improbable, E -- -- -- -- --
Table 15: Risk Matrix with look-ahead time 180 seconds, Overtaking Scenario
330
Severity Likelihood
Minimal, 1
Minor 2
Major 3
Hazardous 4
Catastrophic 5
Frequent, A -- -- -- -- --
Probable, B -- -- --
Remote, C 15 12 --
Extremely Remote, D -- -- 4 2 22
Extremely Improbable, E -- -- -- --
Table 16: Risk Matrix with look-ahead time 120 seconds, Overtaking Scenario
331
Severity Likelihood
Minimal, 1
Minor 2
Major 3
Hazardous 4
Catastrophic 5
Frequent, A -- -- -- -- --
Probable, B 593 963 -- --
Remote, C -- -- 154 13 --
Extremely Remote, D 3 3 1 29
Extremely Improbable, E -- -- -- --
Table 17: Risk Matrix with look-ahead time 60 seconds, Overtaking Scenario
332
Severity Likelihood
Minimal, 1
Minor 2
Major 3
Hazardous 4
Catastrophic 5
Frequent, A -- -- -- -- --
Probable, B -- 96716 -- --
Remote, C -- -- 1702 717 --
Extremely Remote, D -- -- -- 84
The green rectangles represent the acceptable risk, yellow rectangles represent acceptable risk
333
with mitigation, the red rectangles represent unacceptable risk and bottom corner represents
334
unacceptable with a single/ common cause failure. As seen from the previous Tables, when the
look-335
ahead time decreases the number of cases in the yellow and red rectangles increases, i.e. severity
336
increases. A small look-ahead time window made the DAA alert more severe, which indicates that
337
the time at which the dropout occurred is crucial for alert.
338
These results are examples of DAA alerting using ADS-B as a single means of surveillance. It
339
should be noted DAA computer discards an aircraft as a potential threat if the data is not updated
340
for a certain time period, and this time is defined by the user. This points to the fact that in the event
341
of drop out, a potential threat might be excluded and will not be considered as a threat even when
342
the threat may still be present. This might lead to abrupt maneuvers when it reappears and in the
343
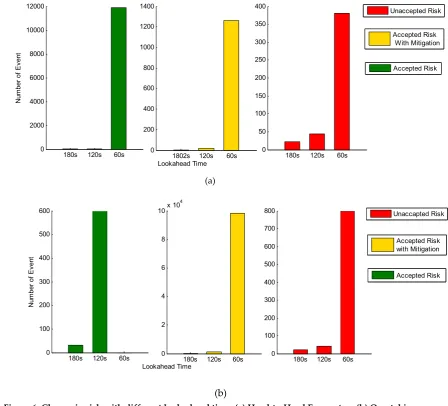
worst-case scenario, a near midair collision. The change in risk with look-ahead time is illustrated in
344
bar charts in Figures 6. It shows that decreasing look-ahead time results in increasing the number of
345
accepted risks with mitigation and unacceptable risk cases.
346
347
(a)348
349
(b)350
Figure 6. Change in risk with different look-ahead time, (a) Head-to-Head Encounter ; (b) Overtaking
351
Encounter. Each figure illustrates the number of alerts affected by drop out of 10^5 simulation for
352
different look-ahead time. Different vertical axis is utilized to outline how the magnitude of the
353
order increased with different look-ahead time. The bar charts imply that the alerts are mostly
354
affected by a smaller lookahead window. Also, it depicts that even though the number of alerts
355
increases with smaller look-ahead window, the unacceptable risk events are minimal.
356
180s 120s 60s
0 2000 4000 6000 8000 10000 12000 N um be r o f E ve nt
1802s 120s 60s
0 200 400 600 800 1000 1200 1400
180s 120s 60s
0 50 100 150 200 250 300 350 400 Accepted Risk Accepted Risk With Mitigation Unaccepted Risk Lookahead Time
180s 120s 60s
0 100 200 300 400 500 600 Nu m be r of E ve nt
180s 120s 60s
0 2 4 6 8 10x 10
4
180s 120s 60s
0 100 200 300 400 500 600 700
800 Unaccapted Risk
Accepted Risk with Mitigation
Accepted Risk
The highest number of events fall into the category of accepted risk with Mitigation. With the
357
provision of ATC interaction and possible multi-sensor fusion, these risk level can be reduced in these
358
cases. There are some risk events that fall under the category “unacceptable” , but the probability of
359
events is in the order of E-07 i.e extremely remote.
360
4. Discussion
361
A system level assessment is carried out to relate the probable causes for the situations
362
encountered in this study. The dropout system-level assessment comprised of two different end
363
systems; transmitter end and receiver end. Based on this, the loss of message from ADS-B at any
364
instant are due to the following factors:
365
i. ADS-B out system failed to send message,
366
ii. Ground Receiver failed to receive and/or decode the message
367
4.1. ADS-B out system fails to send message
368
ADS-B is dependent on the onboard GPS system. Temporary unavailability of the GPS system
369
may result in an error in message generation. After gathering the information from the GPS and flight
370
computer, the ADS-B generates the message. Faults in the ADS-B message assembly can be caused
371
by data processing error, data encoding errors and bugs in the module [27]. Another potential reason
372
is the unavailability of GPS data is the failure of the antenna to transmit the signal.
373
4.2. Ground receiver fails to receive/decode the message
374
The reasons behind the Ground Receiver not being able to receive the message are related to a
375
UAT signal loss event due to multipath, interference and path loss.
376
• Multipath Effect: A theoretical signal analysis on collected air data showed that the
377
maximum error level is 180 ns ( 54 m) which are about twice that of Mode 1090 ES collected at the
378
same bandwidth [41].
379
• Interference: Interference can be from radio frequencies or from electromagnetic fields.
380
During heavy traffic interference from another aircraft, signal might cause ADS-B signal loss. Also, a
381
closely located Distance Measuring Equipment (DME) antenna can degrade the ground receiver
382
performance [30]. Heavy electronic machines installed near airports are another potential reason for
383
electromagnetic interference which affects reception of the ADS-B signal [42].
384
• Path Loss: The power of the transmitted signal decreases as the distance between the
385
transmitter and receiver increases. ADS-B signal is affected by path loss and the probability of
386
message reception decreases with the distance [43].
387
• CRC Check: A cyclic redundancy check (CRC) is an error-detecting code commonly used
388
to detect accidental changes to raw data. ADS-B uses cyclic redundancy check to validate the
389
correctness of the received message [44]. Messages with bit errors are discarded at the reception.
390
The analysis indicates that drop out can affect ATC operation from two different perspectives;
391
Airspace Perspective and Aircraft Perspective. Dropout will affect the airspace when it appears at
392
some distinct position where it is assumed as a lost line of sight communication. Also, if in certain
393
areas the satellite geometry is poor, the ADS-B will lack integrity and accuracy. In both cases, air to
394
ground surveillance will be degraded for that airspace. In these cases, all the aircraft entering the
395
area will suffer in low situational awareness and possibly experience loss of data and/or message
396
discontinuation. In the presence of congested traffic, aircraft in the vicinity would also suffer from
397
degrading situational awareness. The safety of the airspace would not degrade significantly as a
398
whole, but the safety and reliability would be compromised.
5. Conclusion
400
This study made use of hypothetical encounter scenarios to quantify the risk of ADS-B dropout.
401
The risk matrix established is based on the simulation scenarios and represents the risk for three
402
different scenarios studied. The results revealed that with a lower look-ahead time, the severity of
403
dropout increased. As the look-ahead time window decreases, time to loss of well clear changes that
404
in turn changes the type of alert triggered. While a corrective alert needs subsequent action from the
405
Pilot In Command, a warning alert demands immediate action. Thus, change in alert type caused by
406
surveillance data loss degrade the situational awareness. The risk matrix also indicates that with a
407
longer look-ahead time window, the numbers of unacceptable risk cases were less. A longer duration
408
of dropout produces a higher severity risk than the shorter duration dropout. Results also show that
409
the encounter geometry has a significant role in the alert generation and certain geometries might be
410
more vulnerable. In our study, drop out possess more threat to an overtaking encounter. In the
411
absence of the “human eye” onboard, it is important to have a more robust and effective ADS-B
412
system in terms of continuity, availability, and integrity. This is especially true for the class 1 DAA
413
system, where the surveillance information received from ADS-B In is utilized by DAIDALUS to
414
trigger alerts. Although class 1 DAA will have air to air radar for noncooperative traffic along with
415
Mode S surveillance systems to provide control of the airspace, the data ADS-B In utilizes necessitates
416
more resilience to signal and message loss to be effective. Further analysis needs to be carried out for
417
varying encounter geometries and incorporating the traffic density. This way the overall airspace risk
418
due to ADS-B message drop out can be visualized.
419
Acknowledgments:
420
This work is partially funded by ASSURE, an alliance of universities across the United States by the Federal
421
Aviation Administration for System Safety of UAS.
422
Conflicts of Interest: The authors declare no conflict of interest.
423
References
424
1. Vaaben, B.; Larsen, J. Mitigation of airspace congestion impact on airline networks. J. Air Transp. Manag.
425
2015, 47, 54–65, doi:10.1016/J.JAIRTRAMAN.2015.04.002.
426
2. Unmanned Aircraft Systems Trends in UAS and Forecast.
427
3. Next Generation Air Transportation System (NextGen) – NextGen Works Available online:
428
https://www.faa.gov/nextgen/works/ (accessed on Nov 6, 2017).
429
4. FAA Code of Federal Regulations: 14 CFR, Part 91, Sec. 91.113 (2004).
430
5. General Aviation ADS-B Rebate Program Available online:
431
https://www.faa.gov/nextgen/equipadsb/rebate/ (accessed on Nov 6, 2017).
432
6. RTCA Inc Minimum Aviation System Performance Standards (MASPS) for Flight Information
Services-433
Broadcast (FIS-B) Data Link | Engineering360.
434
7. RTCA-SC-228 Draft Detect and Avoid (DAA) Minimum Operational Performance Standards for
435
Verification and Validation. 2015.
436
8. Zhang, J.; Liu, W.; Zhu, Y. Study of ADS-B data evaluation. Chinese J. Aeronaut. 2011, 24, 461–466,
437
doi:10.1016/S1000-9361(11)60053-8.
438
9. Strohmeier, M.; Schafer, M.; Lenders, V.; Martinovic, I. Realities and challenges of nextgen air traffic
439
management: the case of ADS-B. IEEE Commun. Mag. 2014, 52, 111–118,
440
doi:10.1109/MCOM.2014.6815901.
441
10. Syd Ali, B.; Schuster, W.; Ochieng, W.; Majumdar, A. Analysis of anomalies in ADS-B and its GPS data.
442
GPS Solut.2016, 20, 429–438, doi:10.1007/s10291-015-0453-5.
443
11. Taib, N. A.; Ali, B. S. An Analysis of Geometric Altitude Data in ADS-B Messages. 2015.
444
12. Ali, B. S.; Ochieng, W. Y.; Zainudin, R. An analysis and model for Automatic Dependent Surveillance
Broadcast (ADS-B) continuity. GPS Solut.2017, 1–14, doi:10.1007/s10291-017-0657-y.
446
13. Snyder, K. UAS Surveillance Criticality Final Report. 2016.
447
14. Semke, W.; Allen, N.; Tabassum, A.; McCrink, M.; Moallemi, M.; Snyder, K.; Arnold, E.; Stott, D.; Wing,
448
M. Analysis of Radar and ADS-B Influences on Aircraft Detect and Avoid (DAA) Systems. Aerospace
449
2017, 4, 49, doi:10.3390/aerospace4030049.
450
15. Tabassum, A.; Allen, N.; Semke, W. ADS-B message contents evaluation and breakdown of anomalies.
451
In 2017 IEEE/AIAA 36th Digital Avionics Systems Conference (DASC); IEEE, 2017; pp. 1–8.
452
16. Tabassum, A.; Semke, W. UAT ADS-B Data Anomalies and the Effect of Flight Parameters on Dropout
453
Occurrences. Data2018, 3, 19, doi:10.3390/data3020019.
454
17. Yang, A.; Tan, X.; Baek, J.; Wong, D. S. A new ADS-B authentication framework based on efficient
455
hierarchical identity-based signature with batch verification. IEEE Trans. Serv. Comput.2017, 10, 165–175,
456
doi:10.1109/TSC.2015.2459709.
457
18. Kovell, B.; Mellish, B.; Newman, T.; Kajopaiye, O. Comparative Analysis of ADS-B Verification
458
Techniques.
459
19. Kim, Y.; Jo, J.-Y.; Lee, S. A secure location verification method for ADS-B. In 2016 IEEE/AIAA 35th Digital
460
Avionics Systems Conference (DASC); IEEE, 2016; pp. 1–10.
461
20. Schäfer, M.; Lenders, V.; Martinovic, I. Experimental Analysis of Attacks on Next Generation Air Traffic
462
Communication. Appl. Cryptogr. Netw. Secur.2013, 7954 LNCS, 253–271.
463
21. Manesh, M. R.; Kaabouch, N. Analysis of vulnerabilities, attacks, countermeasures and overall risk of
464
the Automatic Dependent Surveillance-Broadcast (ADS-B) system. Int. J. Crit. Infrastruct. Prot. 2017,
465
doi:10.1016/j.ijcip.2017.10.002.
466
22. Andres, C.; Viveros, P. Analysis of the Cyber Attacks against ADS-B Perspective of Aviation Experts.
467
2016.
468
23. Costin, A. Ghost in the Air(Traffic): On insecurity of ADS-B protocol and practical attacks on ADS-B
469
devices.
470
24. Strohmeier, M.; Schäfer, M.; Pinheiro, R.; Lenders, V.; Martinovic, I. On Perception and Reality in
471
Wireless Air Traffic Communications Security.
472
25. Wesson, K. D.; Humphreys, T. E.; Evans, B. L. Can Cryptography Secure Next Generation Air Traffic
473
Surveillance?
474
26. Ali, B. S. A Safety Assessment Framework for Automatic Dependent Surveillance Broadcast ( ADS-B )
475
and its Potential Impact on Aviation Safety Busyairah Syd Ali A thesis submitted for the degree of Doctor
476
of Philosophy of the Imperial College London Centre for Transp. 2013.
477
27. Ali, B. S.; Ochieng, W. Y.; Majumdar, A. ADS-B: Probabilistic Safety Assessment. J. Navig.2017, 70, 887–
478
906, doi:10.1017/S0373463317000054.
479
28. Tabassum, A. PERFORMANCE ANALYSIS OF AUTOMATIC DEPENDENT SURVEILLANCE-
480
BROADCAST (ADS-B) AND BREAKDOWN OF ANOMALIES. 2017.
481
29. GDL® 90 | Garmin Available online: https://buy.garmin.com/en-US/US/p/6436 (accessed on Oct 24,
482
2017).
483
30. Minimum Operational Performance Standard for Universal Access Transceiver (UAT) Automatic
484
Dependent Surveillence Broadcast (ADS-B).
485
31. Guidance Material on Comparison of Surveillance Technologies (GMST). 2007.
486
32. ngoldschmid Application of Separation Minima.
487
33. Muñoz, C.; Narkawicz, A.; Hagen, G.; Upchurch, J.; Dutle, A.; Consiglio, M.; Chamberlain, J.
DAIDALUS: Detect and Avoid Alerting Logic for Unmanned Systems. AIAA/IEEE Digit. Avion. Syst.
489
Conf. - Proc.2015, 5A11-5A112, doi:10.1109/DASC.2015.7311421.
490
34. Monk, K. J.; Roberts, Z. Maintain and Regain Well Clear : Maneuver Guidance Designs for Pilots
491
Performing the Detect-and-Avoid Task. 2017.
492
35. Yyyy, D. D. M. M. Implementation Manual for the Universal Access Transceiver ( UAT ). System2004.
493
36. Monk, K.; Roberts, Z. UAS Pilot Evaluations of Suggestive Guidance on Detect-and-Avoid Displays.
494
2016, 81–85, doi:10.1177/1541931213601018.
495
37. U.S. Army UAS center of Excellence U.S. Army Unmanned Aircraft System Roadmap 2010-2035.
496
38. Kuffner1, M. P.; Guendel2, R. E.; Darrah3, S. J. Investigating Traffic Avoidance Maneuver Decisions of
497
Unmanned Aircraft Pilots.
498
39. Fern, L.; Rorie, R. C.; Pack, J. S.; Shively, R. J.; Draper, M. H. An Evaluation of Detect and Avoid (DAA)
499
Displays for Unmanned Aircraft Systems: The Effect of Information Level and Display Location on Pilot
500
Performance.
501
40. FAA System Safety Handbook, Chapter 3: Principles of System Safety Chapter 3: Principles of System
502
Safety. 2000.
503
41. Chen, Y. H.; Lo, S.; Jan, S. S.; Enge, P. Evaluation & Comparison of Passive Ranging Using UAT and
504
1090. IEEE/ION Position Locat. Navig. Symp.2014.
505
42. Boci, E. RF Coverage analysis methodology as applied to ADS-B design. In 2009 IEEE Aerospace
506
conference; IEEE, 2009; pp. 1–7.
507
43. Langejan, T.; Sunil, E.; Ellerbroek, J.; Hoekstra, J. Effect of ADS-B Characteristics on Airborne Conflict
508
Detection and Resolution. Delft, the Netherlands2016.
509
44. GDL 90 Data Interface Specification. 2007.
![Table 1: Data Anomaly Summary adopted from [16].](https://thumb-us.123doks.com/thumbv2/123dok_us/983097.1597917/3.595.184.421.438.620/table-data-anomaly-summary-adopted.webp)