ISSN 2286-4822 www.euacademic.org
Impact Factor: 3.4546 (UIF) DRJI Value: 5.9 (B+)
Study of Marine Benthic Organisms with Reference
to Environmental Parameters, West Coast of India
KADAM SURENDRA S. Department of Zoology N.B. Mehta Science College Bordi Dist., Thane, M.S., India
AGRAWAL BHARTI A.
Department of Microbiology N.B. Mehta Science College Bordi Dist., Thane, M.S., India
Abstract:
The present study was aimed to cover important environmental parameters of water and sediment, influencing the distribution of benthic community, seasonal variations in the abundance of diversity of benthos, mangrove and associated fauna including avian fauna. It is anticipated that the data generated from this study will provide baseline information for future ecological assessment and comparison. The present study was spread over a period of 13 months. The water and sediment samples collected monthly from February 2014 to February 2015 from the nearshore water and mud flats respectively for
various physic-chemical and sedimentological parameters.
Considering the importance of flora and fauna of this area and constant threat from sewage disposal and developmental activities, regular monitoring of this ecosystem is required to assess its health. Hence the present study is an attempt to covering various physic-chemical, sedimentological parameters and the heavy metal analysis.
Introduction
The community of organisms that live on, or in the bottom of a water body is known as “benthos”. The term “benthos” (from ancient Greek, meaning “bottom, depth, depth of the sea”) was introduced by Ernst Haeckel in 1834.The benthic community is complex, it includes range of organisms from bacteria to plant (phytobenthos) and animals(zoobenthos) and from the different levels of food web( Davide Macro, 2010). Benthic invertebrates play an important role in transitional ecosystems, by filtering phytoplankton and then acting as a food source for larger organisms such as fish, thereby linking primary production with higher trophic levels.
Benthic community are often used as biological indicator because they can provide an information on environmental conditions either due to the sensitivity of single species or because of some general features that makes them integrate environmental signals over a long period of time. The study of organisms which deals with marine habitat is known as marine ecology. The marine fauna is reach and varied. Coastal areas support the economies of many maritime nations through fisheries, petroleum, exploitation, seabed mining, energy and tourism. In addition to these tangible benefits to humanity, coastal and marine ecosystems perform critical ecological functions. The coastal strip is where the human population lives (Vaghela, 2010).
The significant proportion of global human population resides in the coastal areas. It is estimated that 60% of the world population lives near the coast and about 70% of the world’s cities with population exceeding 2.2 million are near tidal estuaries.
within an ecosystem. Ecological diversity is the number of different ecosystem within a larger area. A large ecological diversity allows for species diversity to be abundant at a global level. Genetic diversity is the degree to which members of the same species differ. If a particular species has high genetic diversity, it will have a greater chance of surviving. Almost 80% of all species known to science are terrestrial, (Thorne-Miller et al., 1991). The biggest resource provided by biodiversity is food. Throughout the world fishes and crustaceans are harvested, making up an important part of the world’s diet and providing economic benefits. Another benefits of marine biodiversity is medicine, many marine organisms produce toxins in order to repel predators and pathogens or retard the growth of their competition. These toxins can be harvested from the marine organisms and utilized for developing medicines, (Hunt et al., 2006). Marine biodiversity is the stabilizer of inshore environments (Jie et al., 2001). Marine biodiversity provides indirect benefits to society through ecological stability (Meghe
et al., 1999). The richness of marine diversity can be used to
generate money through tourism as well. Coastal areas can be used for scuba diving, glass bottom boat rides and whale watching cruises to make a profit (Hilehey, 2003).
and the nearby march, particularly as its decays. However, mudflats worldwide are under threat from predicted sea level rises, land claim for housing and development, digging and dredging for navigation and chemical pollution.
Mangroves are unique inter-tidal ecosystems of the tropics, which support genetically divers groups of aquatic and terrestrial organisms, This ecosystem is ideally situated at the inter-phase between the terrestrial and marine environment and support a rich and diverse group of microorganisms (Das et al.,2006). The micro flora and fauna associated with the system serve in controlling pH, leaching of metals and nutrient cycling (Ananthakrishnan,1982).Mangrove ecosystem has a number of ecological functions. They harbour a rich community of plankton, which form source of food for crabs, prawns and fishes. They also form the breeding and nursery grounds for many marine and fresh water fishes, recycle polluted water, prevent floods and bank erosion, reduce the fury of waves and wind and recharge ground water.
Materials and Methods
The present study was spread over a period of 13 months. The water and sediment samples collected monthly from February 2014 to February 2015 from the nearshore water and mud flats respectively for various physic-chemical and sedimentlogical parameters. Water and sediment analyses were carried out following standard methods of Carlberg (1972), Strickland & Parson (1972), Grasshoff et al. (1983), Trivedi & Goeal (1984) and APHA (1992 &1998)
Hydrological study
Water temperature was recorded by a good quality centigrade thermometer with accuracy of +-0.10 0C. The pH of water sample was measured using a calibrated digital pH meter. The estimation of salinity was carried out in the laboratory by argentometric method. For DO water sample was filled in 300 ml BOD bottles immediately after collection and treated with Winkler’s reagent and analysis was carried out using Winkler’s Iodometric method.Direct unseeded method was employed for the determination of BOD, water samples will be collected in standard BOD bottles of 300 ml capacity. The samples were incubated in BOD incubator at 20 0C for 5 days, after which DO was estimated using standard methods. Water samples were collected in 300ml bottles and COD was estimated using standard methods in college laboratory. Nitrate contents in the water samples was estimated by standard method. Phosphate content in the collected water samples was estimated using standard method.
Sedimentological study
and kept in oven at 110 0C.Sample was cooled and weight. Sediment texture was analysed by Buchanan & Kain (1971) method. The total phosphorus content of the sediment was estimated by standard method. The organic carbon content of the sediment was determined by following Walkley & Black (1934). Sediment samples ware separately collected for determination of heavy metals like Cu, Ni, Pb, Cd, Cr and Zn and analyses carried out by plasma emission spectroscopy, AAS and ICP methods. The study of benthic organisms included macrobenthos and meiobenthos from 9 different locations,3each from high tide, mid tide and low tide areas.
Results and Discussion:
The present study was carried out from February 2014 to February 2015 for period of 13 months. Water and sediments samples were collected from three different locations along Dahanu coast. The physicochemical parameters showed variations at different stations during pre- monsoon and post- monsoon season.
Hydrological parameters
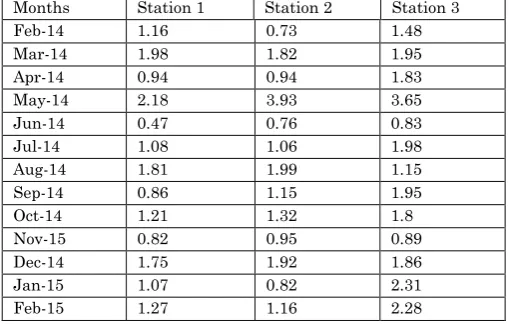
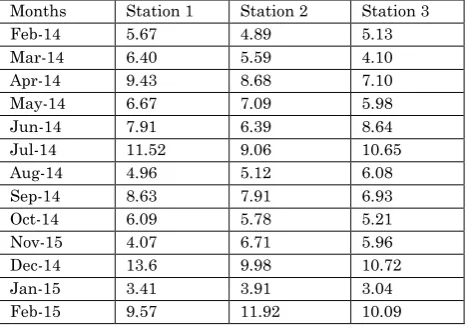
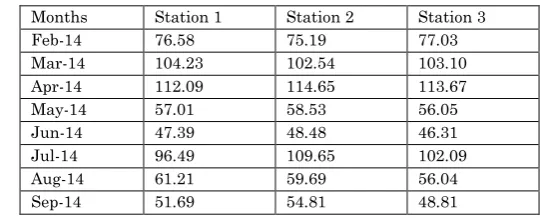
Demand ranged between 0.79 to 2.23 mg/lt with an average 1.36 mg/lt. The maximum BOD value was observed in the month of March and minimum in the month of November. The value of Inorganic Phosphate ranged between 0.47 to 3.93 µ mol/l with an average of 1.54 µ mol/l. The maximum Phosphate value was recorded in the month of May and minimum in the month of June. Total Phosphorus ranged between 3.04 to 13.6 µ mol/l with an average of 7.25 µ mol/l. The maximum value was recorded in the month of December and minimum in the month of January. Nitrite Nitrogen ranged between 1.73 to 3.78 µ mol/l with an average of 2.6 µ mol/l. maximum value was recorded in the month of May and minimum in the month of July. Nitrate Nitrogen ranged between 21.92 to 42.28 µ mol/l with an average of 33.58 µ mol/l. Maximum value was recorded in the month of July and minimum in the month of April. Ammonia ranged between 0.48 to 14.96 µ mol/l with an average of 4.48 µ mol/l. maximum value was recorded in the month of April and minimum in the month of June. Total Nitrogen ranged between 41.63 to 142.08 µ mol/l with an average of 85.89 µ mol/l. Maximum value was recorded in the month of November and minimum in the month of October.
Sediment analysis
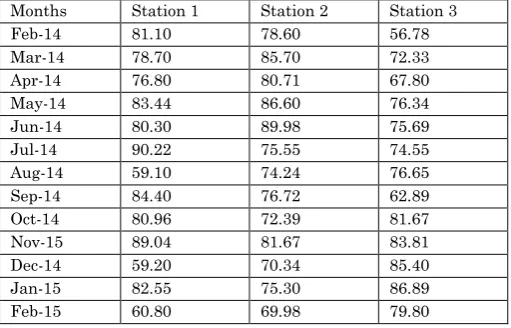
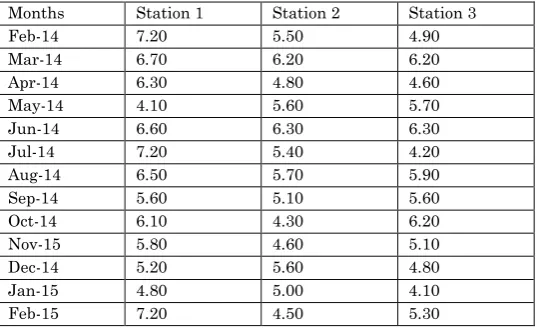
of November. The value of Inorganic Carbon content ranged between 1.67 to 5.1% with an average of 3.19%. The maximum value was recorded in the month of February and minimum in the month of May. Total Phosphorus ranged between 1050 to 4860 µg/g with an average of 2960 µg/g. The maximum value was recorded in the month of December and minimum in the month of November . The Moisture content of the sediment ranged between 56.78 to 90.22% with an average of 74.95%. The maximum value was observed in the month of July and minimum in the month of February. The sand content of the sediment ranged between 4.1 to 7.2% with an average of 5.28%. The maximum content was seen in the month of February and minimum in the month of January.
Heavy metal analysis
Total six metals were analysed during the respective investigation. The concentration of Copper ranged between 18.7 to 81.2 ppm with an average of 43.65ppm. The concentration of Nickel ranged between 0.6 to 28.6ppm with an average of 12.08 ppm. The concentration of Lead ranged between 7.8 to 43.9ppm with an average of 22.91 ppm. The concentration of Cadmium ranged between 1.3 to 4.8ppm with an average of 2.8 ppm. The concentration of Zinc ranged between 12.7 to 95.6ppm with an average of 47.62 ppm. The concentration of Chromium ranged between 45.9 to 311.6ppm with an average of 148.08 ppm.
Tables
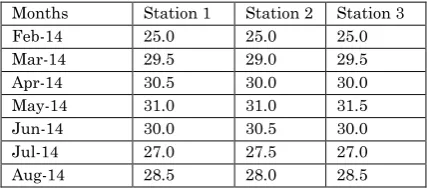
Table 1.1 Variation in temperature (0C) at different stations during
2014-15
Months Station 1 Station 2 Station 3
Feb-14 25.0 25.0 25.0
Mar-14 29.5 29.0 29.5
Apr-14 30.5 30.0 30.0
May-14 31.0 31.0 31.5
Jun-14 30.0 30.5 30.0
Jul-14 27.0 27.5 27.0
Sep-14 29.0 29.5 29.0
Oct-14 27.0 27.0 27.5
Nov-14 28.0 28.5 28.0
Dec-14 29.0 29.0 29.5
Jan-15 26.5 26.0 26.5
Feb-15 25.0 25.5 25.0
Table 1.2 Variation in pH at different stations during 2014-15 Months Station 1 Station 2 Station 3
Feb-14 7.60 7.70 7.78
Mar-14 8.13 8.30 8.48
Apr-14 7.09 8.10 7.97
May-14 8.17 8.43 8.36
Jun-14 8.30 8.49 8.50
Jul-14 7.90 7.80 7.27
Aug-14 8.20 8.27 8.53
Sep-14 8.29 8.31 8.30
Oct-14 8.13 8.26 8.27
Nov-15 8.25 8.26 8.30
Dec-14 7.72 7.68 7.80
Jan-15 7.84 7.89 7.67
Feb-15 7.60 7.69 7.80
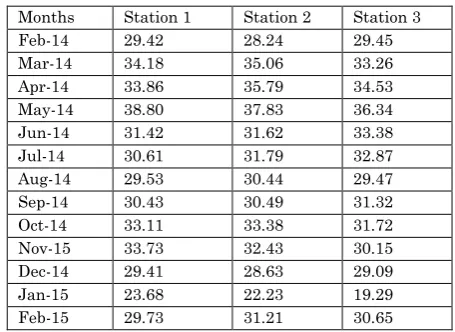
Table 1.3 Variation in salinity (0%) at different stations during 2014-15
Months Station 1 Station 2 Station 3
Feb-14 29.42 28.24 29.45
Mar-14 34.18 35.06 33.26
Apr-14 33.86 35.79 34.53
May-14 38.80 37.83 36.34
Jun-14 31.42 31.62 33.38
Jul-14 30.61 31.79 32.87
Aug-14 29.53 30.44 29.47
Sep-14 30.43 30.49 31.32
Oct-14 33.11 33.38 31.72
Nov-15 33.73 32.43 30.15
Dec-14 29.41 28.63 29.09
Jan-15 23.68 22.23 19.29
Feb-15 29.73 31.21 30.65
Table 1.4 Variation of DO (mg/l) at different stations during 2014-15 Months Station 1 Station 2 Station 3
Feb-14 4.15 4.92 5.02
Mar-14 5.15 5.17 5.36
May-14 4.38 4.60 3.92
Jun-14 3.58 3.71 4.16
Jul-14 4.49 4.63 3.69
Aug-14 5.31 4.13 5.09
Sep-14 3.68 3.39 3.87
Oct-14 4.06 4.18 3.96
Nov-15 4.78 5.02 3.69
Dec-14 5.23 5.08 4.98
Jan-15 4.01 4.71 4.94
Feb-15 4.62 3.56 4.07
Table 1.5 Variation of BOO (mg/l) at different stations during 2014-15 Months Station 1 Station 2 Station 3
Feb-14 2.07 2.12 1.17
Mar-14 1.93 1.86 2.23
Apr-14 1.68 1.45 1.36
May-14 1.11 0.87 1.38
Jun-14 1.16 1.39 1.09
Jul-14 1.23 1.38 1.61
Aug-14 1.08 1.31 0.93
Sep-14 1.12 1.23 1.57
Oct-14 0.95 1.32 1.42
Nov-15 1.97 1.12 0.79
Dec-14 1.68 1.29 1.78
Jan-15 1.51 1.23 1.39
Feb-15 1.93 0.92 1.47
Table 1.6 -Variation of phosphate phosphorus(µ mol/l) at different stations during 2014-15
Months Station 1 Station 2 Station 3
Feb-14 1.16 0.73 1.48
Mar-14 1.98 1.82 1.95
Apr-14 0.94 0.94 1.83
May-14 2.18 3.93 3.65
Jun-14 0.47 0.76 0.83
Jul-14 1.08 1.06 1.98
Aug-14 1.81 1.99 1.15
Sep-14 0.86 1.15 1.95
Oct-14 1.21 1.32 1.8
Nov-15 0.82 0.95 0.89
Dec-14 1.75 1.92 1.86
Jan-15 1.07 0.82 2.31
Table 1.7 -Variation in total phosphorus (µ mol/l ) at different stations during 2014-15.
Months Station 1 Station 2 Station 3
Feb-14 5.67 4.89 5.13
Mar-14 6.40 5.59 4.10
Apr-14 9.43 8.68 7.10
May-14 6.67 7.09 5.98
Jun-14 7.91 6.39 8.64
Jul-14 11.52 9.06 10.65
Aug-14 4.96 5.12 6.08
Sep-14 8.63 7.91 6.93
Oct-14 6.09 5.78 5.21
Nov-15 4.07 6.71 5.96
Dec-14 13.6 9.98 10.72
Jan-15 3.41 3.91 3.04
Feb-15 9.57 11.92 10.09
Table 1.8 - Variation of nitrite nitrogen (µ mol/l) at different stations during 2014-15
Months Station 1 Station 2 Station 3
Feb-14 1.92 2.41 2.53
Mar-14 2.48 2.63 1.93
Apr-14 1.95 2.13 1.78
May-14 3.78 3.48 3.06
Jun-14 2.87 2.68 3.39
Jul-14 2.90 1.73 1.91
Aug-14 3.02 2.87 3.11
Sep-14 1.93 2.48 2.69
Oct-14 2.33 2.18 3.55
Nov-15 1.38 1.97 2.21
Dec-14 3.48 3.12 3.06
Jan-15 3.61 2.86 3.37
Table 1.9 - Variation of nitrate nitrogen (µ mol/l) at different stations during2014-15.
Table 1.10 -
Variation in ammonia nitrogen (µ mol/l) at different stations during 2014-15
Table 1.11 - Variation in total nitrogen (µ mol/l) at different stations during 2014-15.
Months Station 1 Station 2 Station 3
Feb-14 76.58 75.19 77.03
Mar-14 104.23 102.54 103.10
Apr-14 112.09 114.65 113.67
May-14 57.01 58.53 56.05
Jun-14 47.39 48.48 46.31
Jul-14 96.49 109.65 102.09
Aug-14 61.21 59.69 56.04
Sep-14 51.69 54.81 48.81
Months Station 1 Station 2 Station 3
Feb-14 29.08 31.18 29.42
Mar-14 32.85 34.93 30.83
Apr-14 23.26 26.09 21.92
May-14 32.07 28.86 31.78
Jun-14 34.72 35.48 33.87
Jul-14 42.28 41.95 39.83
Aug-14 38.42 37.74 36.89
Sep-14 31.63 32.08 33.72
Oct-14 29.19 31.07 30.88
Nov-15 31.15 33.23 32.85
Dec-14 41.37 40.98 39.81
Jan-15 34.9 30.06 31.15
Feb-15 31.78 32.08 29.15
Months Station 1 Station 2 Station 3
Feb-14 2.79 3.04 1.98
Mar-14 8.54 7.73 9.12
Apr-14 11.68 14.96 9.69
May-14 4.56 7.40 11.31
Jun-14 0.48 1.08 1.32
Jul-14 0.86 1.15 1.37
Aug-14 0.92 1.61 0.98
Sep-14 0.73 1.43 1.62
Oct-14 0.65 1.21 1.08
Nov-15 1.04 1.93 0.87
Dec-14 5.11 6.06 4.90
Jan-15 0.88 1.92 1.60
Oct-14 41.63 43.91 45.03
Nov-15 98.92 142.08 116.63
Dec-14 109.71 117.48 103.01
Jan-15 67.05 62.38 69.81
Feb-15 105.54 113.01 91.73
Sediment Analysis
Table 2.1 Variations in temperature in sediments at different stations during 2014-15
Months Station 1 Station 2 Station 3
Feb-14 28.5 29.0 30.0
Mar-14 26.0 26,5 26.0
Apr-14 24.5 24.0 24.0
May-14 26.0 27.5 27.0
Jun-14 25.5 24.5 25.0
Jul-14 25,5 25.2 25.0
Aug-14 25.0 25.5 25.5
Sep-14 28.0 27.0 27.5
Oct-14 27.5 27.0 27.0
Nov-15 28.0 28.5 28.0
Dec-14 26.5 25.0 26.0
Jan-15 27.0 27.0 27.5
Feb-15 28.0 28.5 28.0
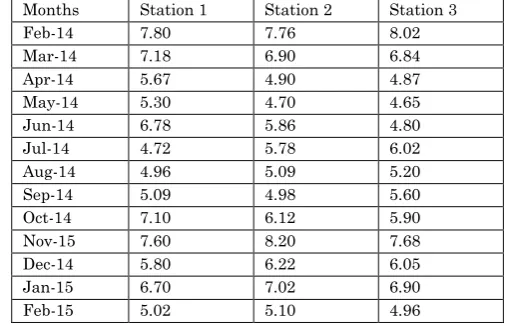
Table 2.2 Variations in pH of sediments at different stations during 2014-15
Months Station 1 Station 2 Station 3
Feb-14 7.80 7.76 8.02
Mar-14 7.18 6.90 6.84
Apr-14 5.67 4.90 4.87
May-14 5.30 4.70 4.65
Jun-14 6.78 5.86 4.80
Jul-14 4.72 5.78 6.02
Aug-14 4.96 5.09 5.20
Sep-14 5.09 4.98 5.60
Oct-14 7.10 6.12 5.90
Nov-15 7.60 8.20 7.68
Dec-14 5.80 6.22 6.05
Jan-15 6.70 7.02 6.90
Table 2.3 Variations in slit content (%) of sediments at different stations during 2014-15
Months Station 1 Station 2 Station 3
Feb-14 35.70 44.60 42.50
Mar-14 38.50 42.70 45.70
Apr-14 42.30 43.10 46.00
May-14 44.70 39.30 43.80
Jun-14 37.90 38.20 46.60
Jul-14 38.50 44.60 44.50
Aug-14 41.20 43.50 38.90
Sep-14 43.70 38.50 44.40
Oct-14 39.60 39.80 42.60
Nov-15 41.20 44.70 41.40
Dec-14 44.60 43.50 40.20
Jan-15 36.20 45.20 38.30
Feb-15 41.80 36.60 40.30
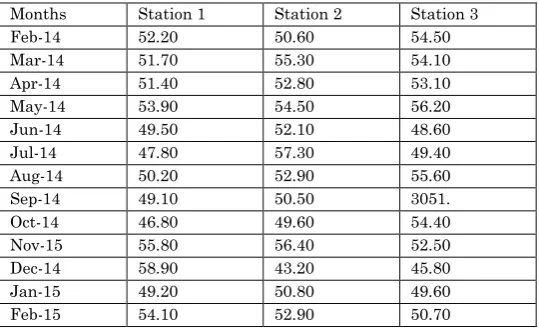
Table 2.4 Variations in clay content (%) of sediments at different stations during 2014-15
Months Station 1 Station 2 Station 3
Feb-14 52.20 50.60 54.50
Mar-14 51.70 55.30 54.10
Apr-14 51.40 52.80 53.10
May-14 53.90 54.50 56.20
Jun-14 49.50 52.10 48.60
Jul-14 47.80 57.30 49.40
Aug-14 50.20 52.90 55.60
Sep-14 49.10 50.50 3051.
Oct-14 46.80 49.60 54.40
Nov-15 55.80 56.40 52.50
Dec-14 58.90 43.20 45.80
Jan-15 49.20 50.80 49.60
Feb-15 54.10 52.90 50.70
Table 2.5 Variations in total phosphorus in sediment (µg/g) at different stations during 2014-15
Months Station 1 Station 2 Station 3
Feb-14 3211 2567 3750
Mar-14 4427 3180 4225
Apr-14 4321 3020 4120
May-14 4190 4410 3725
Jun-14 1280 1200 3495
Jul-14 2926 3129 3389
Aug-14 2560 2551 2990
Oct-14 3420 3122 3892
Nov-15 2780- 2612 1050
Dec-14 3350 3019 4860
Jan-15 3014 3220 3840
Feb-15 3650 4090 3565
Table 2.6 Variations inorganic carbon(% ) in sediment at different stations during 2014-15
Months Station 1 Station 2 Station 3
Feb-14 2.80 5.10 3,79
Mar-14 2.90 3.40 4.90
Apr-14 3.86 4.57 3.45
May-14 2.50 1.67 3.16
Jun-14 3.67 2.76 3.36
Jul-14 2.23 3.12 2.30
Aug-14 3.09 3.69 2.80
Sep-14 2.60 2.76 2.04
Oct-14 3.38 2.18 3.35
Nov-15 4.20 3.20 2.80
Dec-14 3.41 3.09 3.21
Jan-15 2.58 3.22 2.90
Feb-15 3.78 2.34 2.19
Table 2.7 Variations in moisture content (%) of sediment at different stations during 2014-15
Months Station 1 Station 2 Station 3
Feb-14 81.10 78.60 56.78
Mar-14 78.70 85.70 72.33
Apr-14 76.80 80.71 67.80
May-14 83.44 86.60 76.34
Jun-14 80.30 89.98 75.69
Jul-14 90.22 75.55 74.55
Aug-14 59.10 74.24 76.65
Sep-14 84.40 76.72 62.89
Oct-14 80.96 72.39 81.67
Nov-15 89.04 81.67 83.81
Dec-14 59.20 70.34 85.40
Jan-15 82.55 75.30 86.89
Table 2.8 Variations in sand content (%) of sediment at different stations during 2014-15
Months Station 1 Station 2 Station 3
Feb-14 7.20 5.50 4.90
Mar-14 6.70 6.20 6.20
Apr-14 6.30 4.80 4.60
May-14 4.10 5.60 5.70
Jun-14 6.60 6.30 6.30
Jul-14 7.20 5.40 4.20
Aug-14 6.50 5.70 5.90
Sep-14 5.60 5.10 5.60
Oct-14 6.10 4.30 6.20
Nov-15 5.80 4.60 5.10
Dec-14 5.20 5.60 4.80
Jan-15 4.80 5.00 4.10
Feb-15 7.20 4.50 5.30
Table 2.9 Variations in Analytical values of Trace Metals(µg/l) of sediment at different stations during 2014-15
Months Stations Cu Ni Pb Cd Zn Cr
Feb-14
1 42.6 11.3 25.4 2.5 80.9 157.5
2 34.6 0.6 14.7 1.6 90.9 88.9
3 22.3 8.4 20.9 2.1 68.3 102.3
Mar-14
1 54.6 16.5 43.9 2.6 26.9 311.6
2 31.7 9.7 21.6 1.4 41.3 90.3
3 67.8 13.2 12.9 1.8 13.7 116.7
Apr-14
1 37.8 0.8 26.2 1.6 52.9 221.7
2 43.9 16.8 9.8 3.3 25.8 196.4
3 25.6 6.9 13.9 3.7 17..9 54.87
May-14
1 45.7 3.7 38.4 1.9 76.5 90.8
2 20.3 11.2 12.3 2.4 20.7 118.3
3 61.7 28.6 23.9 2.7 41.2 297.0
Jun-14
1 70.4 15.8 34.7 4.4 18.5 290.4
2 23.7 11.6 41.8 3.7 67.8 113.5
3 40.6 2.9 9.4 2.9 45.3 54.7
Jul-14
1 43.8 26.4 32.6 1.7 76.8 221.9
2 33.2 8.9 22.7 2.8 21.9 310.6
3 29.8 12.6 16.8 1.3 12.7 76.8
Aug-14
1 68.1 13.4 9.4 3.4 13.9 121.8
2 46.8 3.9 37.9 1.5 56.5 45.9
3 24.7 6.8 21.3 2.6 19.8 112.0
Sep-14
1 55.7 21.8 29.6 2.5 55.8 180.7
2 33.8 6.1 13.1 3.4 91.7 90.3
3 22.6 13.5 8.9 3.6 70.6 76.9
Oct-14
1 56.4 3.9 41.0 4.8 32.8 290.4
3 18.9 27.6 12.8 4.3 78.0 59.9
Nov-14
1 76.4 21.8 43.3 1.9 47.9 117.8
2 34.1 1.9 20.9 2.9 19.3 289.8
3 68.4 8.5 7.8 3.7 57.8 189.6
Dec-14
1 24.9 21.7 14.3 4.2 65.8 87.3
2 43.7 7.8 21.3 2.4 23.3 119.7
3 63.9 16.3 9.7 3.7 51.8 81.9
Jan-15
1 70.4 23.2 40.2 1.7 19.5 299.4
2 47.8 3.2 28.6 3.7 54.3 123.6
3 81.2 11.6 12.9 2.6 77.8 76.9
Feb-15
1 22.5 23.6 13.2 4.1 95.6 168.5
2 18.7 1.9 23.4 3.9 20.5 49.5
3 47.9 21.3 29.6 2.3 48.8 128.5
Significance of the Study
There are many significant variations in the gross intertidal benthic macrofaunal diversity between the selected coastline of season wise and place wise. The population density of macrofauna is not influenced in the selected coastline but changes in significantly and therefore the seasonal fluctuation in the diversity and density of macrofauna of this selected coastline. The present work will fulfill the lacuna of present ecological status of this selected coastal area and the results of different parameters generates database on marine biodiversity. The study forms the first detailed account of marine benthic organisms with special reference to environmental characteristics. The information generated provides valuable data for future ecological comparisons. Continuous monitoring is required to save this ecologically important coastal area of Thane district and the present project work is significant.
Acknowledgements
We are also thankful to Dr.(Mrs.) A. S. Kulkarni, Principal, N.B. Mehta Science College, Bordi, for her continuous support, motivation and encouragement throughout the research Endeavour.
REFERENCES:
1. Davide, T. and Sigovini, M., 2010. Benthic fauna collection and identification of macrobenthic invertebrates, Ter. Environ. 88, 253-261.
2. Vaghela, A., 2010. Spatial and temporal variations in population dynamics of few key rocky intertidal macrofaunal anthropogenically influenced intertidal shoreline. Ph.D. thesis, Saurashtra University, 278 pp. 3. Throne, M., Boyee and John, C., 1991. The living Ocean :
Understanding and protecting marine biodiversity, Island Press, Washington D. C.Alongi, D.M. and Christoffersen, P., 1992. Benthic fauna and organisms-sediment relation in shallow, tropical mangroves coastal area: influenced of out welled mangroves detritus and physical disturbance. Mar.Ecol.Prog.Ser., 80:229-245. 4. Hunt, B. and Vincent, A.C.J., 2006. Scale and
sustainability of marine bioprocessing for pharmaceuticals. Ambio, 35(2): 57-64.
5. Hilehey, J., 2003. A report on importance of protecting marine biodiversity, 120 pp.
6. Anon, 2001. Status of Indian Shrimp Aquaculture: Overview. Fishing Chimes, 21(6):27-32.
7. Das, S.L., and Khan, S.A., 2006. Marine microbial diversity and ecology: importance and future perspective-Current Science,Vol.19(10):1325-1335. 8. Ananthakrishnan,T.N., 1982. Bio-resourcesEcology.,
Oxfortd and IBH Publishing Co,New Delhi,159 pp. 9. Quadros, G, I., 1995. Study of intertidal fauna of Thane
creek., Ph.D. Thesis, University of Mumbai, 264 pp. 10.Karande, A.A., 1991.Use of epifaunal communities in
11.Choudhury, S.B. and Panigrahi, R.C., 1991. Seasonal distribution and behavior of nutrient in the creek and coastal waters of Gopalpur, East coast of India. Mahasagar-Bull.Nat. Inst. Oceanogr, 24(2):91-98.
12.Carlberg, R.,1972. New Baltic Manual, Cooperative research report series., A No. 29 (International Council of Exploration of the Sea, Denmark), 140 pp.
13.Strickland, J.D.H.and Parson, T.R., 1972. A Practical
handbook of seawater
analysis.,Bull.No.167.Fish.Res.Bd.of Canada .
14.Grasshoff, K., Ehrhardt, M. and Kremling , K.1983. Methods of sea water analysis, Second Edn. Verlag Chemie Gmblt, D-6940, Weinhiem. Printed in the Federal Republic of Germany, 419 pp.
15.Trivedi, R.K. and Goal, P.K., 1984. Chemical and biological methods for water pollution studies., Environmental Publication, Karad,India.122pp.
16.APHA., 1992. Standard methods for the examination of water and wastewater 18th Edition., APHA, Washington, DC. 937pp.
17.American Public Health Association, 1998. Standard methods for the examination of water and wastewater 20th Edition, APHA, Washington, DC.
18.Buchanan, J.B. and Kain, J.B., 1971. Measurement of physical and chemical environment : In methods for the study of marine benthos ., IBP Handbook No.16. Eds. N.A. Holme and A.D. McIntyre. Blackwell scientific Publisher,Oxford,334 pp.
19.Walkley, A. and Black, I. A.,1934. An examination of the Degtjareff method for determination of soil organic matter and a proposed modification of the chromic acid titration method., Soil Sci. 37:29-30.
21.Cuffiney, T.F., Gurtz ,M.E. and Meador, M.R.,1993. Method for collecting benthic invertebrate sample as a part of National water quality assessment program. USGS field report ,93-406.
22.Damodaran, R., 1973. Studies on the benthos of the mud bank of Kerala coast. Bull. Dept. Mar.Sci.Univ.Cochin,6-126.
23.Desai, B. N. and Krishakutty, M., 1967. Studies on benthic fauna on Cochin backwater. Proc. Indian Acad. Sci., 65:123-142.
24.Desikachary, T.V., 1959. Cynophyta. ICAR Monograph on Algae, Indian Council of Agricultural Research, New Delhi, 686 pp.
25.Holme, N.A., 1964. Method of sampling in benthos. Advan. Marine. Biol., 2:171-260.
26.Holme, N.A. and Mc Intyre, A.D., 1971. Methods for study of marine benthos IBP Hand book no.16. Blackwell Sci. Pub. Oxford, Edinburg , 334 pp.
27.Joyadas,T.V., and Damodartan R., 2009. Infaunal macrobenthos along the shelf waters of west coast of India, Arabian Sea. Indian J. Mar.Sci., 38(2) :190-204. 28.Kari, E., 2002. Soft sediment benthic biodiversity on
continental shelf in relation to environmental variability. Mar. Ecol. Prog. Ser., 232:15-27.
29.Menge, B.A., 2000. Tap-down and bottom-up community in marine rocky intertidal habitats. J. EpMar.Biol. and Ecol., 250:257-289.
30.Pavithran, S., Ingole, B.S., Nanajkar, M., Raghukumar, C., Nath, B.N. and Valsankar, A/.B., 2009. Composition of macrobenthos from the central Indian Ocean basin . J. Earth. Syst. Sci., 11:115-121.