O R I G I N A L A R T I C L E
Torque loading tests on the rolling shear strength
of cross-laminated timber
Frank Lam1•Yuan Li2•Minghao Li3,4
Received: 11 February 2016 / Accepted: 3 June 2016 / Published online: 28 June 2016
ÓThe Japan Wood Research Society 2016
Abstract In this study , torque loading tests on small shear blocks were performed to evaluate the rolling shear strength of cross-laminated timber (CLT). The CLT plates in the tests were manufactured with Mountain Pine Beetle-afflicted lumber boards and glued with polyurethane adhesive; two types of layups (five-layer and three-layer) with a clamping pressure 0.4 MPa were studied. The small block specimens were sampled from full-size CLT plates and the cross layers were processed to have an annular cross section. These specimens were tested under torque loading until brittle shear failure occurred in the middle cross layers. Based on the test results, the brittle shear failure in the specimens was evaluated by detailed finite element models to confirm the observed failure mode was rolling shear. Furthermore, a Monte Carlo simulation pro-cedure was performed to investigate the occurrence prob-ability of different shear failure modes in the tests considering the randomness of the rolling shear strength
and longitudinal shear strength properties in the wood material. The result also suggested the probability of roll-ing shear failure is very high, which gives more confident proof that the specimens failed dominantly in rolling shear. It was also found that the torque loading test method yielded different rolling shear strength values compared to the previous research from short-span beam bending tests; such a difference may mainly be due to the different stressed volumes of material under different testing meth-ods, which can be further investigated using the size effect theory in the future.
Keywords Torque loading testRolling shear Cross-laminated timberBrittle fractureFinite element model
Introduction
Rolling shear stress in wood is defined as the shear stress in the radial–tangential plane perpendicular to the grain direction; rolling shear strength and stiffness of wood are much lower than its longitudinal shear strength and stiff-ness [1]. According to the literature [1–6], rolling shear strength normally varies between 18 and 28 % of parallel-to-grain shear strength based on limited test data. In Eurocode 5 [7], a characteristic rolling shear strength value of 1.0 MPa is used for wood independent of its strength class. In timber design, high rolling shear stresses should always be avoided due to the low rolling shear strength of wood.
Cross-laminated timber (CLT) consists of crosswise oriented layers of wood boards that are either glued by adhesives or fastened with aluminum nails or wooden dowels [8]. For general timber design, rolling shear strength and stiffness are not major design properties. For & Yuan Li
Frank Lam [email protected]
Minghao Li
1 Department of Wood Science, University of British
Columbia, 4041-2424 Main Mall, Vancouver, BC V6T1Z4, Canada
2 Department of Wood Science, University of British
Columbia, 2843-2424 Main Mall, Vancouver, BC V6T1Z4, Canada
3 University of British Columbia, Vancouver, Canada 4 University of Canterbury, CNRE, Private Bag 4800,
CLT, however, rolling shear strength and stiffness must be considered in some loading scenarios due to the existing cross layers. For example, when a CLT floor panel is supported by columns, highly concentrated loads in the supporting area may cause high rolling shear stresses in cross layers; the same concerns may arise for designing short-span floors or beams. Therefore, there is a need to evaluate the rolling shear strength and stiffness properties for more practical applications of CLT structures.
ASTM D2718-00 stipulates two test methods (short-span bending test and planar shear test) to evaluate shear properties of wood products [9]. The short-span bending test is to load the specimen with small span-depth ratios to encourage shear failure mechanism; in the planar shear test, shear loads are applied by two metal plates face-glued onto the specimen. Norlin et al. [10] used a short-span bending test to study longitudinal and rolling shear strength properties of a laminated veneer product. Using non-destructive bending vibration tests, Fellmoser and Blass [4] studied the influence of rolling shear modulus on CLT stiffness as well as the relationship between shear deformations and beam span-depth ratios. Mestek et al. [11] studied the influence of shear defor-mations in cross layers on the load-carrying capacity of CLT beams. Zhou et al. [12] used both planar shear tests and short-span bending tests to study rolling shear strength and stiffness properties of CLT specimens made by black spruce. Li [6] performed short-term ramp loading tests in the research of the rolling shear beha-viour of CLT; five-layer and three-layer CLT products were investigated in the tests. In this research, basic short-term rolling shear strength distribution was estab-lished by short-term ramp loading.
The objective of this study is to evaluate the rolling shear strength properties of non-edge-glued CLT plates by the torque loading tests. The CLT plates were manufac-tured mainly by Mountain Pine Beetle-killed lodgepole pine, which is one of the major species in the Spruce-Pine-Fir group in Canada. Another important reason to study CLT made out of the beetle-afflicted wood is to utilize the trees from the beetle-attacked forests [6].
In this study, torque loading tests were performed on CLT tube specimens. Brittle shear failure mode was observed in the CLT tube specimens. To further investi-gate the observed failure mode and the shear stress dis-tribution in the cross layers, a detailed finite-element method was then adopted to simulate the structural behaviour of the CLT tube specimens under the testing conditions. A Monte Carlo simulation procedure was further performed to investigate the probability of dif-ferent shear failure modes in the tests considering the randomness of the rolling shear strength and longitudinal shear strength in wood material.
Experimental methods
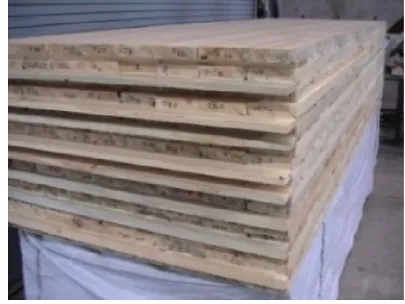
CLT test specimens are shown in Fig.1, and two cate-gories of the non-edge-glued CLT plates laminated with polyurethane adhesive, i.e., five-layer Spruce-Pine-Fir (SPF5) plates and three-layer Spruce-Pine-Fir (SPF3) plates, were studied. Within each category, one rigid mechanical clamping pressure level (i.e., 0.4 MPa) was applied for manufacturing [13]. For convenience, a five-layer Spruce-Pine-Fir plate is simply denoted as an SPF5 plate. Considering the 0.4 MPa pressure applied, this plate is further denoted as SPF5-0.4. Similarly, a three-layer Spruce-Pine-Fir plate pressed under 0.4 MPa is denoted as an SPF3-0.4 plate. Table 1 shows the configurations of these CLT plates, including the board grades, the thickness of laminations, the width of laminations, and the plate dimensions [13, 14]. The grade of lamination in Table1 follows the NLGA (National Lumber Grade Authority) Standard Grading Rules for Canadian Lumber [15], and the Mountain Pine Beetle-afflicted lumber boards in both No.2 and stud grades in Table1 were used for the CLT manufacturing.
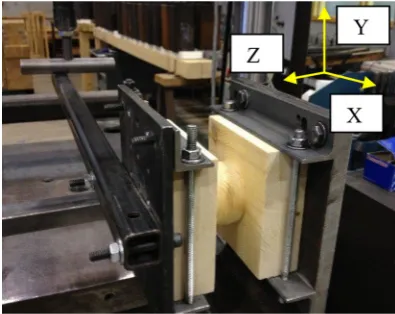
To investigate the rolling shear failure, CLT tube specimens were prepared for the torque loading test, as shown in Fig. 2.
The torque tube specimen included three layers of laminated wood. First, small CLT cubic block specimens were sampled from full-size CLT plates. Then, the middle cross layer was cut and shaped into cylinder volume with an outer diameter of 52 mm by a computer numerical control (CNC) machine. The whole cylinder middle layer came from one piece of cross-laminated board, and this middle layer was continuous with no gaps guaranteed by the quality control process. Then, one hole with an inner diameter of 19.0 mm was drilled throughout the torque specimen crossing all the three layers of laminated wood. Table2shows the detailed information for the CLT torque tube specimens.
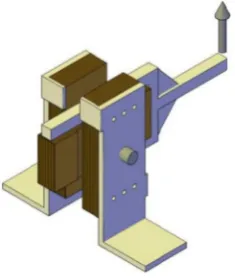
After one torque tube specimen was fixed on the loading machine platform, the upper layer of the specimen was locked on a steel frame with lever welded, as shown in Fig.3. Then, vertical load was applied to the other end of the lever. The force arm from the centre of test specimen to the loading point is 0.5 m. The jack kept loading vertically at a constant loading rate until the specimens failed. The vertical load on the lever transformed into the torque load on the specimen, leaving the middle cylinder layer in a shear status. The loading test adopted the displacement control method, and the speed was about 4.8 mm/min (0.2 inch/min). The total time to failure for one tube specimen was about 4 min. The specimen would fail when the shear stress from the torque loading exceeded the rolling shear strength in the timber material, as further discussed in following sections investigating the failure modes in the torque tests. In the test, the loading history and the failure modes for the specimens were recorded.
Finite-element model
To investigate the stress distributions in the torque tube specimens, further modeling work was performed and summarized as follows with consideration of different shear stress components (longitudinal shear).
Considering the anisotropic material property in timber material and the grain influences on strength, the evalua-tion of the stress status of CLT torque tube specimens requires finite-element method for further investigation, since the elementary mechanical torque theory equations (calculated by hand) are not able to accurately evaluate the structural response of the tube specimens. Therefore, a linear elastic finite-element analysis was carried out.
The finite-element model, as shown in Fig. 4, was developed in ANSYS platform [16], considering the glue line shear stiffness and anisotropic wood properties. Dimensions of the tube models are the same as those in the
Table 2 Information for the
torque tube specimens CLT category
Lamination grade
Number of specimen
Lamination thickness (mm)
Upper and bottom layers
Middle cylinder layer
Length9width (mm)
Outer diameter (mm)
Inner diameter (mm)
SPF5-0.4 No.2/Stud/No.2 33 34/19/34 1009100 52 19 SPF3-0.4 No.2/Stud/No.2 33 34/34/34 1009100 52 19
Fig. 2 CLT torque tube specimens
Fig. 3 Torque test setup (withYdirection as the direction of wood fibre in the middle cross layer)
Table 1 Grades and
configurations of the CLT plates CLT category Lamination grade Lamination thickness (mm)
Lamination board width (mm)
Plate dimension L9W9H(mm)
CLT specimens, as introduced in Tables1 and2. Table3 gives the input elastic orthotropic properties of wood material [6,13]. Poisson’s ratios for Spruce-Pine-Fir were obtained from the Wood Handbook [2].
Solid volume elements were used to model the wood boards. The metal part of the test jig was also simulated. The fibre direction of the cross layer in the model was the same as that in the test setup, i.e., the grain direction (Y direction) was perpendicular to the longitudinal direction of the steel lever (X direction in Figs.3 and4).
For modeling the glue line strength between different layers, the glue line shear stiffness was obtained from one test database [17]. In Schaaf’s study, torsional shear tests were conducted to study the shear strength and stiffness properties of glue lines in three-layered wood composites glued by polyurethane adhesive, as shown in Fig.5. Table4shows the input shear line stiffness value for the finite-element models. COMBIN14 linear x–y–z spring pairs were used to model the glue line bonding stiffness. The x-springs and y-springs considered the glue line shear stiffness, and the z-springs were assigned with high stiffness value representing rigid vertical bonding between wood layers. The boundary condition for the model was the same as the support condition in the test setup.
Test results and data analysis
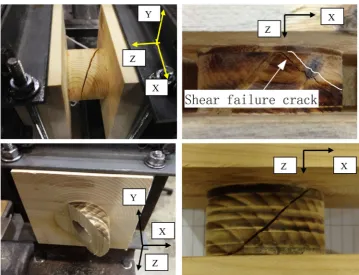
There were two failure modes in the torque tests, shown in Figs. 6 and 7; blue stains in the beetle-afflicted lumber boards may also be found in Fig.6. Most of the tube specimens failed in brittle shear failure mode; the shear failure showed the typical brittle failure behaviour with 45° inclined angle observing from the top or bottom face of the tube specimen. The resistance of the specimens to carry load suddenly dropped to zero, when the failure occurred. The other specimens (two specimens at SPF5-04 group and
Fig. 4 Finite element modeling of three-layer CLT tube test spec-imens (orthotropic wood properties with Y direction as the direction of wood fibre in the middle cross layer)
Table 3 Input orthotropic
properties of the wood boards Species Grade Elastic properties (GPa) Poisson’s ratios EL ETandER GLR&GLT GRT mLR mLT mRT
Spruce–pine–fir No. 2/better 11.43 0.381 0.714 0.071 0.316 0.347 0.469 Stud 10.66 0.355 0.666 0.067
Fig. 5 Schaaf’s study for the torsional shear test
Table 4 Input shear stiffness of the glue lines
Species Clamping pressure Stiffness (N/mm3) Spruce–Pine–Fir 0.4 MPa 20.6
eight specimens at SPF3-04 group) showed the glue strength failure in the tests; the average glue failure peak loads for the two specimens at SPF5-04 group and the eight specimens at SPF3-04 group are 52,258 and 52,117 N9mm. Only those specimens with the shear failure were included in the analysis in Table5. The typical curve between the recorded applied load and displacement at the lever end is given in Fig.8.
In Table5, the mean value, standard deviation, and coefficient of variation of the measured torque failure loads are given. Table5 also includes the Weibull fitting parameters for the cumulative distribution of the torque test results. Shear strength scan be calculated using equation
s=T/Ip9r, wheresis the shear strength in N/mm 2
,Tis the peak failure torque load in N9mm from Table5, Ip=pDouter4 /32-pDinner4 /32 is the polar moment of area
in mm4, Douter is the outer diameter, Dinner is the inner
diameter, and r=Douter/2 is the outer radius in mm.
Table5 gives the mean value of the calculated shear strength s; the given shear strength s in Table5 from equation s=T/Ip9r is based on the assumption of
iso-tropic material property which is not true for timber, and
Fig. 7 Shear failure in the torque test (with Y direction as the direction of wood fibre in the middle cross layer)
Table 5 Summary of the torque test results
CLT type Peak failure torque load (N9mm) Weibull fitting parameters No. of specimen with rolling shear failure
Calculated shear strength (N/mm2) Mean Standard
deviation
Coefficient of variation (%)
Location Scale Shape Mean
SPF5-0.4 103,989 17,058 16.40 0.00 110,378.29 7.42 31 3.79
SPF3-0.4 84,561 14,048 16.61 0.00 89,210.22 7.86 25 3.36
0 50 100 150 200 250 300
0 5 10 15 20
Appl
ie
d L
o
ad
a
t the
L
eve
r E
nd (
N
)
Displacement at the Lever End (mm) Torque Load - Displacement Curve at the Lever End
more accurate results can be evaluated based on the developed finite-element models introduced in the next section.
Analysis and discussion on the rolling shear failure
in torque loading tests
Finite-element model results
In the torque loading tests, most of the CLT tube specimens had brittle shear failure. Once failure occurred, the resis-tance to carry load sharply dropped to zero. The cracks were developed at an inclined angle in the middle layer of the specimen. The brittle shear failure mechanism in the torque tube specimens was not as clear as the rolling shear failure observed in the short-span beam specimens [6]. To investigate and confirm that the observed shear failure mode was rolling shear failure in the torque tube speci-mens, a linear elastic finite-element analysis was performed to evaluate the rolling shear stress distribution with con-sideration of the orthotropic wood material properties; the results were summarized as follows with consideration of different shear stress components (longitudinal shear and rolling shear).
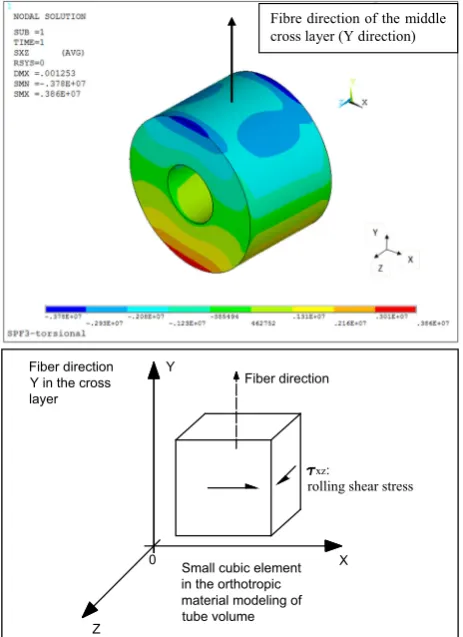
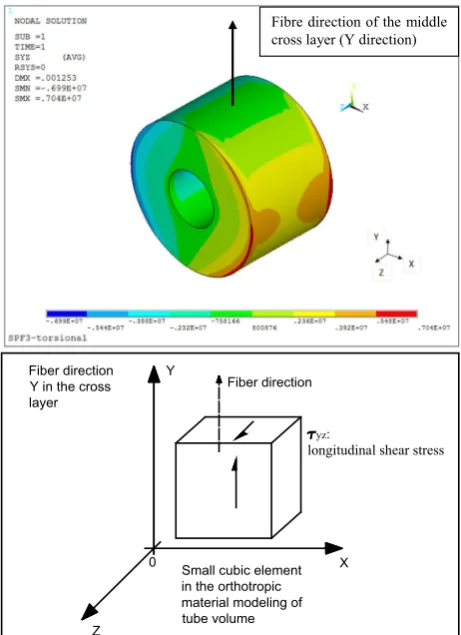
Figures9,10, and11show the shear stress (sxz;sxy;syz in Pa in the figures) distributions in the cross layer of three-layer CLT tube specimens, when the applied load level is the mean peak failure load (84,561 N9mm from Table5) for three-layer CLT. The shear stress sxz (the same as engineering definitions in Cartesian coordinate system in terms of directions) is the shear stress directed parallel to a given plane (YZ plane) which is perpendicular to the X direction, and this sxz is parallel to the Z direction. Therefore, since rolling shear is defined as a shear stress leading to the shear strain in the planes perpendicular to the grain,sxzis the rolling shear stress, andsxy andsyzare the longitudinal shear stresses. These two longitudinal shear stresses (sxy andsyz) are also uncoupled according to the defined wood orthotropic material property [18]. The maximum value of the shear stress (sxz;sxyorsyz) is also given in the figures (in Pa).
Figure9 shows that the maximum rolling shear stress (3.86 MPa) occurred near the ring-edge of the cross layer volume close to the top or bottom layer of the tube spec-imen, where the initial shear crack typically started in the tests (brittle shear failure mode as given in Fig.7). As shown in Fig.10, the maximum longitudinal shear stress is 7.04 MPa.
Similarly, when the applied load level is the mean value of peak failure load (103,989 N9mm from Table5) for five-layer CLT, the maximum rolling shear stress
(4.83 MPa) occurred near the ring-edge of the cross layer volume; the maximum longitudinal shear stress was 10.30 MPa.
In Table5, the calculated mean shear strength for the three-layer CLT from equation s=T/Ip9r is 3.36 MPa
and the calculated mean shear strength for the five-layer CLT is 3.79 MPa. In the developed finite-element models, the evaluated mean rolling shear strength is 3.86 MPa for the three-layer CLT and is 4.83 MPa for the five-layer CLT. The results are close but different; the difference is due to that the finite-element modeling can simulate the timber anisotropic material property, and it can give more accurate results in terms of shear stress concentrations and distribu-tions in volumes by considering both longitudinal and roll-ing shear components. The results in Table5are based on the assumption of isotropic material property which is dif-ferent in timber; the finite-element result shows the shear stress distribution is highly non-uniform by simulating the specimens’ detailed geometry giving a better understanding of the structural behaviour of specimens.
0
xz:
rolling shear stress
Y
X
Z Fiber direction Y in the cross layer
Small cubic element in the orthotropic material modeling of tube volume
Stress Component Introduction in Small Element Fiber direction
Fibre direction of the middle cross layer (Y direction)
Fig. 9 Shear stress (sxz in Pa, rolling shear in orthotropic material
For the three-layer CLT tube specimens, the ratio between the maximum rolling shear stress and longitudinal shear stress is RThreelayerShear ¼smaxxz
smax yz ¼
3:86
7:04¼0:551=1:82: For the five-layer CLT tube specimens, the ratio between the maximum rolling shear stress and longitudinal shear stress is RFivelayerShear ¼smaxxz
smax yz ¼
4:83
10:30¼0:471=2:13: Rolling shear strength and stiffness of wood are much lower than its longitudinal shear strength and stiffness. According to limited test data [1–6], rolling shear strength is typically between 18 and 28 % of parallel-to-grain shear strength. In this study, the ratio RShear¼0:471=2:13 (i.e., the minimum of RThreelayerShear and RFivelayerShear ) is much higher than the ratio of rolling shear strength and longitu-dinal shear strength (18–28 %, which is about 1/5–1/3). Therefore, in the torque loading tests, the rolling shear stress should reach the material strength limit earlier than longitudinal shear and the brittle failure mode observed in the cross layers of the CLT tube specimens should be rolling shear failure. The calculation from the
finite-element models under applied peak torque load from the experiments shows the longitudinal shear stress not failed meaning that the failure is not longitudinal shear failure; therefore, the ratio RShear shows much higher than the reference data.
Further investigation on the shear failure mode in torque loading tests based on a Monte Carlo simulation procedure
Test results show that the longitudinal shear strength of Spruce-Pine-Fir, a Canadian softwood species category, ranges from 6.94 to 8.08 MPa [5]. Spruce-Pine-Fir species comprises timber from white spruce, engelmann spruce, lodgepole pine, and alpine fir species in western Canada (British Columbia and Alberta states, Canada). According to the Wood Handbook [2], the longitudinal shear strength of lodgepole pine grown in Canada is 8.50 MPa in 12 % moisture content, and the white spruce grown in Canada has the lowest longitudinal shear strength (mean value of 0
yz:
longitudinal shear stress
Y
X
Z Fiber direction Y in the cross layer
Small cubic element in the orthotropic material modeling of tube volume
Stress Component Introduction in Small Element Fiber direction
Fibre direction of the middle cross layer (Y direction)
Fig. 10 Shear stress (syz in Pa, longitudinal shear in orthotropic
material modeling) distribution in the cross layer of three-layer tube specimen (maximumsyz¼7:04106Pa)
0
xy:
longitudinal shear stress
Y
X
Z Fiber direction Y in the cross layer
Small cubic element in the orthotropic material modeling of tube volume
Stress Component Introduction in Small Element Fiber direction
Fibre direction of the middle cross layer (Y direction)
Fig. 11 Shear stress (sxy in Pa, longitudinal shear in orthotropic
6.80 MPa in 12 % moisture content) among Spruce-Pine-Fir species. There is also research informing the average longitudinal shear strength (mean value of 7.27 MPa) of Mountain Pine Beetle-afflicted lodgepole pine, based on the test data [19]. Therefore, the values of 6.80 and 7.27 MPa were selected in the following simulation process.
In this section, a Monte Carlo simulation procedure was performed as follows to investigate the probability of dif-ferent shear failure modes in torque loading tests, consid-ering the randomness of the rolling shear strength and longitudinal shear strength in wood material, and this process was as follows:
1. The mean values of rolling shear strength sm RS (for example, sm
RS¼1:0 MPa) and longitudinal shear strength sm
LS (for example, a lower longitudinal shear mean strength sm
LS¼6:80 MPa) were chosen, and a coefficient of variation of 18 % was also chosen. 2. Assume the rolling shear strength and longitudinal
shear strength were lognormally distributed, and based on the initial distribution parameters chosen in step 1), a random sample size of NRnd¼1000 sets ofsRS and
sLS was generated. sRS and sLS represent the rolling shear strength and longitudinal shear strength in wood material of this given random set.
3. For each random set, the ratio (i.e., RatioRandom) between sRS and sLS was calculated as RatioRandom¼sRS=sLS.
4. As investigated in the previous section, if RatioRandom
\minRThreelayerShear ;RFivelayerShear ;where
RThreelayerShear ¼0:551=1:82;RFivelayerShear ¼0:471=2:13;
there is rolling shear failure occurred in this random set; otherwise, the failure mode will be longitudinal shear failure.
5. The probability of rolling shear failure pRS
f can be
evaluated based on the number of sets with rolling shear failure mode.
In the simulation, different variables were also included and investigated, considering the variable mean values of rolling shear strengthsm
RS (1.0, 1.5, 2.0, 2.5, and 3.0 MPa) and longitudinal shear strength sm
LS (6.80 and 7.27 MPa), and the coefficient of variation (16 and 18 %).
It needs to be emphasized that the selected longitudinal shear strength category of 6.80 MPa in step (1) of the simulation has already been an under-estimation, consid-ering the longitudinal shear strength of lodgepole pine grown in Canada is 8.50 MPa, and considering that the lodgepole pine, rather than white spruce species, was mainly adopted in the related CLT manufacture process [13].
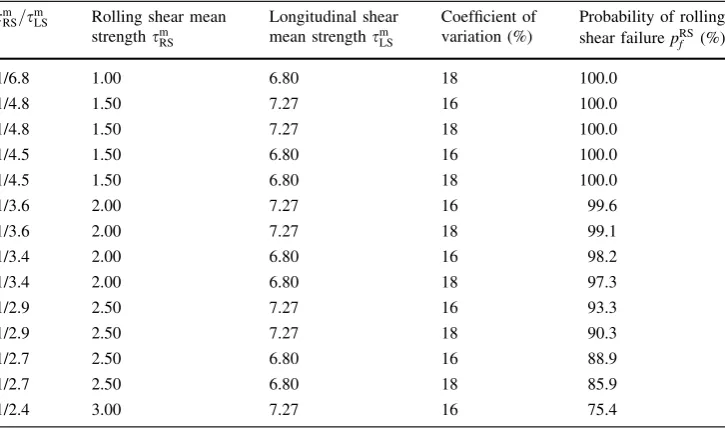
Table6 shows the probability of rolling shear failure pRSf based on different ratios (sm
RS=s m
LS) between the chosen mean values of rolling shear strengthsm
RSand longitudinal shear strengthsm
LS. Although the criterion was strict in the longitudinal shear strength simulation, in most cases, it still showspRS
f [94%, and this gives more confidence on the
Table 6 Results for the Monte Carlo simulation s
m
RS=smLS Rolling shear mean
strengthsm RS
Longitudinal shear mean strengthsm
LS
Coefficient of variation (%)
Probability of rolling shear failurepRS
f (%)
1/6.8 1.00 6.80 18 100.0
1/4.8 1.50 7.27 16 100.0
1/4.8 1.50 7.27 18 100.0
1/4.5 1.50 6.80 16 100.0
1/4.5 1.50 6.80 18 100.0
1/3.6 2.00 7.27 16 99.6
1/3.6 2.00 7.27 18 99.1
1/3.4 2.00 6.80 16 98.2
1/3.4 2.00 6.80 18 97.3
1/2.9 2.50 7.27 16 93.3
1/2.9 2.50 7.27 18 90.3
1/2.7 2.50 6.80 16 88.9
1/2.7 2.50 6.80 18 85.9
observed rolling shear failure mode in the tube specimens. The cases withpRS
f 94 % only occurred when the ratio
betweensm
RS andsmLS was larger than 1/3. This is not real-istic considering rolling shear strength is recognized to be between 18 and 28 % (about 1/5–1/3) of longitudinal shear strength. When the ratio sm
RS=s m
LS is between 1/5 and 1/3, thepRS
f [97%. Even when the ratio smRS=smLS is impracti-cally larger than 1/3 (sm
RS=s m
LS¼1=2:4 and with assumed rolling shear strength to be 3 MPa),pRSf is still in a high confidence level (75.4 %).
Conclusions
In this study, the rolling shear behaviour of CLT was investigated by the torsional shear tests on CLT shear blocks with processed tubular cross layers. The rolling shear strength values were evaluated by finite-element modeling of the test specimens subjected to the failure loads. Simple analytical equations to calculate the rolling shear strength is not applicable in this study due to the complicated orthotropic wood properties and the torsional shear loading scheme. A Monte Carlo simulation procedure was performed to investigate the occurrence probability of longitudinal shear and rolling shear failure modes in the specimens considering the randomness of the rolling shear strength and longitudinal shear strength of wood material. The simulation results further confirmed that the observed brittle shear failure was indeed rolling shear. Therefore, the torque loading test is a viable method to investigate the rolling shear behaviour of the CLT specimens.
The evaluated rolling shear strength values by the finite-element modeling results were very different from other test results from bending tests or planar shear tests available in literature. In this study, much higher rolling shear strength values were obtained, i.e., 3.86 and 4.83 MPa, for the three-layer and the five-three-layer CLT tube specimens, respectively. Apparently, these values cannot be directly used for design purpose, because it involved a significant size effect and rolling shear stress concentration was observed in the cross layers. However, together with short-span bending test results, these test results can be a useful data source to study the size effect on rolling shear strength properties of CLT with common structural sizes under normal loading sce-narios. In addition, to consider the size dependence and to explain the strength differences between the CLT beam bending tests and the torque loading tests, Weibull’s weakest link theory will be applied to evaluate the size effect on the rolling shear strength of CLT in the future.
Acknowledgments The authors would like to thank NSERC strategic network for engineered wood-based building systems for supporting
this research. Special thanks also go to Dr. Ricardo O. Foschi for his advice and guidance in the research.
References
1. Blass HJ, Go¨rlacher R (2003) Brettsperrholz. Berechnungs-grundlagen (in German). Holzbau Kalender, Bruder, Karlsruhe, pp 580–598
2. Forest products laboratory (FPL), USDA (2010) Wood hand-book—wood as an engineering material. Centennial, Madison 3. Aicher S, Dill-Langer G (2000) Basic considerations to rolling
shear modulus in wooden boards. Otto-Graf-Journal 11:157–166 4. Fellmoser P, Blass HJ (2004) Influence of RS modulus on strength and stiffness of structural bonded timber elements. CIB-W18/37-6-5, Edinburgh, UK
5. Lam F, Yee H, Barrett JD (1997) Shear strength of Canadian softwood structural lumber. Can J Civil Eng 24(3):419–430 6. Li Y (2015) Duration-of-load and size effects on the rolling shear
strength of cross laminated timber. Ph.D. Thesis, University of British Columbia, Vancouver
7. EN 1995-1-1 (2004) Eurocode 5: Design of timber structures. Part 1-1: General—Common rules and rules for buildings. European Committee for Standardization, CEN, Brussels 8. FPInnovations (2011) Chapter 3 Structural design of
cross-lam-inated timber elements. CLT Handbook, Vancouver
9. ASTM D2718-00 (2006) Standard test methods for structural plates in planar shear. American Society for Testing and Mate-rials (ASTM), ASTM International, USA
10. Norlin LP, Norlin CM, Lam F (1999) Shear behaviour of lami-nated Douglas fir veneer. Wood Sci Technol 33(1999):199–208 11. Mestek P, Kreuzinger H, Winter S (2008) Design of cross
lam-inated timber (CLT). Proceedings of WCTE 2008, Miyazaki, Japan
12. Zhou QY, Gong M, Chui YH, Mohammad M (2014) Measure-ment of rolling shear modulus and strength of cross laminated timber using bending and two-plate shear tests. Wood Fiber Sci 46(2):1–11
13. Chen Y (2011) Structural performance of box based cross lami-nated timber system used in floor applications. Ph.D. Thesis, University of British Columbia, Vancouver
14. Yawalata D, Lam F (2011) Development of technology for cross laminated timber building systems. Research report submitted to Forestry Innovation Investment Ltd. University of British Columbia, Vancouver
15. National Lumber Grade Authority (2014) Standard grading rules for Canadian lumber. NLGA (National Lumber Grade Authority), Canada
16. Swanson Analysis System (2011) ANSYS V14.0. Swanson Analysis System Inc., Houston, PA, USA
17. Schaaf A (2010) Experimental investigation of strength and stiffness properties for cross laminated timber. Diplomarbeit, Karlsruhe Institute of Technology, Germany
18. Bodig J, Jayne BA (1982) Mechanics of wood and wood com-posites. Van Nostrand Reinhold Company, New York