Investigating And Evaluating Of Network Failures
And Performance Over Distributed WAN In
Application Protocol Layer
Enoch Okoh Kofi, Micheal Asante, Francis Kwadzo AgbenyegahAbstract: The Experiment was done to find out network failures and application performance relationship over distributed Wide Area Net (WAN). In order to access related application over the cloud there must be an internet connectivity which will help the respective workstations to access the remote server for applications being deployed over the network. Bandwidth improvement helps in reducing utilization over the network and it also helps in improving Application Efficiency of these Applications in terms of Response Time. Routers were configured under Enhance Interior Gateway Routing Protocol (EIGRP) to reduce utilization and to ensure load sharing over the network. Three scenarios were modeled and their performance efficiency was evaluated. A modeled computer Network with and without a fail Router under different scenarios and such Network was simulated with emphasis on the Application Performance. The Experiment was done for fifty workstations under three scenarios and these three scenarios were accessed and evaluated on experimental basis using Riverbed modeler to show the Effect of Application Network performance. The performance results show that increasing the bandwidth reduces utilization and also with the failure of one communication bandwidth, users can still access Network Application with a minimal cost.
Index Terms: Wide Area Network, Enhance Interior Gateway Routing Protocol (EIGRP), Routers, Riverbed Modeler, Utilization
————————————————————
1
INTRODUCTION
Network performance has been one of the key indicators that determined the quality of Service a vendor or an agency is rendering to its customers or the way and manner the network delivers based on the arrival of packet and other related components. Users of the said network complains more frequently about the efficiency of the network when it is not delivering the expected preambles to the masses, the masses would want to know why the said network is underperforming and hence this has called for the study to see how the network could be optimized to boost its performance in ensuring that quality of service is at its best. With high amount of data that are being injected into the network for service delivery has been the cause of a dwindling network hence the use of Riverbed modeler simulator to model and study the performance of a model network by measuring the key performance indicators based on traffic variation with respect to user behavior. To measure network performance quantitatively, several related aspect of the network are considered before drawing on any conclusions and such area would have to be studied for a period of time. Network application such as File transfer protocol(FTP), Hypertext transfer protocol(HTTP),Telnet, voice runs through the network and exponentially increase the packet injected into the network and these could result in high probability blocking congestion, etc. In field of computer science network performance comprises of the aspect of response time, loss, signal-to-noise Ratio. [11] In a high optimized network, the traffic pattern must be modeled in a way that will result in resource reservation and control certain parametric indicators to provide different priority to different application users.
2
NETWORK
APPLICATION
Network Application is part of network protocols in the sense that they exchange messages with their peer on other machine of interest. [22] Differentiated Application services are deploying to the network in order to ensure that their service content would be available for the respective user. Database Application, Browser and File sharing application
hardware platform to perform useful function and network application is based on the general phrase that is designed by expert to help setup, manage and monitor the computer networks.
3
RESEARCH
PROBLEM
The world has come to an era where a major industrial player relies so much on Digital transmission which is done through computers and telecommunication networks. The Emergence of the Global Economy is only possible through a highly optimized network put in place to ensure high Quality of Service. To become a Global market leader in this Global Economy, we must strive for excellence so that we can become versatile in whatever activities we engage ourselves in making sure that we are seen everywhere and this is only possible through digital transmission which involves network of computers for the purposes of transmitting Information through multiplicity of channel allocation. Network performance is critical to the success of a business operation and because of these it is always imperative to look into fine tuning of the network system in ensuring that it gives it best at all times.
4
RELATED
WORK
154 within the corporate platform. The situation is unlikely to be
solved or improved as the rate of usage of computers is on the increase and there is no ending to that. The only workable solution is to improve the information technology platform and the management of data flow within the said company. Optimizing computer network starts at the intended work station and finds its way to the server farm until it is linked to the IP cloud or through the local area Network (LAN).[9] In order to increase the efficiency of the Network, certain applications need to re-engineered and also organizational process needs to be scrutinized internally in ensuring that people managing and using the network resource within the organization are doing so more efficiently. Comparatively the need for computer Network Connectivity over long distance from one another to the other was very eminent hence wide area network. It provides answers of tasks which are at the far end of the globe. Those remote networks allow users at the far end to access network resources. The ability for any computer network to exchange data in an automation mode is one of the essential mechanisms needed in a computer network. Wide Area Network is the first to appear, thus the joining of geographically distributed network at different location of the world. Based on the concept of WAN, many fundamental thoughts of ideology were introduced and expanded, hence the following Multilayer architecture mode of communication Packet switching Routing in heterogonous network. [8] With the continued decline in the cost of computing, there has been a dramatic increase in the number of independent computer system used for scientific analysis and these machines do not work in isolation and with their proliferation comes a need for suitable communication network, particularly computers that can interconnect in a distributed computing system. While there is no single definition of local computer network, there is a broad set of requirement and these are:
Relatively high data (typically up to 10Mb) Geographic distance spanning
Ability to support several hundred independent devices Efficient use of shared resource
Stability under high local load.[30]
In order to get to the peak of the network performance, certain indicators must be monitored consistently to ensure that service level is always good. Effective network performance must be ensured at all times and Service level Agreement (SLA) must be an integral part of the network agreement.
5
METHODOLOGY
5.1DATACOLLECTIONS
Primary and Secondary data were sampled using unstructured interviews with Network Application users and Technical Expert in Networking Domain such as System Administrator, Switch Engineers and Telecoms Managers to determine, analyze and improve on the ideas of network failures and application performance in application protocol layered.
5.2SYSTEMDESIGN
The behaviour and performance analysis of computer and Telecommunication Network can best be investigated by the used of Simulation and analytical study or Both.Preferences are given to simulation when studying the behaviour of a specific network covering a specific area of topology.In this research, the study of network performance and its failures is base solely on computer simulation and Event Driven Simulator by the use of Riverbed modeler.The Focus was load balancing and Link Utilization to see the Generalised impact on the Network with respect to how the Applications deployed will performed. The Requirement for the Scenarios were as follows
Scenarios 1: 50 Workstation connected to the Network with T1 Link connection (Single Router).
Scenario 2: 50 Workstation connected to the Network with Two of the T1 Link Connection(Double Router by the used of EIGRP to ensured load Balancing)
Scenario 3: 50 Workstation connected to the network with a Fail T1 Link Connection (Fail Router)
Scenario 1 was with initial 50 computers and the company would want to Know the effect of Doubling the Link connection on the Network and its effect on the Respective Application hence Scenario 2 with EIGRP configuration. After getting to know the Effect of doubling the Link, they also would want to know the performance of the Network after one Router has been fail hence Scenario 3.The relevance of this is to ensure business continuity and disaster recovery.
5.2.1SOFTWARETOOL
Riverbed Modeler is one of the leading simulator being used in the Academia as well as industrial Research to design and to study the performance of communication network, Dvices, Application Protocol etc.It helps in accelerating research and development in industrial and Academic Setup. Riverbed Modeler Support most of the Network Designed and allows you to answer question that cannot be answer through visual inspection.The Benefit that goes with the used of Riverbed Modeler are as follows Reduce Time-to-Market i.e it helps you to confirmed the Design ahead of Time by Designing and Validating the Network Architecture. Product Quality Improvement:It helps to test the performance index of any product or component for the customer to know the reality of it before production. Boosting Network Research and Development (R&D): The workflow involve in building a comprehensive network for its performance to be access must go through a scenarios in order to ensure that an accurate Report is assured.The steps involved are as follows 1. Creating a network model for analysis
2. Choosing Statistics 3. Running the Simulations
5.2.2IMPLEMENTATION
Figure 1, Figure 2 and Figure 3 describes the architecture of the models
Fig. 1: Network model with TI Link connectivity
Fig. 2: Network model with Double TI Link connectivity
Fig. 3: Network model with Fail TI Link connectivity
COMPONENTUSEDINTHENETWORKDESIGNED
5.2.3INTERNET
The ip32_cloud model represents the internet and supporting up to 32 serial line interfaces at a selectable rate. They received packet and route them to appropriate output based on the Destination address of the IP. The Routing information protocol (RIP) may be used to create dynamic routing table of the cloud in a more adaptive environment. The queuing
following protocol, i.e. User datagram protocol (UDP), Open shortest path first (OSPF), Transmission control protocol (TCP).
5.2.3SERVERS
The server model on the Ethernet represent server mode with respective Server Application working over UDP/IP and TCP/IP. It support 10Mbps, 100Mbps and 1Gbps.The Link Data rate determines the operating speed. The Ethernet card can be made to operate in either full or half duplex. A constant amount of time is required to route each packet as determined by the forwarding rate of the internet protocol (IP).It could support various forms of services such as Emails, File Transfer Protocol, Hypertext Transfer Protocol(HTTP).
5.2.4LOCALAREANETWORK(LAN)
The 10Base T_LAN used over here is to represent Ethernet Switch Topology and could contain any number of clients on the network. The Traffic over here could be directed to both internal and External Servers over and within the Network. Application services running over this Topology could be Emails, TELNET, FTP, HTTP etc. Traffic for a group of user can be specifying whiles characterizing the entire LAN.
5.2.5ROUTERS
A Router is an Information Technology Device that connect and forward data packet between computer networks. They usually connect two or more Data lines from different sources. The Router accepts incoming Data and set to reads it Destination for onward Transmission. The Router Employ over here is ethernet4_slip8_gtwy node which is an IP base supporting for Ethernet Hub and Eighty Serial Line interface.
5.2.6T1ANDDSILINK
They connect to two running node over IP and the packet format is ip3_datagram.The Data rate for the link is 1.544mbps whiles T1 also connect to the same IP running nodes and have the same data format as that of DS1 with a speed rate of 1.544mbps.
5.2.710BASETDUPLEXLINK
It represents an operating connection at 10mbps and can connect the combination of LAN nodes, Switch, Hubs etc.
6.
NETWORK
CONFIGURATIONS
156
6.1SIMULATION
After the construct of the architectural overview of the Network and configuring the needed component, the experiment was made to run for one hour simulation time concurrently while monitoring the performance of the network with it deployed Application namely Emails, Ftp, Database and Http
7.
RESULTS
OF
THE
EXPERIMENT
In the event of the simulation a packet size of 1MB(Low),5MB(Medium) and 10MB(High) were imposed onto the network with a varying link speed(Switching speed) of 500Mbps,1Gbps as well as 1.5Gbps were set between the Routers and the cloud to see the performance effect on the network per the selected matrices. The simulation experiment was run for ten consecutives times with one hour simulation period and the results taken for the first Ten minutes and the last Fiftieth minutes. The procedure employed in achieving the results is that, a load factor is configured and is held constant for the network whiles varying the link speed to see its behaviors graphically for all the scenarios in contention. The Graph is of axis of simulation time as against Bit response. At an interval of 10th and 50th minutes of simulation time, the corresponding bit response is taken for each scenario hence the various figures in the application tables for all the deployed application within the network. These procedures are repeated for all packet size of different application within context to get the needed results.
7.1GRAPHICALANALYSIS
Fig. 4 Email upload Response Time
When the entire three scenarios were considered in figure 4, single router connection shows a high level of upload response time whiles performance seems to improve under double routing protocol simply because of the Enhance Interior Gateway Routing Protocol (EIGRP) configuration which enhances load sharing on the network. It helps to automate routing decision and it configuration parameters. EIGRP allows a router to share its information with a neighboring router about the computer network. EIGRP help optimized the network by reducing the workload on any adjacent router that needs to be transmitted. Failed Router seems to multiplex with Double Router connectivity under EIGRP configuration. The response time for Fail Router seems to merge that of double router connectivity.
Fig. 5 Email Download Response Time
Per the Graphical analysis of the three scenario as depicted in Figure 5 for Download response time, it was detected that the single router connectivity shown a high level of response time making it time delay in the analysis with a peak Figures of 7.081691 bit rate at the 3rd minutes of the simulation time and immediately the workstation begins to send the packet across the 10Mbps and T1 Link connectivity. When the bandwidth was made to double for the second scenario the response time decrease substantially by almost 50 percent making it a better network than the previous Scenario but consequently when one of the link was made to fail it performance Deficiency wasn’t all that affected as compared to the second scenario.
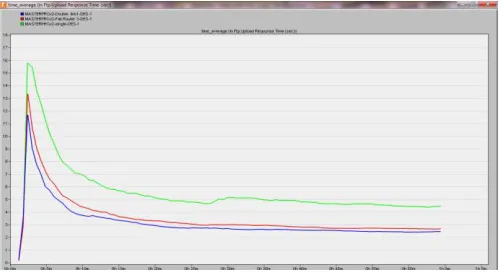
Fig. 6 Ftp Upload Response Time
Figure 6 Shows the Upload Response time for Ftp considering all Scenarios in contention and it was realized that with the single Router Connectivity, a high level of response time was seen with a peak figure of 15.781 with 2minutes simulation time .Per single channel communication policy in this scenario, users on the network would have to queue thereby resulting in delays in system network. The second scenario with Double Router connectivity shown the same level of graphical pattern with a Bit rate of 11.67 peak whiles trying to upload some files unto the network. The Fail Router seems to multiplex itself with that of the Double router showing apparently the same level of operational performance.
E
U
p
loa
d
s
(
B
its
)
Em
ail
D
o
wnlo
ad
s (
Bit
s)
Ftp
Upl
o
ad
s (
Bit ra
te
Fig. 7 Ftp Download Response Time
The Download Response per the system analysis goes to shows that there was a high level of performance deficiency in Double Router connectivity with a peak figure of 17.8 bit rate whiles single router had a depreciating figures of 13 bit rate as show in Figure 7 .The three Graphs in contention shows a pulsating nature of the behavioral characteristics of the Network with the Double and Fail Router showing good performance at the end of the simulation period.
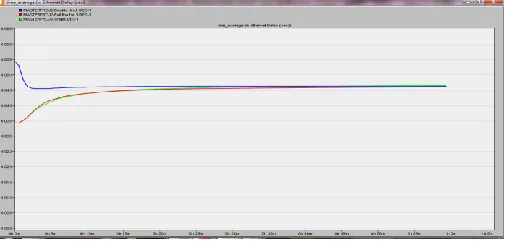
Fig. 8 Ethernet Delay
Ethernet Delay is one of the key indicators in determining the performance efficiency of the network in other to ascertain the true characteristics of the network as it has been in telecommunication or computer network. The delay of the network also depicts how long a time a bit of data will traverse across the network from one Node point to the end point. Delay may defer slightly from each other base on the location of any communication node. In this context of consideration the total delay of the network was considered pertaining to a precise measurement that was undertook. The delay on these three scenarios was caused by the components connected on this topology. The transistors and diodes within the component possess some level of resistant hence in the case of a travelling packet there is a slight level of resistivity within the transmission medium hence the need to study delays in this experiment and to advice on the best and worst scenarios. Double Router connectivity started from higher level of Delay whiles merging with other scenarios showing a stable condition in Delays with a figure of 0.045 bit rate which was apparently good operating Figures.
Fig. 8 Downlink Utilization
Network utilization is the amount and the content of traffic signal on the network compared to the maximum amount of traffic, the network can support for and during the peak hours and it is generally express in percentiles. There are various timings within the network whereby the network becomes congested due to user behavior which goes to confirm to the fact that network utilization is on the high side, when this happens, user on the network experience a slowdown in the responsiveness of application. Response time factor also grow more than the expected thus prevent users from operating efficiently. When performance of a particular network drops below the normal service level agreement (SLA), there is the tendency to lose capital revenues. Revenue is lost and user’s experiences on the network also dwindle. Single Router connectivity display a high level of utilization whiles dropping substantially. Figure 8 shows cloud utilization and when an additional TI was connected with additional router configure under EIGRP configuration, it was observe that cloud utilization drop by almost 70% as compare to single router connectivity. In comparing Fail router and Single Router, utilization went up steadily from 0.021805 with each experiencing a peak value of 64.662825 at the 43rd minutes for the fail router whiles single router also having a peak of 84.990267 at 49th min. Both scenarios show an appreciable amount of exponential increment from the start of the experiment to the end of the experiment. There was a drop in cloud utilization when additional TI was connected.
8.
CONCLUSIONS
In this global era, understanding the performance of network is characteristically critical to emerging world that are so incline to technological platform. Client population and global network characteristics must match in demand levels at any point in time. User experience must not be affected whenever there is a failure within the network. Service level agreement must be a key factor in ensuring network availability of 99.90% at all times even if additional funds will be required to improve the performance efficiency. Network failures could cause network degradation which will affect the user so badly hence trying to provide different routing route for transmission should anything happens at the other side of the ring topology. Alternatives must always be provided in making sure that total failure does not occur. We modeled a computer Network with and without a fail Router under different scenarios and such Network was simulated with a deep closeness on the Application Performance. The Experiment was done for fifty workstations under three
Ftp
D
o
wnlo
ad
s (
Bit
Rat
e)
P
o
in
t t
o
po
in
t utili
zati
o
n
(
Bi
158 evaluated on experimental basis using Riverbed modeler to
show the Effect of Application Network performance. From the study it was realized that if one transmission route fails, user signal could be made to route through a different transmission path which in a way far better than the single router connectivity which shows high response time. Double router connectivity operated at a minimum cost of response.
9.
RECOMMENDATIONS
Based on the result of the study, we recommend those organizations who are trying to optimize their network must also be prepared to spend additional funds to achieve the targeted service level agreement (SLA) since acquiring additional TI goes with a cost. With the introduction of additional Bandwidth, a user will still be able to access the needed Application if one of the Routers in contention fails without making the entire Network to go down.
REFERENCES
[1] Anu, M Introduction to modelling and Simulation, State University of New York.
[2] AunHaider, HarshaSirisena, Krzysztof Pawlikowski and Michael J. Ferguson, ―Congestion Control Algorithms in High Speed Telecommunication Networks‖, Department of Electrical and Electronic Engineering, 2003.
[3] Bosworth,S.,and Kabay, M.E,(2002).Computer Security Handbook, Toronto: WileyInc
[4] Brakmo, L. and Peterson, L. ―TCP Vegas: End to end congestion avoidance on a Global internet‖, IEEE Journal on Selected Areas in communication, 13(8): 1465-1480, October 1995.
[5] Chiu, D. and Jain, R. ―Analysis of the Increase/Decrease Algorithms for Congestion Avoidance in computer Networks‖, Journal of Computer Networks and ISDN, 17(1), June 1989.
[6] Dalal, Y.K., ―The Information Outlet: A New Tool for Office Organization, ―Proc. On-line Cong. Local Networks and Distributed Office Systems, London, May 1981, pp. 11-19.
[7] Eitan Altman, ChadiBarakat and Victor M. Ramos, ―Analysis of AIMD Protocol over Path with Variable Delay‖ University of Nice, 2004.
[8] http://czx.ujn.edu.cn.Date Access August 17th, 2014
[9] http://daywatch.com,Data Access, May 10th,2014
[10] http://dspace.unimap.edu,Date Access July 2014
[11] http://en.wikipedia.org/wiki/Bandwidth,DateAccess,J une 2014
[12] http://en.wikipedia.org/wiki/NetworkTopology,Date Access July 30th,2014
[13] http://en.wikipedia.org/wiki/quality-of-service. Date Access ,April 20th, 2014.
[14] http://en.wikipedia.simulation,DateAccess,August 2014
[15] http://enterprise37.opnet.com/4dcgi/DOWNLOAD_I TE-AE,Date Access July,2014
[16]
http://media-cms.riverbed.com/document/download.html,Date Access July,2014
[17] Http://ptgmedia.pearsoncmg.com,DateAccess,Augu st 2014
[18] http://staffwww.dcs.shef.ac.uk,Date Access July 10th,2014
[19] http://www.gettingyouconnected.com,DateAccess,J uly 17th,2014
[20] http://www.riverbed.com,Date Access July, 2014
[21] http://www.ukessay.com,DateAccess,May 2014
[22] https//www.eng.tau.ac.il,Date Accessed, July 5th 2014
[23] Jahwan Koo, SeongjinAhn, Jin Wook Chung, ―A comparative Study of Queue, Delay, and Loss Characteristics of AQM Schemes in QoS-Enable Networks‖, Computing and Informatics Journal, Vol. 22,2003,1001-1019, V 205-Feb.-8.
[24] Johari R. and Tan DKH, ―End-to-end congestion control for the internet: Delays And Stability‖, IEEE/ACM Transactions on Networking 9(6), 818-812,201.
[25] Kyas,O.(2001).Network Troubleshooting, Palo Alto California, Agilent Technologies
[26] L. Wang,Cai, L. Liu, X. and Shen, X. ―AIMD Congestion Control: Stability, TCP- Friendliness, Delay Performance‖, Tech. Rep., March 2006.
[27] Lahanas, A. and Tsaoussidis, V. ―Exploiting the Efficiency and Fairness Potential Of AIMD base Congestion Avoidance and Control‖, Journal of Computer Network 2003.
[29] Metcalf, R.M., Boggs, D.R., Thacker, C.P., and Lamposn, B.W. ―Multipoint Data Communication System with Collusion Detection, US Patent No. No. 46043. Dec. 13, 1977.
[30] Metcalfe, R.M and Boggs, D.R. ―Ethernet: Distributed packet Switching for Local Computer Networks, ―Comm. ACM, 19:7 July 1976, pp 395-404.
[31] MichealWelzl, ―Network Congestion Control Managing Internet Traffic‖, John Wiley & Sons Ltd., 2005.
[32] Pecora,F.(2005).Principles of simulation and Multi-Agent Approach, school of science and Technology, Orebro University
[33] Ravi S. Prasad, ―An Evolutionary Approach to improve End-to-End Performance In Tep/Ip Networks‖, Ph. D. Thesis, College of Computing, Georgia Institute of Technology, April 2008.
[34] Shoch J.F., and Hupp, J.A., ―Performance of an Ethernet Local Network – A Preliminary Report, ―Local Area Comm. Network Symp., Boston, May 1979, pp. 113-125. Revised version Proc. Compcon Spring 80, San Franciso, pp. 318-322.
[35] Shoch, J.F. ―An Annotated Bibliography on Local Computer Networks‖ (3rded.), Xerox Parc Technical Report SSL-80-2, and IFIP Working Group 6.4. Working Paper 80-12, April 1980.