University of New Orleans University of New Orleans
ScholarWorks@UNO
ScholarWorks@UNO
University of New Orleans Theses and
Dissertations Dissertations and Theses
Spring 5-19-2017
Development of Luminescent Quantum Dot-Enabled Nano- and
Development of Luminescent Quantum Dot-Enabled Nano- and
Microplatforms for Multiplex Detection of Biomarkers
Microplatforms for Multiplex Detection of Biomarkers
Kristen S. Williams
University of New Orleans, [email protected]
Follow this and additional works at: https://scholarworks.uno.edu/td
Part of the Analytical Chemistry Commons, and the Materials Chemistry Commons
Recommended Citation Recommended Citation
Williams, Kristen S., "Development of Luminescent Quantum Dot-Enabled Nano- and Microplatforms for Multiplex Detection of Biomarkers" (2017). University of New Orleans Theses and Dissertations. 2342.
https://scholarworks.uno.edu/td/2342
This Dissertation is protected by copyright and/or related rights. It has been brought to you by ScholarWorks@UNO with permission from the rights-holder(s). You are free to use this Dissertation in any way that is permitted by the copyright and related rights legislation that applies to your use. For other uses you need to obtain permission from the rights-holder(s) directly, unless additional rights are indicated by a Creative Commons license in the record and/ or on the work itself.
Development of Luminescent Quantum Dot-Enabled Nano- and Microplatforms for Multiplex Detection of Biomarkers
A Dissertation
Submitted to the Graduate Faculty of the University of New Orleans
in partial fulfillment of the requirements for the degree of
Doctor of Philosophy in
Chemistry
by
Kristen Schexnayder Williams
B.S., Louisiana State University, 2010
ii
To my children: for making everything infinitely more meaningful. I hope your dreams
and aspirations in life are limitless. I love you so much. I hope to make you proud.
To my mother: for being my biggest inspiration and the smartest and strongest person I
iii
Acknowledgements
I must express my sincerest gratitude to my research advisor, Dr. Matthew A. Tarr, for
everything he has done for me throughout this journey. His patience, support, and
encouragement have been nothing short of incredible, and I’m truly grateful. I am appreciative of
his overwhelmingly positive outlook, reassurance, and guidance. I wholeheartedly believe that he
cares and advocates for his students, and I personally feel that he has gone above and beyond for me. My experience in Dr. Tarr’s research group has been invaluable, and I am glad to know him.
I would also like to acknowledge my committee members: Dr. John Wiley, Dr. Weilie
Zhou, and Dr. Viktor Poltavets for their feedback and comments. Additionally, I would like to
thank Mr. Harry Rees for always quickly and efficiently fixing computers and instrumentation
when needed.
I am thankful for past and present research group members, especially, Arriel Wicks and
Venkata Kethineedi for teaching me everything they knew about quantum dots, David Bwambok
for his instruction and introduction to human serum albumin research, and Ujwal Patil for always
being available to discuss research ideas. The undergraduate students who have worked with me
have also been helpful on the different projects. I am particularly grateful for group members
Donna Peralta and Parisa Pirani for their fellowship. Sharing an office with those ladies was full of laughter and support, and I’m glad to have formed lifelong friendships with them.
Over the years I have had many wonderful mentors who have directly contributed to my
growth as a student and helped foster a love for research. Dr. Isiah Warner and Dr. Monica
Sylvain from LSU have undoubtedly made a lasting, positive impact on my life. Dr. Warner
iv
Research Scholars Program propelled me into undergraduate research and instilled in me that
obtaining a PhD was not an option but a necessity. From the beginning, Dr. Warner made it
clear that he had an unwavering certainty about my capabilities and repeatedly reminded me of
this as well of his expectations of me. Dr. Monica Sylvain has also been instrumental in helping
me overcome and grow as a person. Her wisdom and faith have pulled me through time and time
again, and she has definitely been an inspiration to me.
My support system is unparalleled. I have been surrounded by people who have helped in
any way possible to allow me to direct my focus on completing this program. My husband, Gabe
Williams, is the most genuine person on the planet. He has been positive, encouraging, patient,
and supportive this entire time. He always believed in me and was a constant outlet for stress. I
am so fortunate to have him by my side. My parents, Lisa and Reed Schexnayder, are my biggest
supporters and have been my entire life. Their unrelenting support is why I am even in any
position to obtain a doctorate. I cannot count the ways they have helped and been there over
these years. My success is a direct result of the foundation they have created for me. My sister,
Adrienne, has spent countless hours as the world’s greatest aunt, and she has offered many
encouraging words throughout this journey. My best friend, Dr. Christina Jones, understands this
journey firsthand, and her support has made this experience much easier. My in-laws, Melanie
and Greg Williams, Sr. have also been there: babysitting, cleaning, cooking, anything to allow
me to focus on school. And I am tremendously grateful for my children, Natalie and Jacob, for
bringing me joy constantly, especially when I needed it most. Earning a PhD would be
significantly more difficult without these people, and I am truly grateful.
I am thankful for everyone who showed support and prayed, and of course, I am thankful
v
Table of Contents
List of Tables ... vii
List of Figures ... viii
List of Schemes ... xi
Abstract ... xii
Chapter 1 Introduction ... 1
1.1 Objectives and Aims ... 1
1.2 Significance... 2
1.3 Fluorescence ... 3
1.4 Quantum Dots ... 7
1.5 Human Serum Albumin ... 12
1.6 Immunoassay Development ... 14
1.7 Atherosclerosis ... 16
1.8 References ... 18
Chapter 2 Synthesis of Water Soluble Mesoporous Silica Quantum Dot Composite Particles ... 26
2.1 Abstract ... 26
2.2 Introduction ... 28
2.3 Experimental Methods ... 30
2.4 Results and Discussion ... 35
2.5 Conclusions ... 45
2.6 References ... 46
Chapter 3 Multiplex Detection of Atherosclerosis Biomarkers Using a Mesoporous Silca Quantum Dot Based Immunoassay ... 49
3.1 Abstract ... 49
3.2 Introduction ... 51
3.3 Experimental Methods ... 53
3.4 Results and Discussion ... 60
3.5 Conclusions ... 75
vi
Chapter 4 Synthesis of Quantum Dot Encapsulated Human Serum Albumin Nanocomposites .. 79
4.2 Introduction ... 80
4.3 Experimental Methods ... 81
4.4 Results and Discussion ... 86
4.5 Conclusions ... 97
4.6 References ... 98
Chapter 5 Multifunctional Human Serum Albumin Nanoparticles for Targeted Drug Delivery 101 5.1 Abstract ... 101
5.2 Introduction ... 103
Part I: Magnetically Triggered Release of Fluorescent Drug Analog from Human Serum Albumin Nanoparticles ... 106
5.3 Experimental Methods ... 106
5.4 Results and Discussion ... 108
Part II: Treatment of Renal Cell Carcinoma with Multifunctional Gold Nanorod Human Serum Albumin Nanoparticles ... 115
5.6 Experimental Methods ... 115
5.7 Results and Discussion ... 116
5.8 Conclusions ... 120
5.9 Acknowledgments... 121
5.10 References ... 121
Chapter 6 Summary and Conclusions ... 124
References ... 127
vii
List of Tables
Table 2.1 – Average ratios, standard deviation, and %RSD of SiQDs ...41
Table 2.2 – Dynamic Light Scattering (DLS) data of SiQD composites ...45
Table 4.1 –Dynamic Light Scattering (DLS) data of HSAPs ...89
viii
List of Figures
Figure 1.1 – Jablonski Diagram ...4
Figure 1.2 – Illustration of the light path through a filter cube of an inverted fluorescence microscope ...7
Figure 1.3 – Illustration of quantum dot size due to the quantum confinement effect ...8
Figure 2.1 –Fluorescence spectra (λex = 400 nm) of CdSe/ZnS QDs emitting at (a) 475 nm, (b) 560 nm, (c) 565 nm, and (d) 620 nm ...36
Figure 2.2 – Digital fluorescence microscope images and fluorescence spectra (λex = 400 nm) of mesoporous silica beads embedded with QDs (a) 480 nm, (b) 560 nm, (c) 620 nm SiQDs ...38
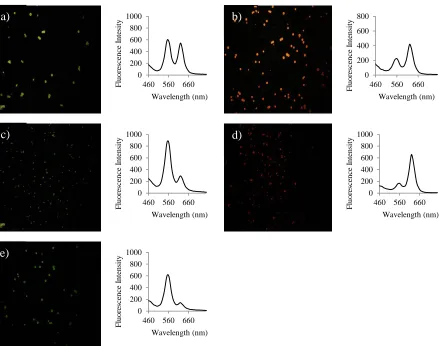
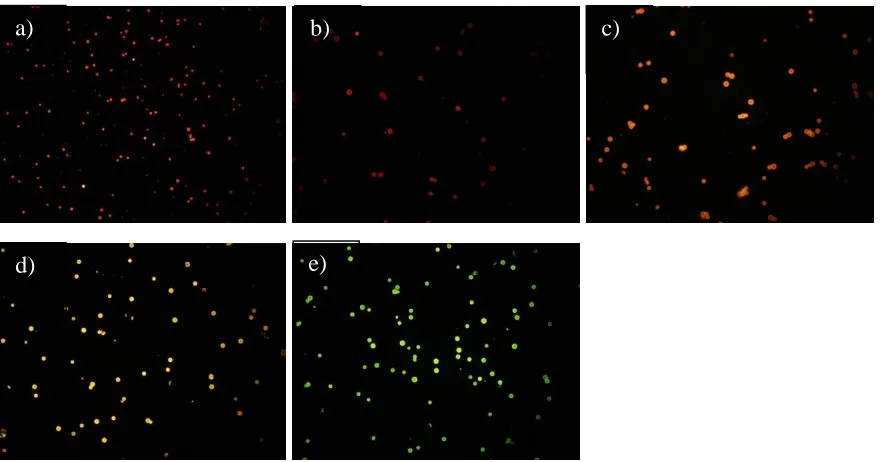
Figure 2.3 – Digital fluorescence microscope images and fluorescence spectra (λex = 400 nm) of mesoporous silica beads embedded with green (565 nm) and red (620 nm) QDs at different ratios: (a) 1:1, (b) 1:2, (c) 3:1, (d) 1:4, (e) 4:1 ...39
Figure 2.4 – Fluorescence emission spectra of individual beads from a 1:4 green to red SiQD sample ...40
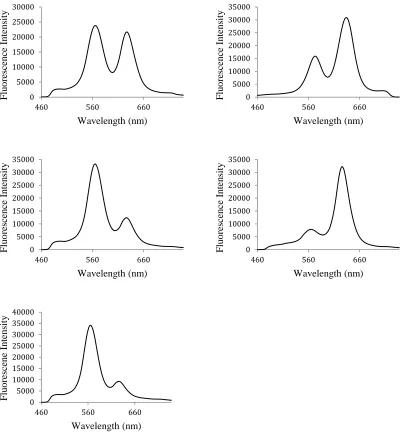
Figure 2.5 – Average fluorescence emission spectra of 20 individual green to red SiQDs: (a) 1:1, (b) 1:2, (c) 3:1, (d) 1:4, (e) 4:1 ...41
Figure 2.6 – SiQD with (a) no TEOS, (b) 25 µL TEOS, (c) 50 µL TEOS, (d) 100 µL TEOS, (e) 200 µL TEOS ...42
Figure 2.7 – Fluorescence emission spectra of SiQD composite particles coated with TEOS ...43
Figure 2.8 – Fluorescence Imaging and Emission Spectra of SiQD-NH2 in H2O ...44
Figure 2.9 – Fluorescence Imaging and Emission Spectra of SiQD-SH in H2O ...44
Figure 3.1 – Fluorescence microscopy imaging of 5 ng/mL of IL-15 from a (a) direct detection assay and (b) sandwich detection assay. The individual spots are the QD-antibody bioconjugates bound to the antigen present in the well. ...62
Figure 3.2 – Fluorescence emission of 5 ng/mL IL-15 protein using a direct detection and sandwich detection immunoassay ...62
ix
Figure 3.4 – Fluorescence emission of 50 ng/mL MCP-1 protein using a direct detection and sandwich detection fluorescence immunoassay...63
Figure 3.5 – Optimization of capture antibodies at 5 ng/mL of IL-15 (orange) and MCP-1
(green) proteins. λex = 400 nm. ...64
Figure 3.6 – Fluorescence microscopy imaging of IL-15: a) 5 ng/mL IL-15 with MCP-1 labeled
SiQDs, b) 5 ng/mL MCP-1 antigen, c) 0 µg/mL, d) 1 pg/mL, e) 5 pg/mL, f) 50 pg/mL, g) 0.5 ng/mL, and h) 5 ng/mL ...67
Figure 3.7 –Fluorescence emission spectra of IL-15 ...68
Figure 3.8 – Fluorescence microscopy imaging of MCP-1: a) 5 ng/mL MCP-1 with IL-15
labeled SiQDs, b) 5 ng/mL IL-15 antigen, c) 0 µg/mL, d) 50 pg/mL, e) 0.5 ng/mL, f) 5 ng/mL, and g) 50 ng/mL ...69
Figure 3.9 –Fluorescence emission spectra of MCP-1 ...70
Figure 3.10 –Fluorescence microscopy imaging of IL-15: a) 5 ng/mL IL-15 with MCP-1
labeled SiQDs, b) 5 ng/mL MCP-1 antigen, c) 0 µg/mL, d) 1 pg/mL, e) 5 pg/mL, f) 50 pg/mL, g) 0.5 ng/mL, and h) 5 ng/mL ...72
Figure 3.11 – Fluorescence emission spectra of IL-15 ...72
Figure 3.12 – Fluorescence microscopy imaging of MCP-1: a) 5 ng/mL MCP-1 with IL-15
labeled SiQDs, b) 5 ng/mL IL-15 antigen, c) 0 µg/mL, d) 50 pg/mL, e) 0.5 ng/mL, f) 5 ng/mL, and g) 50 ng/mL ...73
Figure 3.13 –Fluorescence emission spectra of MCP-1 ...74
Figure 3.14 – Multiplexing of IL-15 and MCP-1: a) 50 ng/mL MCP-1 and 5 ng/mL IL-15, b) 50 ng/mL MCP-1 and 5 ng/mL IL-15, c) 5 ng/mL MCP-1 and 5 ng/mL IL-15 ...75
Figure 3.15 –Multiplex Immunoassay of IL-15 and MCP-1 ...75
Figure 4.1 –Digital Fluorescence Microscopy Image and Emission Spectra of empty HSAPs ..87
Figure 4.2 –Digital Fluorescence Microscopy Image and Emission Spectra of HSAPs loaded with Rhodamine 6G chloride ...88
Figure 4.3 – Digital Fluorescence Microscopy Image and Emission Spectra of HSAP-QD (600
nm) ...88
x
Figure 4.5 – Photostability measurements of HSAP-QDs and HSAP-Rhodamine dye ...90
Figure 4.6 – Fluorescence Intensity of Fluorophore Released from HSAPs over 10 Days ...92
Figure 4.7 –Digital Fluorescence Microscopy of IL-15 sandwich assay detection: a) 50 pg/mL, b) 0.5 ng/mL, and c) 5 ng/mL ...94
Figure 4.8 – Fluorescence emission spectra of IL-15 using HSAP-QD (600 nm) ...95
Figure 4.9 – Digital Fluorescence Microscopy of MCP-1 sandwich assay detection: a) 0.5
pg/mL, b) 5 ng/mL, and c) 50 ng/mL ...95
Figure 4.10 – Fluorescence emission spectra of MCP-1 using HSAP-QD (560 nm) ...96
Figure 4.11 –Multiplex detection of IL-15 and MCP-1 using HSAP-QD (600 nm) conjugated to IL-15 and HSAP-QD (560 nm) conjugated to MCP-1 ...97
Figure 5.1 – Electron microscopy images of multifunctional human serum albumin
nanoparticles: (a) SEM image (10 kV), (b) TEM image (200 kV, room temperature), and (c) TEM image (80 kV, -78 °C) ...108
Figure 5.2 –Field dependent magnetization of HSAP nanoparticles ...110
Figure 5.3 – Release of fluorescein-5-thiosemicarbazide from magnetic HSAP nanoparticles as a function of magnetic field strength ...111
Figure 5.4 – Release of fluorescein-5-thiosemicarbazide from magnetic HSAP nanoparticles as a function of time ...112
Figure 5.5 – Fluorescence microscopy images of the release of fluorescein-5-thiosemicarbazide after magnetic treatment for (a) 0 min, (b) 10 min, and (c) 30 min ...113
Figure 5.6 –Change in diameter of magnetic multifunctional HSAP nanoparticles over time after magnetic field treatment ...113
Figure 5.7 –TEM image of HSA-AuNR-TKI nanoparticle ...116
Figure 5.8 – Percentage of tumor necrosis and average tumor size after treatment ...117
xi
List of Schemes
Scheme 1.1 - Schematic representation of a fluorescence sandwich immunoassay ...15
Scheme 2.1 – Synthesis of CdSe/ZnS Quantum Dots ...31
Scheme 2.2 – Schematic representation of the hydrophobic interactions between the hydrocarbon chain of the silica pore wall and the TOPO capping ligand on the quantum dot surface ...37
Scheme 3.1 – Schematic representation of quantum dot fluorescence immunoassays ...59
Scheme 3.2 – Reaction scheme for conjugating antibodies with SiQD-SH with Sulfo-SMCC. Silica spheres are represented by spheres with green dots (not to scale). ...66
Scheme 3.3 – Reaction scheme for conjugating antibodies with SiQD-NH2 composites with
EGS. Silica spheres are represented by spheres with green dots (not to scale). ...71
xii
Abstract
Luminescent semiconductor quantum dots (QDs) are extensively researched for use in
biological applications. They have unique optical and physical properties that make them
excellent candidates to replace conventional organic dyes for cellular labeling, multiplexing,
nucleic acid detection, and as generalized probes. The primary focus of this dissertation was to
utilize quantum dots for improvement in immunoassays. Specifically, atherosclerosis biomarkers
were detected simultaneously in an effort to demonstrate advances in early detection diagnostics.
Quantum dot-antibody bioconjugates were prepared by encapsulation into mesoporous
silica and functionalized with thiol and amine groups to enable bioconjugation. Functionalization
of the mesoporous silica quantum dot composites facilitated biocompatibility for use with
biological buffers in immunoassays. These bioconjugates were used in a sandwich immunoassay
to detect atherosclerosis biomarkers IL-15 and MCP-1. Sandwich assays employ capture
antibodies immobilized onto a well plate to bind as much of the antigen as possible. The capture
antibodies increased binding by at least 4 times the amount of antigen bound to the surface of a
direct detection assay. The sandwich immunoassay was able to detect 1 pg/mL of IL-15 and 50
pg/mL of MCP-1 biomarkers.
Human serum albumin nanoparticles (HSAPs) were synthesized via a desolvation and
crosslinking method. Human serum albumin is a versatile protein being used in a variety of
applications. Quantum dots were loaded into HSAPs as potential detection probes for
immunoassays. Efficient loading was not achieved, and the assay was unable to improve current
xiii
Controlled release studies were explored using HSAPs loaded with superparamagnetic
iron oxide nanoparticles and a fluorescent drug analog. Exposure to a magnetic field resulted in
degradation of the HSAPs. The fluorophore was released and measured to examine how cancer
drugs might be controlled through a magnetic field. Gold nanorods and an anticancer drug,
Sorafenib, were also encapsulated into HSAPs for treatment of renal cell carcinoma in vivo.
Laser irradiation treatment combined with Sorafenib resulted in 100% tumor necrosis and total
elimination of any viable tumor present. HSAPs have demonstrated remarkable potential as drug
delivery nanocarriers.
Keywords: Quantum dots, fluorescence, silica, immunoassay, multiplexing, atherosclerosis,
1
Chapter 1
Introduction
1.1 Objectives and Aims
The main objective of this research was to develop and optimize a sensitive multiplex
bioanalytical assay utilizing luminescent semiconductor quantum dots to detect the presence of
atherosclerosis biomarkers. Quantum dots have a wide array of advantages over conventional
organic dye molecules used for analysis methods. Encapsulating quantum dots into mesoporous
silica provides a multitude of barcodes for detection assays. Human serum albumin nanoparticles
have also shown potential as a multifunctional analytical diagnostic and therapeutic tool.
Employing quantum dots into human serum albumin nanoparticles can further enhance
barcoding agents for theranostic applications. Additionally, the versatility of human serum
albumin nanoparticles was explored as multimodal nanocarriers for targeted drug delivery
utilizing combined methods of controlled release with nanoparticle materials. The specific aims
of this research were 1) synthesis of water-soluble quantum dot loaded mesoporous silica
composite particles as biosensors, 2) preparation of human serum albumin nanoparticles loaded
with quantum dots, 3) multiplex detection of atherosclerosis biomarkers using a
fluorescence-based immunoassay, and 4) exploration of targeted drug delivery using human serum albumin
2
1.2 Significance
Early disease detection and prevention is critical across all arenas of healthcare
worldwide. Rapid and effective diagnosis of many diseases could lead to earlier treatment
assessments, improve prognosis, and increase lifetimes. Diagnostic tests and early screenings are
only reliable when the tests are sensitive, precise, and specific.1 New biomarkers are constantly
being discovered for different cancers and diseases, and the need for consistent and accurate
means of detection is increasing.2-3 This research mostly focuses on detection of atherosclerosis
biomarkers. Atherosclerosis is a main component of cardiovascular disease (CVD), which is the
leading cause of death for men and women globally.4-6 Earlier detection of atherosclerosis is
critical in order to reduce the astounding financial costs related to treatment and assessment as well as to reduce the likelihood of heart attack or stroke over an individual’s lifetime.7-8
Bioanalytical immunoassays are one of the main tools for measuring the presence of elevated
levels of biomarkers in biological fluids such as blood serum and urine.9-10 Immunoassays
depend on specific, inherent antibody-antigen binding to indicate the presence of a given marker,
however, many key factors affect the sensitivity and reproducibility of the assays.9, 11-12 One
component, in particular, is the detection reagent or probe used that produces the signal
specifying the amount of analyte present.10 Many bioassays rely on fluorophores to measure the
amount of a given protein because fluorescent molecules can be detected with high specificity,
but they can be limited chemically and physically.9, 13-18 Photobleaching, low fluorescence
quantum yield, and broad emission spectra are a few of the limitations of conventional organic
dyes.13, 18 Luminescent semiconductor quantum dots (QDs) have advantages over organic dyes
3
This research primarily focused on exploiting the unique properties of semiconductor
QDs to produce a simple, rapid, and reliable immunoassay capable of detecting multiple analytes
at once while improving current detection limits. Encapsulating QDs into mesoporous silica
enhances their brightness and provides easy surface functionalization for bioconjugation.22-28
QDs were also loaded into human serum albumin nanoparticles (HSAPs) to develop a new
bioprobe with potential use as a detection agent in bioassays or to enhance other fluorescently
labeled albumin probes currently used for cell tracking and imaging tools.29-30 Moreover, HSAPs
were further explored to examine their multimodal functionality as targeted and controlled drug
release agents. Encapsulating superparamagnetic iron oxide nanoparticles with a fluorescent drug
analog provides insight on how a drug would be released from HSAPs via magnetic
hyperthermia.31-32 Loading gold nanoparticles into HSAPs for degradation via laser irradiation
shows definite promise for controlled release of anticancer drugs directly at tumor sites.33-35
1.3 Fluorescence
1.3.1 The Fluorescence Process
Fluorescence is the emission of light by a substance due to absorption of a photon or
other electromagnetic radiation.36 It is the result of a three-stage process: excitation, excited-state
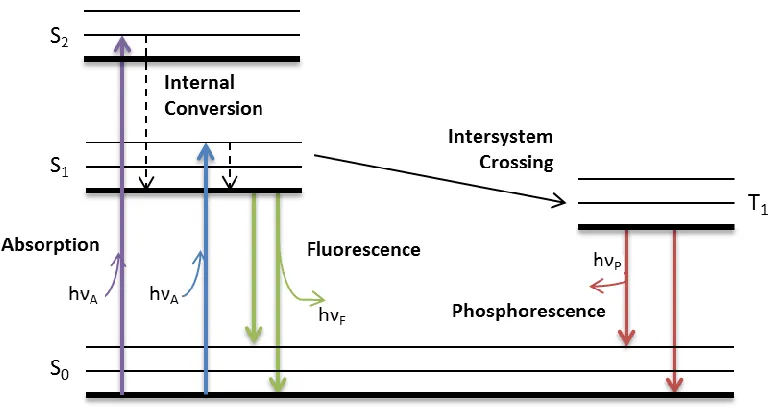
lifetime, and emission; this process is best illustrated by the Jablonksi diagram (Figure 1.1). The
Jablonksi diagram depicts the processes that occur between absorption and emission.
Fluorophores are typically polyaromatic hydrocarbons or heterocycles that can reach an excited
state upon absorption of a photon and then emit light energy. The light energy emitted is at a
4
Figure 1.1 Jablonski Diagram.
During excitation, the fluorophore absorbs a photon usually from an incandescent lamp
or laser, and an electron moves to an excited electronic state (S1 or S2). The excited state lasts for
about 10-15 s, and during this time the fluorophore interacts with its molecular environment and
can undergo conformational changes. Vibrational relaxation occurs and the electron moves to the
ground level of the S1 state, and some energy is lost as heat during the process. From here the
electron can relax back to the ground state (S0) and emit a photon of a lower energy and longer
wavelength than the absorbed photon. This is the phenomenon of fluorescence. The electron can
also relax back to the ground state through internal conversion, which is non-radiative, and a
photon is not emitted, however, energy is lost through heat. If the electron in the S1 state
transitions to the triplet state (T1), intersystem crossing occurs. Here, the electron can either relax
to the S0 ground state and emit a photon as phosphorescence, or it can go back to the S1 state and
then to the S0 ground state emitting a photon as delayed fluorescence. Photons emitting via
phosphorescence will have an even lower energy and longer wavelength than fluorescence. An
electron can also travel from T1 to S0 in a non-radiative form not emitting a photon, but losing
5
to the number of photons absorbed and is a measure of the extent to which the different
processes may occur.
Fluorescence emission occurs when an excited electron relaxes back to the ground state
and emits a photon. The energy is lower than that of the absorbed photon, and the difference in energy or wavelength (hυex – hυem) is called the Stokes shift. The Stokes shift is important to
fluorescence techniques because it allows emission to be detected against a low background.
1.3.2 Fluorescence Spectroscopy
Fluorescence emission can be analyzed through several different detection systems.
Fluorescence spectrofluorometers and microplate readers are common instrumentation utilized
for detection. Most fluorescence instruments have four basic items: 1) a light source, 2) a sample
holder, 3) wavelength filters to isolate excitation photons and emission photons, and 4) a detector
to read emission photons and produce a visual output of analysis.37 Fluorescence spectroscopy
measurements performed in this work were measured primarily by a SpectraMax M2 microplate
reader (Molecular Devices, Inc). This plate reader contains a Xenon flash lamp source and a
photmultiplier (R-3896) detector. There is a built in excitation monochromator and emission
monochromator that allows for detection of absorbance and fluorescence at multiple
wavelengths. The light source is irradiated to the excitation monochromator allowing only
certain wavelengths to pass through. The excited light passes through 1 mm fiber optic bundles
to the microplate port where the light is directed to a focusing oval mirror. Incident light enters
the sample from the top of the microplate, and the reflected light travels to the emission
6
1.3.3 Digital Fluorescence Microscopy
Fluorescence microscopy is a technique for viewing and detecting fluorescence or
phosphorescence in a substance. The microscope combines the magnifying properties of an
optical light microscope with fluorescence technology allowing excitation and emission
detection of the sample. Images are acquired based entirely on the fluorescence emission
properties of the sample. This is particularly useful for live cell imaging within tissues, and
proteins that are stained or exhibit a natural fluorescence can be imaged and tracked. An inverted
fluorescence microscope is typically used for imaging. The components of the microscope are
similar to that of a light microscope, but fluorescence microscopes include a powerful light
source such as a xenon or mercury arc lamp that can emit light from UV-IR wavelengths. Filter
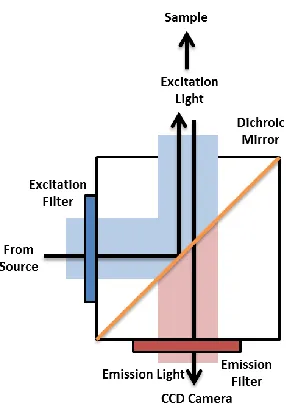
cubes are another difference from traditional light microscopes; they are composed of an
excitation filter, a dichroic mirror, and an emission filter (Figure 1.2). Light leaves the arc lamp
and is directed through an excitation filter that selects the excitation wavelength. This light is
reflected toward the sample by a dichroic mirror that only reflects light at the desired excitation
wavelength. The light passes through to the objective and is focused onto the sample. The
sample gives off its own fluorescence emission that passes back through the objective and is
magnified. Epifluorescence is when the emission and excitation light pass through the same
objective and can reduce the signal-to-noise ratio. The emission light passes through the dichroic
mirror and through an emission bandpass filter. The bandpass filter only allows certain
wavelengths to pass through thereby reducing the background, and the filtered light is sent to a
detector such as a charge coupled device (CCD) camera where the image can be acquired
digitally. The filtered emission light can also be directed to a spectrograph which can display the
7
and emission wavelengths used in the filter cube, and multiple combinations of filter cubes can
be assembled for any given fluorescent sample type.
Figure 1.2 Illustration of the light path through a filter cube of an inverted fluorescence microscope.
1.4 Quantum Dots
1.4.1 Structural Properties
Quantum dots (QDs) are luminescent semiconductor nanocrystalline particles with
unique chemical, structural, and photophysical properties.38-41 They are composed of elements
from groups II-IV (CdSe, CdS, CdTe, ZnS, ZnO, ZnSe), III-V (InP, InAs, GaP, GaN, GaAs), and
(PbS, PbSe, PbTe) of the periodic table.38, 40, 42-44 QDs average 2-10 nm in diameter and can
contain hundreds to thousands of atoms.17, 21, 38 They approach the size of the exciton Bohr
radius; the average distance in an electron-hole pair is confined in all three dimensions.38, 45
Because both electrons and holes are confined to a small region, the mode of recombination is
8
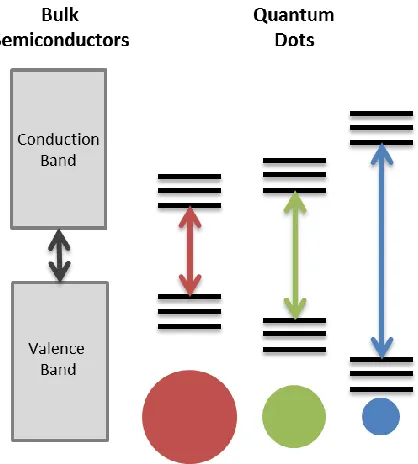
from bulk materials in that they are characterized by discrete atomic-like states.47 Bulk
semiconductors have continuous energy levels with a fixed bandgap energy, but the bandgap
energy of QDs is determined by its radius. QDs experience the quantum confinement effect,
which is why they have discrete energy levels with finite separation between them (Figure 1.3).48
The addition or subtraction of a few atoms can alter the boundaries of the bandgap. Quantum
confinement causes increased stress on the exciton resulting in increased energy of the emitted
photon. Smaller QDs have less room for exciton separation and more energy is required to form
the exciton so photons will be emitted at lower wavelengths. Adjusting the size of the bandgap
changes emission frequency, and changes in surface geometry can affect the bandgap energy.
These factors allow control over the output wavelength of QD emission.
Figure 1.3 Illustration of quantum dot size due to the quantum confinement effect.
1.4.2 Optical Properties
The quantum confinement effect is essentially responsible for the unique optical
9
electron in the valence band is excited by photon absorption and moves to the conduction band, a
hole is left in the valence band. When the electron relaxes back to the valence band, light is
emitted as fluorescence. QDs have a broad absorption spectrum with narrow emission peaks, and
relative to other common fluorophores, QDs are highly photostable. They have high emission
quantum yield, a large molar extinction coefficient and are exceptionally bright. QDs also have a
long fluorescence lifetime as well as a large Stokes shift and size dependent tunability. The
surface of the QDs influences photoluminescence because of trap states that cause nonradiative
electron transitions resulting in low quantum yield. Trap states usually occur due to dangling
bonds or vacancies at the surface. Coating QDs, also known as surface passivation, with a shell
of a higher bandgap semiconductor raises the quantum yield by reducing these effects. Zinc
sulfide is commonly used as a coating shell because it enhances quantum yield, chemical
stability, and photostability of the QDs.
1.4.3 Synthesis of Quantum Dots
QDs are synthesized through various physical or chemical methods.46 Physical processes
include high-energy input through molecular beam epitaxy and metal organic chemical vapor
deposition.38 More recently, however, chemical methods are typically used such as high
temperature particle growth on solid substrates or by low energy input colloidal chemical
precipitation.40 Colloidal semiconductor synthesis is the most successful method in terms of
quality and monodispersity. The system is based on the pyrolysis of organometallic precursors in
hot coordinating solvents.38 Changing the temperature, concentrations, time, and ligand
molecules precisely controls size tuning of colloidal QDs.49 The most widely used and
synthesized QDs are CdSe because it has tunable absorption energy throughout the UV-Vis-NIR
10
Synthesis of CdE (E = S, Se, Te) was first published by Murray et al. from MIT in 1993;
they reacted dimethylcadmium Cd(CH3)2 in trioctylphosphine (TOP) with a solution of
trioctylphosphine selenide (TOPSe) at high temperatures.52 Eventually, the procedure was
modified by Peng et al by replacing Cd(CH3)2 with CdO, Cd(Ac)2, and CdCO3, and these
cadmium precursors are typically used today.53-54 The mechanism for colloidal nanocrystal
growth has been proposed to proceed from nucleation resulting from rapid injection of
precursors into a hot coordinating solvent.38, 52-53, 55 The reagents undergo thermal decomposition
and there is a supersaturation of monomers present. Monomers are added to the QD nuclei, and
once the concentration is depleted, further growth proceeds by Ostwald ripening.38 The QD core
can have low quantum yield due to surface defects, vacancies, and dangling bonds on the
surface.56 When the excited electron or hole is trapped due to defects low quantum yield can
result from nonradiative recombination. A shell of a higher bandgap semiconductor material is
often added to overcome these defects and protect the QD core. ZnS is most ofted added to CdSe
core QDs, and the ZnS shell reduces QD toxicity, improves quantum yield, and enhances
photostability.
1.4.4 Bioconjugation of Quantum Dots
Inorganic quantum dots are synthesized in organic solvents, which is not suitable for
biological applications. For QDs to be used as fluorescent labels they need to be soluble in
aqueous solvents which requires either a surface ligand exchange or encapsulation in amphiphilic
media for bioconjugation. Exchanging the trioctylphosphine oxide (TOPO) capping ligand for
16-mercaptohexadecanoic acid (MHDA) enables water solubility of the QDs; however, there is
often a decrease in quantum yield and brightness after the ligand exchange.57-58 The ligands bind
11
the other enables hydrophilicity. Other ligands used to replace TOPO include dihydrolipoic acid
(DHLA), dithiothreitol (DTT), mercaptoacetic acid (MAA), and 11-mercaptoundecanoic acid
(MUA).59-62 The thiol bond to the ZnS shell is not strong enough, so QD encapsulation is a more
appropriate method for water solubility.
Doping QDs into porous or mesoporous polystyrene and silica particles has shown great
retention of luminescent properties.28, 63-64 Polystyrene-encapsulated QDs are prepared through
an emulsion polymerization method.65-66 Polystyrene beads are dissolved in an organic solution
causing them to swell and enlarge their pores. The QDs penetrate the pores and adsorb to the
hydrophobic walls. Upon removal of the solvent, the pores contract, and the QDs remain inside
of the polystyrene beads.67 Silica encapsulation has also been shown to increase the brightness of
QDs of a single probe by encapsulating thousands of QDs into one silica particle.28, 58 Silica
growth on the QD surface is possible through the Stöber synthesis method.27, 68 This is a one-step
method that does not utilize toxic solvents.69 Tetraethyl orthosilicate (TEOS) condenses in
ethanol/water mixtures at room temperature.58, 70-71 Multiple QDs of different sizes and emission
wavelengths can be incorporated into the silica pores and remain stable due to strong
hydrophobic interactions.28
The main bioconjugation methods for attachment to QDs are covalent modification,
direct attachment, and electrostatic interactions.13, 72-73 Covalent modifications involve
biomolecules attached to functional groups on the QD ligand surface. Amine (-NH2), thiol (-SH),
and carboxyl (-COOH) groups all attach to QDs via covalent modifications. Direct attachment to
QDs includes metal-affinity coordination to Zn atoms as well as dative thiol bonding. Proteins
can also bind to QDs through electrostatic interactions. Quantum dot bioconjugates enable them
12
1.4.5 Applications of Quantum Dots
The unique tunable properties of QDs make them useful in a wide variety of applications.
Quantum computing, solar cells, LEDs, televisions, and diode lasers are a few of the applications
currently under investigation for enhancement with QDs.38-39, 46 There is ongoing research to
replace incandescent light bulbs with red, green, and blue QDs.
QDs were first described in a biological context in 1998 by Nie and Alivisatos.59, 74
Inorganic QDs are limited for use in in vivo applications, especially CdSe QDs, but they are
widely utilized for in vitro biological applications. QDs are often used as biosensors for
immunoassays, generalized probes, nucleic acid detection, and fluorescence resonance energy
transfer (FRET).13-14, 75-80 QDs have also been used for cellular labeling and imaging, and they
have increased photoluminescence over conventional organic dyes.16, 44, 81-82 The greatest
potential of quantum dot antibody bioconjugates for biosensing is multiplexing.13, 83
Multiplexing is the simultaneous detection of multiple analytes in an immunoassay.9, 80
QD-bioconjugates are constantly improving the sensitivity of clinical applications.2, 11, 84
1.5 Human Serum Albumin
Human serum albumin (HSA) is the most abundant blood plasma protein comprising
about 50% of the total protein present.85 It has extraordinary ligand binding capabilities that
make it excellent for many bioapplications.86 HSA has a molecular weight of 65 kDa and
contains 585 amino acids including 35 cysteine residues that form 17 disulfide bridges with one
free thiol, and it also has one fluorescent tryptophan.85, 87 HSA is naturally biocompatible,
biodegradable, and non-toxic.86, 88-90 The large amount of charged amino acids provide easy
surface functionalization capabilities.86 HSA molecules are able to pass freely throughout the
13
HSA molecules can form dimers and aggregate together for nanoparticle preparation.86
Human serum albumin nanoparticles (HSAPs) are typically prepared through an alcoholic
desolvation method.88, 93-96 The alcohols unfold or denature the tertiary structure of the albumin,
and aggregates naturally coacervate or come together through electrostatic and hydrophobic
interactions.97-98 A crosslinking agent such as glutaraldehyde then binds amine groups of lysine
and arginine amino acids to one another forming albumin nanoparticles.85, 90, 99
The diameter of HSAPs is dependent on experimental conditions, and modification of the
different parameters gives control over the nanoparticle size.94 The rate at which ethanol is added
to initiate desolvation affects the particle size and polydispersity. Adding ethanol at about 1
mL/min creates monodisperse HSAPs that average 200 nm in diameter.88 Furthermore, the pH
prior to desolvation also regulates particle size. For HSAPs averaging 200 nm, the optimal pH is
7. Adjusting the pH to 8.2 decreases particle size, and significantly lowering the pH causes
aggregation of initial aqueous albumin solution.88, 98
HSAPs have extraordinary potential for use in a wide range of bioapplications.85 They
show promise particularly as vehicles for controlled release and targeted drug delivery, and they
exhibit multimodal functionality.100 As nanocarriers, HSAPs can transport toxic and insoluble
drugs throughout the body directly to tumor sites effectively improving current chemotherapeutic
techniques.91, 101-103 HSAPs covalently encapsulate and conjugate drugs with high loading
efficiency for transport.102, 104 Loading other metallic, organic, or inorganic materials with the
chemotherapeutic drug allows for controlled release.33, 105-106 Nanoparticle degradation and
release of the drugs can be facilitated by magnetic nanoparticles or gold nanoparticles through
14
HSAPs to tumor sites also spares exposure of toxic chemotherapeutic agents to neighboring
healthy cells.89, 103, 107-108
1.6 Immunoassay Development
Many methods of protein detection are available and widely researched including: flow
cytometry, western blots, immunoprecipitation, and immunohistochemistry. The best method,
however, for quantifying the amount of a protein present is through a bioanalytical assay.
Immunoassays are analytical tools for quantifying molecules based on selectivity and specificity
of antigens and antibodies.9 They were first developed in the 1950s by Rosalyn Yalow and
Solomon Berson who investigated radioisotope tracings to measure biological substances in
human blood.109 The main types of immunoassays are: 1) competitive, 2) antigen-down, and 3)
sandwich.9 Competitive binding assays are based upon competition of a labeled and unlabeled
antigen for a limited number of binding sites on an antibody. A known amount of labeled,
unbound antigen is added, and it is measured by its ability to compete with the unlabeled antigen.
It gets blocked from binding to the antibody. The more analyte present in the sample, the more
the labeled antigen is blocked from binding so the amount of labeled, unbound antigen is
proportional to the amount of analyte present in the sample.110 Antigen-down assays involve
binding an antigen to a solid surface for binding to antibodies present in a sample. Another
labeled secondary antibody is added that binds to the antibodies in the sample. The signal from
the labeled secondary antibody is proportional to the amount of primary antibody present.80
Sandwich assays are the most robust and sensitive.9, 13 They utilize a primary antibody and a
secondary antibody to each bind to an antigen (Figure 1.4). The primary antibody is also known
as the capture antibody. Monoclonal antibodies are often used as the primary antibody because
15
antigens in the same orientation on a well plate. After the antigen is added, a labeled, secondary
detection antibody is added. This antibody is usually polyclonal and can bind to multiple
epitopes on a given antigen, thereby increasing the antigen-antibody binding so that as much of
the antigen as possible can be detected.12, 21, 111
Schematic 1.1 Schematic representation of a fluorescence sandwich immunoassay.
Selection of the detection label for the antibody is a critical factor in improving sensitivity of the
immunoassay.9 Examples include radioactive isotopes, DNA reporters, and chemiluminescent
tags.80, 112 The most popular labels are enzymes such as horseradish peroxidase and alkaline
phosphatase. Enzyme labels are used in enzyme-linked immunosorbent assays (ELISAs), and
they are currently the most commercially available assay type.9 In a sandwich ELISA, a capture
antibody is bound to the surface, nonspecific binding sites are blocked, and the antigen is added
for capture by the primary antibody. Another antibody is added forming the sandwich, and it
binds specifically to the antigen. ELISAs require an additional secondary antibody that is linked
16
chemical is added that converts the enzyme into a fluorescent or electrochemical signal.113 The
antigen can be quantified by measuring the absorbance or fluorescence of the signal.113-114
Typically, the enzymatic reaction is short-term, and the signal must be measured immediately.
Other limitations include false positives and negatives as well as altered enzymatic activity due
to assay constituents. Replacing the label from an enzyme to quantum dots eliminates the need
for a third antibody and reduces the chance for nonspecific binding.13, 20, 30, 79, 115-119
1.7 Atherosclerosis
Cardiovascular disease (CVD) is the leading cause of death worldwide for men and
women accounting for about 1 in 3 deaths.8 Atherosclerosis is a condition where the vascular
arteries harden and increase in thickness, and it is a main contributor to CVD.5-6 An
atherosclerotic plaque can lead to heart attack or stroke if it ruptures. Typically, cholesterol and
other fatty materials or atheroma accumulate in an artery and lead to blockages that restrict blood
flow, which can form blood clots.7 Atherosclerosis is a chronic disease, and it is not unusual for
plaque formation to begin during childhood. The formation of an atherosclerotic plaque takes
place over a series of steps. Low-density lipoproteins (LDL) transport cholesterol from the liver
to the cells, and when it is oxidized it can cause damage to an artery wall.4, 7 Macrophages or
white blood cells are then sent to the artery wall to repair and absorb the oxidized-LDL. This
reaction forms foam cells, and accumulation of foam cells forms plaque in the artery wall.5 Two
types of plaque can form: stable or unstable. Stable plaque formation is usually not harmful; the
artery wall will increase in diameter and blood flow will not be restricted. They are
asymptomatic and contain smooth muscle cells. Unstable plaques, however, have a tendency to
rupture and increase the incidence of blood clots.7 They are composed of macrophages and foam
17
Additionally, when plaques harden or calcify blood flow is also restricted, blood pressure is
increased, and risk for clots rise.120
Monitoring the progression of atherosclerosis could greatly improve prognosis and
reduce the risk for plaque rupture. Detection for atherosclerosis is in dire need of enhancement in
order to lower the number of fatal cardiovascular events. Unfortunately, diagnosis of
atherosclerosis occurs typically after plaque formation has occurred. Angiograms, stress tests,
cholesterol tests, X-rays, computed tomography (CT) scans, and electrocardiograms (EKG) are
often ordered to examine abnormal behavior in the vascular system.8 Imaging techniques are
beneficial, but they are used to search for atheroma and assess the condition of the artery walls.
Angiograms can provide information on the lipid-rich plaques in an artery, but again, this is not
ideal for early detection or monitoring of the progression of atherosclerosis. CT scans are
effective at imaging calcification, but there must be substantial plaque present for imaging.
Recently, clinical intravascular ultrasounds have been able to detect and measure atheroma, but it
is invasive, extremely costly, and not widely utilized.
Several biomarkers have recently been identified as indicative of atherosclerotic plaques
at various stages of plaque development from as early as the development of precursor legions to
fatty acid streaks and complete lipid-rich plaques.4 Monocyte chemoattractant protein-1 (MCP-1)
and interleukin 15 (IL-15) are two of the more recently discovered biomarkers.121-122 MCP-1 is a
chemokine that rises in macrophage-rich areas of atherosclerotic plaques.123 Chemokines are
released in response to signals from proinflammatory cytokines. IL-15 is a cytokine expressed in
immune cells and atherosclerotic lesions.124 It is uniquely found in lipid-rich plaques in complex
18
patients with coronary artery disease.124 Early detection of these biomarkers could lead to early
treatment and assessment of atherosclerosis leading to improved prognosis for CVD.7
1.8 References
1. Wilson, J.; Junger, G.; Organization, W. H., Principles and practice of screening for disease. Geneva: World Health Organization 1968.
2. Jaishree, V.; Gupta, P. D., Nanotechnology: A Revolution in Cancer Diagnosis. Indian J
Clin Biochem 2012,27 (3), 214-20.
3. Gobbo, O. L.; Sjaastad, K.; Radomski, M. W.; Volkov, Y.; Prina-Mello, A., Magnetic Nanoparticles in Cancer Theranostics. Theranostics 2015,5 (11), 1249-63.
4. Brown, T. M.; Bittner, V., Biomarkers of Atherosclerosis: Clinical Applications. Current
cardiology reports 2008,10 (6), 497-504.
5. Ross, R., Atherosclerosis — An Inflammatory Disease. New England Journal of
Medicine 1999,340 (2), 115-126.
6. Ross, R., The pathogenesis of atherosclerosis: a perspective for the 1990s. Nature 1993,
362 (6423), 801-809.
7. Libby, P.; Ridker, P. M.; Hansson, G. K., Progress and challenges in translating the biology of atherosclerosis. Nature 2011,473 (7347), 317-325.
8. Benjamin, E. J.; Blaha, M. J.; Chiuve, S. E.; Cushman, M.; Das, S. R.; Deo, R.; de Ferranti, S. D.; Floyd, J.; Fornage, M.; Gillespie, C.; Isasi, C. R.; Jiménez, M. C.; Jordan, L. C.; Judd, S. E.; Lackland, D.; Lichtman, J. H.; Lisabeth, L.; Liu, S.; Longenecker, C. T.; Mackey, R. H.; Matsushita, K.; Mozaffarian, D.; Mussolino, M. E.; Nasir, K.; Neumar, R. W.; Palaniappan, L.; Pandey, D. K.; Thiagarajan, R. R.; Reeves, M. J.; Ritchey, M.; Rodriguez, C. J.; Roth, G. A.; Rosamond, W. D.; Sasson, C.; Towfighi, A.; Tsao, C. W.; Turner, M. B.; Virani, S. S.; Voeks, J. H.; Willey, J. Z.; Wilkins, J. T.; Wu, J. H. Y.; Alger, H. M.; Wong, S. S.; Muntner, P., Heart Disease and Stroke Statistics—2017 Update: A Report From the American Heart Association.
Circulation 2017.
9. Cox, K. L.; Devanarayan, V.; Kriauciunas, A.; Manetta, J.; Montrose, C.; Sittampalam, S., Immunoassay Methods. 2004.
10. Yamanishi, C. D.; Chiu, J. H.; Takayama, S., Systems for multiplexing homogeneous immunoassays. Bioanalysis 2015,7 (12), 1545-56.
11. Hu, M.; Yan, J.; He, Y.; Lu, H.; Weng, L.; Song, S.; Fan, C.; Wang, L., Ultrasensitive, multiplexed detection of cancer biomarkers directly in serum by using a quantum dot-based microfluidic protein chip. ACS Nano 2010,4 (1), 488-94.
12. Goldman, E. R.; Balighian, E. D.; Mattoussi, H.; Kuno, M. K.; Mauro, J. M.; Tran, P. T.; Anderson, G. P., Avidin: A Natural Bridge for Quantum Dot-Antibody Conjugates. Journal of
the American Chemical Society 2002,124 (22), 6378-6382.
13. Sapsford, K. E.; Pons, T.; Medintz, I. L.; Mattoussi, H., Biosensing with Luminescent Semiconductor Quantum Dots. Sensors (Basel, Switzerland) 2006,6 (8), 925-953.
14. Law, J. W.; Ab Mutalib, N. S.; Chan, K. G.; Lee, L. H., Rapid methods for the detection of foodborne bacterial pathogens: principles, applications, advantages and limitations. Front
19
15. Cao, L.; Yang, S.-T.; Wang, X.; Luo, P. G.; Liu, J.-H.; Sahu, S.; Liu, Y.; Sun, Y.-P., Competitive Performance of Carbon “Quantum” Dots in Optical Bioimaging. Theranostics 2012,
2 (3), 295-301.
16. Gao, X.; Yang, L.; Petros, J. A.; Marshall, F. F.; Simons, J. W.; Nie, S., In vivo
molecular and cellular imaging with quantum dots. Curr Opin Biotechnol 2005,16 (1), 63-72. 17. Hotz, C., Applications of Quantum Dots in Biology. In Methods in Molecular Biology, Rosenthal, S. J.; Wright, D. W., Eds. Humana Press Inc: Totowa, NJ, 2005; Vol. 303.
18. Resch-Genger, U.; Grabolle, M.; Cavaliere-Jaricot, S.; Nitschke, R.; Nann, T., Quantum dots versus organic dyes as fluorescent labels. Nat Meth 2008,5 (9), 763-775.
19. Gao, X.; Nie, S., Quantum dot-encoded mesoporous beads with high brightness and uniformity: rapid readout using flow cytometry. Anal Chem 2004,76 (8), 2406-10.
20. Goldman, E. R.; Medintz, I. L.; Mattoussi, H., Luminescent quantum dots in immunoassays. Analytical and Bioanalytical Chemistry 2005,384 (3), 560-563.
21. Jamieson, T.; Bakhshi, R.; Petrova, D.; Pocock, R.; Imani, M.; Seifalian, A. M., Biological applications of quantum dots. Biomaterials 2007,28 (31), 4717-4732. 22. Chung, S. H.; Son, S. J.; Min, J., Nano Barcoding Cell-Based Biosensor Using
Fluorophor-Embedded Silica Nanotubes. Journal of Nanoscience and Nanotechnology 2011,11 (5), 4419-4423.
23. Li, J.; Zhao, X.-W.; Zhao, Y.-J.; Gu, Z.-Z., Quantum-dot-coated encoded silica colloidal crystals beads for multiplex coding. Chemical Communications 2009, (17), 2329.
24. Hu, X.; Gao, X., Silica-polymer dual layer-encapsulated quantum dots with remarkable stability. ACS Nano 2010,4 (10), 6080-6.
25. Sathe, T. R.; Agrawal, A.; Nie, S., Mesoporous silica beads embedded with
semiconductor quantum dots and iron oxide nanocrystals: dual-function microcarriers for optical encoding and magnetic separation. Anal Chem 2006,78 (16), 5627-32.
26. Yang, P.; Ando, M.; Murase, N., Highly luminescent SiO(2) beads with multiple QDs: Preparation conditions and size distributions. J Colloid Interface Sci 2011,354 (2), 455-60. 27. Yang, P.; Zhang, L.; Li, X.; Zhang, Y.; Liu, N.; Zhang, R., Surface modification of SiO2 beads with multiple hydrophobic quantum dots for bioapplications. Journal of Non-Crystalline
Solids 2012,358 (23), 3069-3073.
28. Gao, X.; Nie, S., Doping Mesoporous Materials with Multicolor Quantum Dots. The
Journal of Physical Chemistry B 2003,107 (42), 11575-11578.
29. Han, H.; Hu, D.; Liang, J. G.; Sheng, Z. H., Study on the Interaction between CdSe Quantum Dots and Bovine Serum Albumin with Ultraviolet Visible Absorption Spectroscopy.
Chinese Chemical Letters 2006,17 (7), 961-964.
30. Peng, C.; Li, Z.; Zhu, Y.; Chen, W.; Yuan, Y.; Liu, L.; Li, Q.; Xu, D.; Qiao, R.; Wang, L.; Zhu, S.; Jin, Z.; Xu, C., Simultaneous and sensitive determination of multiplex chemical residues based on multicolor quantum dot probes. Biosens Bioelectron 2009,24 (12), 3657-62. 31. Auzenne, E. A.; Seeney, C. E.; Hamir, A. N.; Klostergaard, J., Anti-Tumor Activity of Drug-Loaded Magnetic Nanoparticles. IEEE Transactions on Magnetics 2013,49 (1), 336-342. 32. Fang, C.; Zhang, M., Multifunctional magnetic nanoparticles for medical imaging applications. Journal of Materials Chemistry 2009,19 (35), 6258-6266.
33. Callaghan, C.; Peralta, D.; Liu, J.; Mandava, S. H.; Maddox, M.; Dash, S.; Tarr, M. A.; Lee, B. R., Combined Treatment of Tyrosine Kinase Inhibitor–Labeled Gold Nanorod
Encapsulated Albumin With Laser Thermal Ablation in a Renal Cell Carcinoma Model. Journal
20
34. Huang, Z.; Wang, H.; Yang, W., Gold Nanoparticle-Based Facile Detection of Human Serum Albumin and Its Application as an INHIBIT Logic Gate. ACS Applied Materials &
Interfaces 2015,7 (17), 8990-8998.
35. Peralta, D. V.; Heidari, Z.; Dash, S.; Tarr, M. A., Hybrid Paclitaxel and Gold Nanorod-Loaded Human Serum Albumin Nanoparticles for Simultaneous Chemotherapeutic and
Photothermal Therapy on 4T1 Breast Cancer Cells. ACS Applied Materials & Interfaces 2015,7 (13), 7101-7111.
36. Lakowicz, J. R., Principles of fluorescence spectroscopy. 3rd ed.; Springer: New York, 2006; p xxvi, 954 p.
37. Skoog, D. A.; Holler, F. J.; Crouch, S. R., Principles of instrumental analysis. 6th ed.; Thomson Brooks/Cole: Belmont, CA, 2007; p xv, 1039 p.
38. Klimov, V. I., Nanocrystal quantum dots. 2nd ed.; CRC Press: Boca Raton, 2010. http://www.crcnetbase.com/ISBN/9781420079265.
39. The many apsects of quantum dots. Nature Nanotechnology 2010,5.
40. Klimov, V., Nanocrystal Quantum Dots: From fundamental photophysics to multicolor lasing. Los Alamos Science 2003, 214-220.
41. Swierczewska, M.; Lee, S.; Chen, X., Inorganic Nanoparticles for Multimodal Molecular Imaging. Molecular imaging 2011,10 (1), 3-16.
42. Derfus, A. M.; Chan, W. C. W.; Bhatia, S. N., Probing the Cytotoxicity of Semiconductor Quantum Dots. Nano Letters 2004,4 (1), 11-18.
43. Zhu, J.-J.; Li, J.-J., Quantum Dots. 2013, 9-24.
44. Smith, A. M.; Ruan, G.; Rhyner, M. N.; Nie, S., Engineering luminescent quantum dots for in vivo molecular and cellular imaging. Ann Biomed Eng 2006,34 (1), 3-14.
45. Dirin, D. N.; Sokolikova, M. S.; Gaskov, A. M.; Vasilev, R. B., Extinction and
luminescence coefficients of CdSe/CdTe, CdTe/CdSe, and CdTe/CdS heterostructures based on colloidal CdSe and CdTe nanocrystals. J. Opt. Technol. 2011,78 (11), 693-698.
46. Allcock, H. R., Introduction to materials chemistry. John Wiley & Sons: Hoboken, N.J., 2008; p xviii, 432 p., 8 p. of plates.
47. Yang, C. C.; Mai, Y. W., Size-dependent absorption properties of CdX (X=S, Se, Te) quantum dots. Chemical Physics Letters 2012,535, 91-93.
48. Reed, M. A.; Randall, J. N.; Aggarwal, R. J.; Matyi, R. J.; Moore, T. M.; Wetsel, A. E., Observation of discrete electronic states in a zero-dimensional semiconductor nanostructure.
Physical Review Letters 1988,60 (6), 535-537.
49. Baker, D. R.; Kamat, P. V., Tuning the Emission of CdSe Quantum Dots by Controlled Trap Enhancement. Langmuir 2010,26 (13), 11272-11276.
50. Murphy, C., Peer Reviewed: Optical Sensing with Quantum Dots. Anal Chem 2002,74 (19), 520A-526A.
51. Mukherjee, S.; Das, U., Quantum Dots: An Optimistic Approach to Novel Theranostics.
International Journal of Pharmaceutical Sciences Review and Research 2011, 59-64.
52. Murray, C. B.; Norris, D. J.; Bawendi, M. G., Synthesis and characterization of nearly monodisperse CdE (E = sulfur, selenium, tellurium) semiconductor nanocrystallites. Journal of
the American Chemical Society 1993,115 (19), 8706-8715.
21
54. Yu, W. W.; Qu, L.; Guo, W.; Peng, X., Experimental Determination of the Extinction Coefficient of CdTe, CdSe, and CdS Nanocrystals. Chemistry of Materials 2003,15 (14), 2854-2860.
55. Peng, Z. A.; Peng, X., Mechanisms of the Shape Evolution of CdSe Nanocrystals.
Journal of the American Chemical Society 2001,123 (7), 1389-1395.
56. Dabbousi, B. O.; Rodriguez-Viejo, J.; Mikulec, F. V.; Heine, J. R.; Mattoussi, H.; Ober, R.; Jensen, K. F.; Bawendi, M. G., (CdSe)ZnS Core−Shell Quantum Dots: Synthesis and Characterization of a Size Series of Highly Luminescent Nanocrystallites. The Journal of
Physical Chemistry B 1997,101 (46), 9463-9475.
57. Ma, Y.; Li, Y.; Ma, S.; Zhong, X., Highly bright water-soluble silica coated quantum dots with excellent stability. Journal of Materials Chemistry B 2014,2 (31), 5043.
58. Gerion, D.; Pinaud, F.; Williams, S. C.; Parak, W. J.; Zanchet, D.; Weiss, S.; Alivisatos, A. P., Synthesis and Properties of Biocompatible Water-Soluble Silica-Coated CdSe/ZnS
Semiconductor Quantum Dots. The Journal of Physical Chemistry B 2001,105 (37), 8861-8871. 59. Chan, W. C., Quantum Dot Bioconjugates for Ultrasensitive Nonisotopic Detection.
Science 1998,281 (5385), 2016-2018.
60. Mattoussi, H.; Mauro, J. M.; Goldman, E. R.; Anderson, G. P.; Sundar, V. C.; Mikulec, F. V.; Bawendi, M. G., Self-Assembly of CdSe−ZnS Quantum Dot Bioconjugates Using an Engineered Recombinant Protein. Journal of the American Chemical Society 2000,122 (49), 12142-12150.
61. Pathak, P.; Katiyar, V., Multi-functional Nanoparticles and Their Role in Cancer Drug Delivery - A Review. Virus 2007,30, 100nm.
62. Pathak, S.; Choi, S. K.; Arnheim, N.; Thompson, M. E., Hydroxylated quantum dots as luminescent probes for in situ hybridization. J Am Chem Soc 2001,123 (17), 4103-4.
63. Wolcott, A.; Gerion, D.; Visconte, M.; Sun, J.; Schwartzberg, A.; Chen, S.; Zhang, J. Z., Silica-coated CdTe quantum dots functionalized with thiols for bioconjugation to IgG proteins. J
Phys Chem B 2006,110 (11), 5779-89.
64. Argyo, C.; Weiss, V.; Bräuchle, C.; Bein, T., Multifunctional Mesoporous Silica Nanoparticles as a Universal Platform for Drug Delivery. Chemistry of Materials 2014,26 (1), 435-451.
65. Vaidya, S. V.; Gilchrist, M. L.; Maldarelli, C.; Couzis, A., Spectral bar coding of polystyrene microbeads using multicolored quantum dots. Anal Chem 2007,79 (22), 8520-30. 66. Kim, S.; Seo, J.; Ramdon, R.; Pyo, H.-B.; Song, K.; Kang, B. H., Solid-Phase
Immunoassay of Polystyrene-Encapsulated Semiconductor Coreshells for Cardiac Marker Detection. Journal of Nanomaterials 2012,2012, 1-9.
67. Cao, Y. C.; Liu, T. C.; Hua, X. F.; Zhu, X. X.; Wang, H. Q.; Huang, Z. L.; Zhao, Y. D.; Liu, M. X.; Luo, Q. M., Quantum dot optical encoded polystyrene beads for DNA detection. J
Biomed Opt 2006,11 (5), 054025.
68. Rossi, L. M.; Shi, L.; Quina, F. H.; Rosenzweig, Z., Stober synthesis of monodispersed luminescent silica nanoparticles for bioanalytical assays. Langmuir 2005,21 (10), 4277-80. 69. Cao, Y.-C.; Huang, Z.-L.; Liu, T.-C.; Wang, H.-Q.; Zhu, X.-X.; Wang, Z.; Zhao, Y.-D.; Liu, M.-X.; Luo, Q.-M., Preparation of silica encapsulated quantum dot encoded beads for multiplex assay and its properties. Analytical Biochemistry 2006,351 (2), 193-200.
70. Rossi, L. M.; Shi, L.; Rosenzweig, N.; Rosenzweig, Z., Fluorescent silica nanospheres for digital counting bioassay of the breast cancer marker HER2/neu [correction of HER2/nue].
22
71. Kumar, R.; Ding, H.; Hu, R.; Yong, K.-T.; Roy, I.; Bergey, E. J.; Prasad, P. N., In vitro and In vivo Optical Imaging Using Water-Dispersible, Noncytotoxic, Luminescent, Silica-Coated Quantum Rods. Chemistry of Materials 2010,22 (7), 2261-2267.
72. Medintz, I. L.; Uyeda, H. T.; Goldman, E. R.; Mattoussi, H., Quantum dot bioconjugates for imaging, labelling and sensing. Nat Mater 2005,4 (6), 435-446.
73. Sapsford, K. E.; Tyner, K. M.; Dair, B. J.; Deschamps, J. R.; Medintz, I. L., Analyzing Nanomaterial Bioconjugates: A Review of Current and Emerging Purification and
Characterization Techniques. Analytical Chemistry 2011,83 (12), 4453-4488.
74. Bruchez Jr, M., Semiconductor Nanocrystals as Fluorescent Biological Labels. Science
1998,281 (5385), 2013-2016.
75. Crivat, G.; Da Silva, S. M.; Reyes, D. R.; Locascio, L. E.; Gaitan, M.; Rosenzweig, N.; Rosenzweig, Z., Quantum dot FRET-based probes in thin films grown in microfluidic channels.
J Am Chem Soc 2010,132 (5), 1460-1.
76. Shi, L.; De Paoli, V.; Rosenzweig, N.; Rosenzweig, Z., Synthesis and application of quantum dots FRET-based protease sensors. J Am Chem Soc 2006,128 (32), 10378-9. 77. Shi, L.; Rosenzweig, N.; Rosenzweig, Z., Luminescent quantum dots fluorescence
resonance energy transfer-based probes for enzymatic activity and enzyme inhibitors. Anal Chem
2007,79 (1), 208-14.
78. Han, M.; Gao, X.; Su, J. Z.; Nie, S., Quantum-dot-tagged microbeads for multiplexed optical coding of biomolecules. Nat Biotechnol 2001,19 (7), 631-5.
79. Beloglazova, N. V.; Speranskaya, E. S.; Wu, A.; Wang, Z.; Sanders, M.; Goftman, V. V.; Zhang, D.; Goryacheva, I. Y.; De Saeger, S., Novel multiplex fluorescent immunoassays based on quantum dot nanolabels for mycotoxins determination. Biosensors and Bioelectronics 2014,
62, 59-65.
80. Goldman, E. R.; Mattoussi, H.; Anderson, G. P.; Medintz, I. L.; Mauro, J. M., Fluoroimmunoassays Using Antibdoy-Conjugated Quantum Dots. In Methods in Molecular
Biology: NanoBiotechnology Protocols, Rosenthal, S. J.; Wright, D. W., Eds. Humana Press Inc:
Totowa, NJ, 2005; Vol. 303.
81. Smith, A. M.; Gao, X.; Nie, S., Quantum dot nanocrystals for in vivo molecular and cellular imaging. Photochem Photobiol 2004,80 (3), 377-85.
82. Michalet, X.; Pinaud, F. F.; Bentolila, L. A.; Tsay, J. M.; Doose, S.; Li, J. J.; Sundaresan, G.; Wu, A. M.; Gambhir, S. S.; Weiss, S., Quantum Dots for Live Cells, in Vivo Imaging, and Diagnostics. Science 2005,307 (5709), 538-544.
83. García-Fernández, J.; Trapiella-Alfonso, L.; Costa-Fernández, J. M.; Pereiro, R.; Sanz-Medel, A., A Quantum Dot-Based Immunoassay for Screening of Tetracyclines in Bovine Muscle. Journal of Agricultural and Food Chemistry 2014,62 (7), 1733-1740.
84. Guo, X.; Peng, J.; Yang, J.; Peng, F.; Yu, H.; Wang, H., Quantum dot-encoded beads for ultrasensitive detection. Recent Pat Nanotechnol 2009,3 (3), 192-202.
85. Fanali, G.; di Masi, A.; Trezza, V.; Marino, M.; Fasano, M.; Ascenzi, P., Human serum albumin: From bench to bedside. Molecular Aspects of Medicine 2012,33 (3), 209-290.
86. Fasano, M.; Curry, S.; Terreno, E.; Galliano, M.; Fanali, G.; Narciso, P.; Notari, S.; Ascenzi, P., The extraordinary ligand binding properties of human serum albumin. IUBMB Life
(International Union of Biochemistry and Molecular Biology: Life) 2005,57 (12), 787-796.
23
88. Langer, K.; Anhorn, M. G.; Steinhauser, I.; Dreis, S.; Celebi, D.; Schrickel, N.; Faust, S.; Vogel, V., Human serum albumin (HSA) nanoparticles: Reproducibility of preparation process and kinetics of enzymatic degradation. International Journal of Pharmaceutics 2008,347 (1–2), 109-117.
89. Lomis, N.; Westfall, S.; Farahdel, L.; Malhotra, M.; Shum-Tim, D.; Prakash, S., Human Serum Albumin Nanoparticles for Use in Cancer Drug Delivery: Process Optimization and In Vitro Characterization. Nanomaterials 2016,6 (6).
90. Liu, L.; Bi, Y.; Zhou, M.; Chen, X.; He, X.; Zhang, Y.; Sun, T.; Ruan, C.; Chen, Q.; Wang, H.; Jiang, C., Biomimetic Human Serum Albumin Nanoparticle for Efficiently Targeting Therapy to Metastatic Breast Cancers. ACS Applied Materials & Interfaces 2017,9 (8), 7424-7435.
91. Kufleitner, J.; Worek, F.; Kreuter, J., Incorporation of obidoxime into human serum albumin nanoparticles: optimisation of preparation parameters for the development of a stable formulation. Journal of Microencapsulation 2010,27 (7), 594-601.
92. Wan, X.; Zheng, X.; Pang, X.; Pang, Z.; Zhao, J.; Zhang, Z.; Jiang, T.; Xu, W.; Zhang, Q.; Jiang, X., Lapatinib-loaded human serum albumin nanoparticles for the prevention and treatment of triple-negative breast cancer metastasis to the brain. Oncotarget 2016,7 (23), 34038-34051.
93. Dreis, S.; Rothweiler, F.; Michaelis, M.; Cinatl Jr, J.; Kreuter, J.; Langer, K., Preparation, characterisation and maintenance of drug efficacy of doxorubicin-loaded human serum albumin (HSA) nanoparticles. International Journal of Pharmaceutics 2007,341 (1–2), 207-214.
94. Langer, K.; Balthasar, S.; Vogel, V.; Dinauer, N.; von Briesen, H.; Schubert, D., Optimization of the preparation process for human serum albumin (HSA) nanoparticles.
International Journal of Pharmaceutics 2003,257 (1–2), 169-180.
95. von Storp, B.; Engel, A.; Boeker, A.; Ploeger, M.; Langer, K., Albumin nanoparticles with predictable size by desolvation procedure. Journal of Microencapsulation 2012,29 (2), 138-146.
96. Wacker, M.; Zensi, A.; Kufleitner, J.; Ruff, A.; Schütz, J.; Stockburger, T.; Marstaller, T.; Vogel, V., A toolbox for the upscaling of ethanolic human serum albumin (HSA)
desolvation. International Journal of Pharmaceutics 2011,414 (1–2), 225-232.
97. Lin, W.; Coombes, A.; Davies, M.; Davis, S.; Illum, L., Preparation of Sub-100 nm Human Serum Albumin Nanospheres Using a pH-Coacervation Method. Journal of Drug
Targeting 1993,1 (3), 237-243.
98. Baler, K.; Martin, O. A.; Carignano, M. A.; Ameer, G. A.; Vila, J. A.; Szleifer, I., Electrostatic Unfolding and Interactions of Albumin Driven by pH Changes: A Molecular Dynamics Study. The Journal of Physical Chemistry B 2014,118 (4), 921-930.
99. Look, J.; Wilhelm, N.; von Briesen, H.; Noske, N.; Günther, C.; Langer, K.; Gorjup, E., Ligand-Modified Human Serum Albumin Nanoparticles for Enhanced Gene Delivery. Molecular
Pharmaceutics 2015,12 (9), 3202-3213.
100. Elzoghby, A. O.; Samy, W. M.; Elgindy, N. A., Albumin-based nanoparticles as potential controlled release drug delivery systems. J Contr Release 2012,157.
101. Bae, S.; Ma, K.; Kim, T. H.; Lee, E. S.; Oh, K. T.; Park, E. S.; Lee, K. C.; Youn, Y. S., Doxorubicin-loaded human serum albumin nanoparticles surface-modified with TNF-related apoptosis-inducing ligand and transferrin for targeting multiple tumor types. Biomaterials 2012,