www.nat-hazards-earth-syst-sci.net/16/2195/2016/ doi:10.5194/nhess-16-2195-2016
© Author(s) 2016. CC Attribution 3.0 License.
Parameter sensitivity and uncertainty analysis for a storm surge
and wave model
Luis A. Bastidas1, James Knighton1,a, and Shaun W. Kline1 1ENERCON Services Inc., Pittsburgh, Pennsylvania, USA anow at: Cornell University, Ithaca, New York, USA
Correspondence to:Luis A. Bastidas ([email protected])
Received: 19 August 2015 – Published in Nat. Hazards Earth Syst. Sci. Discuss.: 29 October 2015 Revised: 5 April 2016 – Accepted: 16 September 2016 – Published: 30 September 2016
Abstract. Development and simulation of synthetic hurri-cane tracks is a common methodology used to estimate hur-ricane hazards in the absence of empirical coastal surge and wave observations. Such methods typically rely on numerical models to translate stochastically generated hurricane wind and pressure forcing into coastal surge and wave estimates. The model output uncertainty associated with selection of ap-propriate model parameters must therefore be addressed. The computational overburden of probabilistic surge hazard esti-mates is exacerbated by the high dimensionality of numerical surge and wave models. We present a model parameter sen-sitivity analysis of the Delft3D model for the simulation of hazards posed by Hurricane Bob (1991) utilizing three the-oretical wind distributions (NWS23, modified Rankine, and Holland). The sensitive model parameters (of 11 total con-sidered) include wind drag, the depth-induced breakingγB, and the bottom roughness. Several parameters show no sen-sitivity (threshold depth, eddy viscosity, wave triad param-eters, and depth-induced breakingαB)and can therefore be excluded to reduce the computational overburden of proba-bilistic surge hazard estimates. The sensitive model parame-ters also demonstrate a large number of interactions between parameters and a nonlinear model response. While model outputs showed sensitivity to several parameters, the abil-ity of these parameters to act as tuning parameters for cal-ibration is somewhat limited as proper model calcal-ibration is strongly reliant on accurate wind and pressure forcing data. A comparison of the model performance with forcings from the different wind models is also presented.
1 Introduction
We present a parameter sensitivity analysis of the Delft3D computer model under extreme storm conditions using Hur-ricane Bob (1993) as the underlying event. The analysis al-lows for an evaluation of the model’s ability to reproduce observed values of water surface elevation and wave height which are relevant for storm surge hazard predictions. In ad-dition, because publicly available wind observations do not provide sufficient information to drive the model, we evalu-ate the influence on the model performance of three widely used formulations to derive wind fields: NWS23, Holland, and Rankine. Finally, an assessment of the impact of the model grid resolution is also presented.
Specifically, this paper aims to (1) demonstrate the impor-tance of model parameter selection in storm surge and wave modeling and (2) reduce the computational demand for pro-ducing surge and wave model parameter-related uncertainty estimates.
In cases where empirical surge evidence is limited we may utilize alternate methods of estimating hurricane hazard. Irish et al. (2009, 2011a, b) and Resio et al. (2009) demon-strate an approach which incorporates historical hurricane tracks and parameters to provide additional insight into hur-ricane surge hazard. They demonstrate that the joint proba-bility method (JPM) of hurricane surge estimation may pro-duce more reliable return period surge estimates than those based solely on empirical observations. Joint probability dis-tributions of hurricane parameters are used to formulate syn-thetic probable hurricanes which are used to force numerical surge models. Research by Resio et al. (2013) and Tonkin et al. (2000) demonstrates that uncertainty with respect to hur-ricane parameterizations has a significant effect on hazard estimates as these methods still rely on empirical observa-tions.
Emanuel (2006), Emanuel et al. (2006a), and Vickery et al. (2000), among others, present methodologies which uti-lize physically based deterministic atmospheric models to simulate stochastically generated hurricane tracks. In this way deterministic models may estimate the feasible hurri-cane strength based on sea surface temperatures (SSTs) and atmospheric forcing at the storm boundaries. These synthetic tracks are generated in such a way that the statistical prop-erties of the historical hurricanes can be confirmed to follow the patterns of historically observed hurricanes for a region. This general methodology has the advantage of not having to rely directly on empirical hurricane observations to produce estimates of potential future hurricanes.
Approaches based on stochastically generated synthetic hurricanes, e.g., Emanuel (2006), Emanuel et al. (2006a), Resio et al. (2009), and Vickery et al. (2000), are a promis-ing path towards estimatpromis-ing hurricane storm surge risk where hurricane landfalls are infrequent and historical records are incomplete. We may use numerical surge and wave mod-els to translate stochastically generated hurricane tracks into coastal hazard estimates. These methods can be modified fur-ther to assess nonstationary risk by incorporating the impacts of changing climate forcing (Emanuel et al., 2008; Grinsted et al., 2013; Lin et al., 2010, 2012) which the JPM intrinsi-cally lacks.
Estimation methods based on stochastic hurricane tracks have the advantage of being able to calculate the hazard posed by infrequent hurricanes which exceed our relatively brief historical records (Emanuel et al., 2006a; Resio et al., 2009; Vickery et al., 2000). As these methods require deter-ministic surge and wave modeling they have the distinct dis-advantage of having to consider uncertainties associated with numerical modeling of surge and waves. Numerical surge and wave models inherently introduce some additional un-certainty as they are imperfect recreations of true storm surge and wave physics. In utilizing these models we must face the problem of model formulation and parameter value selection. We then must translate this uncertainty in the numerical
sim-ulation of hurricane storm surges into additional hurricane hazard uncertainty.
1.2 Surge and wave model parameter sensitivity
Previous studies have demonstrated that hydrodynamic model parameter uncertainty has a significant effect on coastal simulations, e.g., on sediment transport (Briere et al., 2010), on water quality (Li et al., 2013), on nearshore cur-rents and wave growth (Adrani and Kaihatu, 2012), on tidal propagation (Mayo et al., 2014), on tsunami generation and propagation (Knighton and Bastidas, 2015; Sraj et al., 2014), and on storm surge (Ferreira et al., 2014; Holt et al., 2015). Despite these findings, several recent studies on the valida-tion of the Delft3D model have not considered potential ef-fects of uncertainty in model parameter values, e.g., Elias et al. (2000) and Golshani (2011).
Model parameter sensitivity and related uncertainty analy-sis methodologies typically rely on Monte Carlo simulations which follow these generalized steps: (1) a number of sam-ples are drawn from the feasible parameter space to produce unique parameter sets; (2) these parameter sets are then eval-uated with the numerical model to produce a model output; and (3) some form of the variance of the model output is evaluated and potentially related back to the parameter value variations.
The higher the dimensionality (number of parameters) of a model, the greater the number of simulations which are required to determine the effects each parameter has on a particular model output. Coastal surge models are typically highly parameterized formulations for wind-wave and surge modeling. They require extensive determination of appro-priate numerical and physical settings and parameter val-ues. Further, these models typically include many model el-ements (cells or nodes) at which the flow equations must be solved at each time step. These two considerations result in a large computational overburden when employing proba-bilistic sensitivity and model uncertainty estimates which can make the effort somewhat infeasible or impractical in prac-tice.
Figure 1.Delft3D model domain showing Hurricane Bob (1991) track, tidal stations, and wave buoys along the US North Atlantic Coast.
over hundreds of kilometers as well as water quality fate and transport over several meters (Deltares, 2008).
We evaluate the possibility that simulations of storm surge and hurricane-induced waves may not depend equally on all Delft3D input parameters. To achieve this, we perform a model parameter sensitivity analysis of Delft3D storm surge and wave computations and identify the primary parameters of importance through the simulation of Hurricane Bob over a North Atlantic domain (Fig. 1). In this way, parameter-related uncertainty estimates can be developed from a re-stricted parameter set, thereby reducing the overall compu-tational demand for developing model uncertainty estimates. In order to reduce the computational demand of this sen-sitivity analysis, we apply the Morris method (Campolongo et al., 2007; Morris, 1991). The Morris method is an effi-cient algorithm for computing model parameter elementary effects or changes in an output as a result of a change to a single parameter. In addition to estimating the elementary ef-fects of each model parameter, the Morris method can pro-duce an estimate of the parameter interaction with other pa-rameters. In applying the Morris method, we can identify which model parameters have a significant effect on sim-ulated storm surge and wave characteristics and which pa-rameters have dependencies with other papa-rameters or demon-strate significant nonlinearity.
2 Methodology
2.1 North Atlantic storm surge
We select the US North Atlantic coast to evaluate Delft3D model parameter sensitivity because this region is somewhat reliant on numerical simulations for accurate hurricane haz-ard estimates. Historical hurricane tracks show few land-falling hurricanes of significant strength within the region (Dailey et al., 2009; AOML, 2015) and few coastal surge observations at tidal stations (NOAA, 2015b). A qualita-tive review of this empirical evidence may imply that hur-ricane storm surge is not a concern; however, recent research suggests that analysis using only empirical surge and hur-ricane parameter records is, at best, inconclusive. Dailey et al. (2009) evaluate the record of historical hurricane tracks against historical SSTs and show that a purely statistical ap-proach based on hurricane observations results in a wide un-certainty for hurricane hazard forecasts for the US North At-lantic coast.
hurricane minimum central pressure measurements for the North Atlantic are shown to correlate poorly with SST mea-surements. Tonkin et al. (2000) suggest that this finding is most likely due to undersampling the joint distribution of hurricane central pressures and SSTs for the North Atlantic region within the past 60 years.
Lin et al. (2010) estimate hurricane risk to New York City, USA, through a statistical/deterministic hurricane risk assessment methodology described by Emanuel (2006) and Emanuel et al. (2006b). Their research shows significant storm surges for New York with return periods of less than 500 years, which further demonstrates the potential short-comings of relying on empirical surge and hurricane records for hazard estimation. Similarly, Lin et al. (2014) propose that the Atlantic Ocean may presently be experiencing a pe-riod of reduced hurricane activity. They propose that high-energy hurricane landfalls may be more common than that estimated from the extant historical hurricane track and surge records.
The effects of climate change and sea level rise add ad-ditional uncertainty to North Atlantic storm surge estimates. Villarini et al. (2011) evaluate whether anthropogenic forc-ing could increase the frequency of land-fallforc-ing hurricanes within the region. They conclude that projected increases in hurricane frequency are not necessarily supported by statisti-cal projections and note that significant uncertainty between analyses methods exist. Alternately, Lin et al. (2012) utilize stochastic deterministic hurricane surge modeling and esti-mate an increase in hurricane hazard estiesti-mates due to future climate forcing.
As there is great uncertainty surrounding the hurricane hazard estimates for the North Atlantic region, stochastic deterministic hurricane simulations are a promising path towards developing reliable hazard estimates (Lin et al., 2012, 2014). As such, we must acknowledge that numer-ical surge model parameter uncertainties will affect these estimates. To facilitate model parameter uncertainty esti-mates, we present a storm surge model parameter sensitiv-ity analysis for Delft3D. As stated before, this paper aims to (1) demonstrate the importance of model parameter selec-tion in storm surge and wave modeling and (2) reduce the computational demand for producing surge and wave model parameter-related uncertainty estimates.
2.2 Delft3D model description
We simulate two-dimensional, depth-averaged, unsteady flow characterizing hurricane wind and pressure setup with Delft3D-FLOW (Deltares, 2014b). The Navier–Stokes equa-tions for incompressible flow are solved under the shallow water and Boussinesq assumptions. These equations are re-duced to an implicit finite difference approximation through the Crank–Nicolson numerical scheme (Deltares, 2014b). The Delft3D-FLOW model was developed on a spherical grid at a 5 km spatial resolution and simulated at a time step
of 60 s to satisfy the Courant–Freidrichs–Lewy condition of the FLOW solution technique. Though Delft3D-FLOW gives the users control over the solution technique, all simulations were performed with the Cyclic (Stelling and Leenderste, 1992) solution for the momentum equation. We perform all simulations with depth forced boundary condi-tions for open boundaries to reproduce tidal propagation, with 12 tidal forces components.
We simulate surface wind waves with Delft3D-WAVE, a derivative of the Simulating WAves Nearshore (SWAN) model (Deltares, 2014a). SWAN is a spectral wave model that evaluates the refracted wave height and wave angle based on linear wave theory (Booij et al., 1999; Deltares, 2014a). The SWAN model accounts for (refractive) propagation due to current and depth and represents the processes of wave generation by wind, dissipation due to white-capping, bottom friction, depth-induced wave breaking, and nonlinear wave– wave interactions (both quadruplets and triads) (Booij et al., 1999; Deltares, 2014a). The SWAN model is based on the discrete spectral action balance equation and is fully spectral (across all directions and frequencies) (Dietrich et al., 2012). We use the same spatial grid for Delft3D-WAVE computa-tions as was applied to the Delft3D-FLOW model. The spec-tral wave energy is computed at a 15 min time step using the nonstationary computational model.
We couple the Delft3D-FLOW and Delft3D-WAVE mod-els for hurricane surge simulation at a 30 min time step. The wave forces computed in Delft3D-WAVE enhance the energy dissipation at the bed boundary layer in the storm surge model and generate a net mass flux affecting the cur-rent. These effects are accounted for by passing the radiation stress gradient determined from the computed wave parame-ters from Delft3D-WAVE to the Delft3D-FLOW model. The water levels and currents computed by the Delft3D-FLOW model are then passed back to the Delft3D-WAVE model for more accurate wave estimates (Deltares, 2014a).
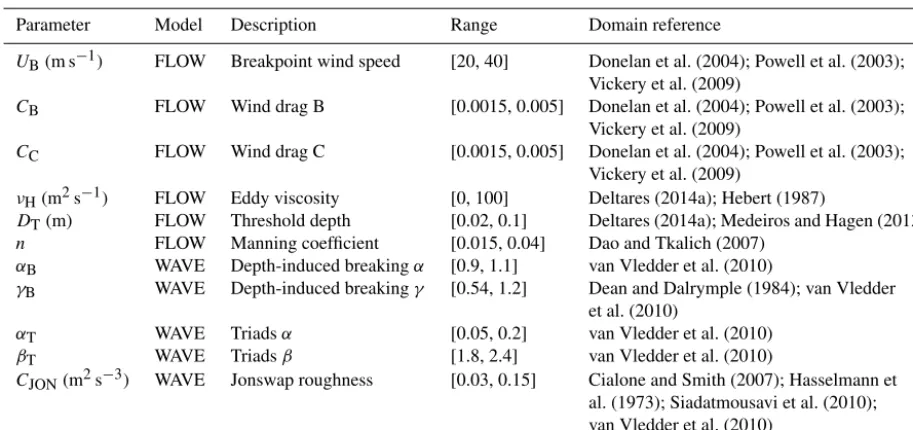
Delft3D-FLOW and Delft3D-WAVE allow for consider-able control of the hydrodynamic processes. Each model is highly parameterized. This allows the user to vary physical settings (e.g., wind drag coefficients, water density, gravita-tional constant, horizontal eddy viscosity, bottom roughness) as well as numerical settings (e.g., numerical solution tech-nique, numerical convergence criteria, wetting drying thresh-olds). We evaluate the sensitivity of hurricane surge simula-tions to model parameters which have been considered to be classic calibration parameters as well as parameters which previous studies have demonstrated exert a significant effect on model uncertainty (Table 1). Each parameter is described in detail in the following sections.
2.2.1 Wind drag
col-Table 1.Feasible parameter space for Delft3D model.
Parameter Model Description Range Domain reference
UB(m s−1) FLOW Breakpoint wind speed [20, 40] Donelan et al. (2004); Powell et al. (2003); Vickery et al. (2009)
CB FLOW Wind drag B [0.0015, 0.005] Donelan et al. (2004); Powell et al. (2003); Vickery et al. (2009)
CC FLOW Wind drag C [0.0015, 0.005] Donelan et al. (2004); Powell et al. (2003); Vickery et al. (2009)
νH(m2s−1) FLOW Eddy viscosity [0, 100] Deltares (2014a); Hebert (1987)
DT(m) FLOW Threshold depth [0.02, 0.1] Deltares (2014a); Medeiros and Hagen (2013)
n FLOW Manning coefficient [0.015, 0.04] Dao and Tkalich (2007)
αB WAVE Depth-induced breakingα [0.9, 1.1] van Vledder et al. (2010)
γB WAVE Depth-induced breakingγ [0.54, 1.2] Dean and Dalrymple (1984); van Vledder et al. (2010)
αT WAVE Triadsα [0.05, 0.2] van Vledder et al. (2010)
βT WAVE Triadsβ [1.8, 2.4] van Vledder et al. (2010)
CJON(m2s−3) WAVE Jonswap roughness [0.03, 0.15] Cialone and Smith (2007); Hasselmann et al. (1973); Siadatmousavi et al. (2010); van Vledder et al. (2010)
umn (Deltares, 2014b). Wind drag may result in a wind set up (where wind setup is a component of the total surge) along coastal areas. Additionally, the wind stress applied over a fetch results in the growth of surface waves which are simu-lated through the spectral Delft-WAVE (SWAN) model. Sur-face waves shoal as they propagate into shallow coastal areas and can pose a flood hazard due to wave run-up and overtop-ping.
Andreas et al. (2012), Donelan et al. (2004), Makin (2005), Powell et al. (2003), and Vickery et al. (2009) present wind drag formulations as a function of surface wind speed. These studies suggest that wind drag increases linearly up to some wind speed termed the breakpoint velocity. Be-yond this breakpoint wind speed, the drag coefficient reaches some limiting value or decreases slightly. Further research has demonstrated additional complexity suggesting the wind drag coefficient is also a function of the sea state (Andreas et al., 2012; Reichl et al., 2014) global location and temperature (Kara et al., 2007) and has some dependence on the bottom friction formulation (Johnson and Kofoed-Hansen, 2000; Zi-jlema et al., 2012). The considerable research that has been applied to estimating the proper wind drag coefficients to re-produce historical hurricanes demonstrates that there is some general agreement on the significance of this model input for accurate surge simulations (Bacopoulos et al., 2012; Cheung et al., 2007; Huang et al., 2013; Vatvani et al., 2012; Zachry et al., 2013).
Hereinafter, we consider the wind drag formulation to be a three-point function of the wind velocity, as described in Deltares (2014b). This results in a three-parameter model where we must determine the breakpoint wind speed(UB), the breakpoint wind drag coefficient(CB), and the terminal
wind drag coefficient(CC). The wind speed for the terminal wind drag(CC)is fixed at 100 m s−1.
2.2.2 Horizontal eddy viscosity
The horizontal eddy viscosity is a concept that primarily at-tempts to reproduce small-scale horizontal turbulent eddies and shear losses which cannot be simulated with a hydro-dynamic model by utilizing a large computational grid size (Deltares, 2014b). These additional hydraulic losses are ac-counted for within Delft3D simulations through modifica-tion of a horizontal eddy viscosity term(νH). The larger the model grid, the more the smaller losses are neglected. The horizontal eddy viscosity term is considered a calibration pa-rameter for Delft3D-FLOW, which is commonly a function of the model grid size (Deltares, 2014b). As we have selected a model grid resolution of 5 km, the horizontal eddy viscos-ity should be a significant consideration and is included in the sensitivity analysis.
2.2.3 FLOW bottom friction
of long-wavelength wave propagation (Dao and Tkalich, 2007; Knighton and Bastidas, 2015; Sraj et al., 2014).
2.2.4 Threshold depth
The threshold depth parameter (DT)is a numerical setting for Delft3D-FLOW which controls the wetting and drying of model cells. The threshold depth term specifically describes the depth below which a model cell will be considered dry and therefore excluded from the simulation. Medeiros and Hagen (2013) review different wetting and drying algo-rithms for hydrodynamic simulations including Delft3D. The threshold depth approach to cell wetting can result in artifi-cial resistance to water propagation across cells and therefore may affect the model results in coastal areas. Selection of a threshold depth which is too small may result in numerical is-sues within a simulation. Horstman et al. (2013) demonstrate that the threshold depth within Delft3D-FLOW is a consid-eration for the simulation of tidal propagation.
2.2.5 WAVE bottom friction
We simulate wave energy dissipation by the ocean bed with the JoNSWAP (Hasselmann et al., 1973; Siadatmousavi et al., 2010) bottom friction formulation with a spatially ho-mogenous friction coefficient(CJON).
Several studies have identified the JoNSWAP parameter value as a significant consideration for the simulation of wave propagation within shallow water (Cialone and Smith, 2007; Johnson and Kofoed-Hansen, 2000; Mortlock et al., 2014; Padilla-Hernández and Monbaliu, 2001; Zijlema et al., 2012). The JoNSWAP bottom friction formulation has been historically considered to vary between two values represent-ing swell conditions (0.038 m2s−3)and local wind-driven wave growth (0.067 m2s−3)(Hasselmann et al., 1973). Re-cently, van Vledder et al. (2010) suggested that the potential range of feasible bottom friction values may be more con-strained than previously assumed. They demonstrate that the coefficient previously used to represent swell conditions may also more accurately reproduce bed dissipation for locally generated wind waves.
2.2.6 Depth-induced breaking
The depth-induced breaking model of Battjes and Janssen (1978) is used within Delft3D-WAVE spectral model to sim-ulate the dissipation of waves within shallow water due to wave breaking (Booij et al., 1999). The depth-induced break-ing along with the wave bed friction model determines the point of wave breaking and wave energy dissipation. The pa-rameterization of this model requires estimates of the depth-induced breaking alpha (αB)and gamma (γB) parameters. The αBparameter controls the rate of dissipation, whereas the γBparameter controls the ratio of wave height to water depth at which wave breaking occurs.
It is acknowledged that more detailed depth-induced breaking models have been proposed which may represent an improvement over the current Delft3D-WAVE formula-tion. Filipot and Cheung (2012), Smit et al. (2013), and van der Westhuysen (2010) demonstrate potential limitations of the application of the SWAN model to coral reefs related to the reproduction of energy dissipation.
2.2.7 Nonlinear triad interactions
Wave triads simulate nonlinear wave–wave interactions. Wave–wave interactions occur when resonant wave frequen-cies exchange energy. This exchange transfers energy across the wave spectrum. The proportionality coefficient, αT, is a tunable parameter to modify the wave–wave interactions. The maximum frequency considered for wave–wave interac-tions is controlled by theβTparameter.
Nonlinear triad (three-wave) interactions have been shown to have a significant effect within shallow water (Beji and Battjes, 1993). Delft3D-WAVE incorporates nonlinear triad interactions through the lumped triad approximation (Elde-berky and Battjes, 1996). Akpınar et al. (2012) demonstrate that the parameterization of the triad model as an important consideration for simulation of waves over the Black Sea. 2.3 Hurricane Bob simulation
In this paper, Hurricane Bob (1991) is used as the primary model forcing data to estimate model parameter sensitivity. We chose Hurricane Bob for the following reasons:
1. The use of a historical hurricane allows us to compare model results with observed surges and waves. In this way we can determine not only the sensitivity of model outputs to parameter values but also which parameters enable Delft3D to accurately reproduce observations (i.e., serve as useful calibration parameters).
2. Hurricane Bob was a recent hurricane. The best-track data for this storm system are available at a higher tem-poral resolution than other historical category 2 land-falling hurricanes for the region (NOAA, 2015a). 3. Hurricane Bob is one of six hurricanes since 1950 to
maintain a category 2 strength within 400 km of Boston, MA, USA (NOAA, 2015a). Hurricane Bob then quickly lost strength dropping to a tropical storm near Port-land, Maine, USA (Fig. 1). This range of wind speeds within the study area allows a better exploration of the wind drag model parameterization of Delft3D (see Sect. 2.2.1).
Gloria (1985) had a similar strength and direction; however, Gloria made landfall in Connecticut, USA (NOAA, 2015a).
5. Cheung et al. (2007) show that an idealized Rankine wind field model of Hurricane Bob provides a reason-able representation of the storm. Their idealized wind model accurately reproduces observed wind velocity and pressure at land stations as well as coastal surge and wave characteristics based on the HURDAT (NOAA, 2015a) best-track observations.
Best-track data for Hurricane Bob were obtained from HUR-DAT (NOAA, 2015a). As noted in previous studies (Ling and Chavas, 2012; Resio et al., 2013; Taflanidis et al., 2011; Zhong et al., 2010), the recreation of hurricane wind and pressure fields from hurricane parameterizations can have a significant impact on model simulation results. Wind and pressure fields were developed for hurricane Bob using the NWS 23 (NOAA, 1979), the modified Rankine wind field as described in Cheung et al. (2007), and the Holland wind field (Holland, 1980).
The NWS23 vortex model (NOAA, 1979) is an analytical formulation for reproduction of spatially distributed hurri-cane wind and pressure fields. The Holland vortex model is a modification to the analytical vortex model (Holland, 1980). The HollandBparameter, determined by the maximum wind speed and Coriolis forces, is used to modify the shape of the wind and pressure profiles of the hurricane (Holland, 1980, 2008). The modified Rankine model (Depperman, 1947) is based on a Rankine vortex which assumes solid body rota-tion within the radius of maximum winds (RMW) and a de-caying wind speed inversely proportional to distance beyond the RMW. The modified Rankine model contains a tuning parameter,X, which we choose as 0.5 based on recommen-dations in Cheung et al. (2007) for Hurricane Bob. An ad-justment for asymmetry of the wind field is applied to each model based on methods described by Jelesnianski (1966). 2.4 Observed surge and wave height
Hourly storm surge records from Atlantic City, Bar Harbor, Point Judith, Sandy Hook, and Woods Hole tidal stations (NOAA, 2015b) were used to evaluate the Delft3D-FLOW ability to reproduce coastal water surface elevations by vary-ing model parameter values.
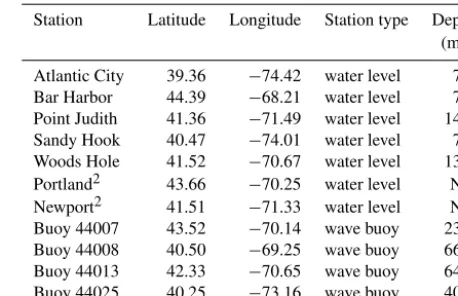
Hourly measurements from buoys 44007, 44008, 44013, and 44025 (NOAA, 2015c) were used to evaluate Delft3D-WAVE reproduction of significant wave heights. As noted in Table 2, the buoys available contain no measurements in true shallow water. In order to explore the depth dependence of wave parameter sensitives, we evaluate the model parameter sensitivity at the tidal gage stations. Though no measure can be given for reproduction of observed wave characteristics at these locations, we evaluate the effect of model parameter values on peak significant wave heights. Table 2 presents the
Table 2.Hurricane surge and wave observation locations.
Station Latitude Longitude Station type Depth (m)1
Atlantic City 39.36 −74.42 water level 7.1 Bar Harbor 44.39 −68.21 water level 7.0 Point Judith 41.36 −71.49 water level 14.4 Sandy Hook 40.47 −74.01 water level 7.2 Woods Hole 41.52 −70.67 water level 13.4 Portland2 43.66 −70.25 water level NA Newport2 41.51 −71.33 water level NA Buoy 44007 43.52 −70.14 wave buoy 23.7 Buoy 44008 40.50 −69.25 wave buoy 66.4 Buoy 44013 42.33 −70.65 wave buoy 64.5 Buoy 44025 40.25 −73.16 wave buoy 40.8
1Water depths for tidal stations were determined from NOAA (2015b); water depths for wave buoys were determined from NOAA (2015c).2Stations used for high-resolution model performance evaluation. Not used for the sensitivity analysis study.
stations selected for model parameter sensitivity evaluation within this study.
2.5 Parameter sensitivity analysis
The Morris method (Campolongo et al., 2007; Morris, 1991) is a sensitivity analysis method that is particularly well suited to a model with significant computational overburden, as is the case here. The method does not need simplifying as-sumptions about the input/output behavior (Campolongo et al., 2000). The design is an efficient algorithm composed of individual randomized one-at-a-time designs, in which the impact of changing the value of each of the chosen param-eters is evaluated in turn. A number of trajectories is initial-ized at a random position within the parameter space hyper-cube. Each move along the trajectory represents a change to one randomly selected parameter value. An estimate of the elementary effect of each model parameter is computed for each trajectory. Although different sampling schemes can be used, we follow the original Morris design (Morris, 1991). Overall, we used 50 trajectories, each one comprising 12 pa-rameter sets, as we analyze 11 papa-rameters, for a total of 600 simulations for each of the three wind models considered.
The output functions evaluated for the sensitivity analysis are chosen to allow for an evaluation of the hurricane haz-ard estimates which are commonly concerned with the peak flood elevation. For that reason we evaluate the sensitivity of peak wave height and peak surge elevation at each buoy and tidal station respectively. We also evaluate the parameter sensitivity for the entire simulation period by means of the root mean square error (RMSE) and the mean absolute error (MAE) with respect to the observed data. The RMSE rep-resents an overall model error which emphasizes periods of large magnitude values (e.g., peak surge and wave heights). The MAE does not ascribe more weight to high values of model error as the RMSE.
3 Results and discussion
3.1 Comparison of NWS23, Holland, and Rankine wind field forcing data
We first present a comparison of the Delft3D storm surge and wave wind model forcing data. Though not a Delft3D model parameter, but rather an input forcing, selection of the wind field representation of a historical storm is a significant choice faced by modelers. Errors and uncertainty in the pri-mary forcing data have a significant effect on model outputs. As shown in Fig. 2, the NWS23 (NOAA, 1979), Holland (Holland, 1980), and Rankine (Cheung et al., 2007) wind field models based on the hurricane best-track parameteriza-tion result in different wind forcing model inputs. The Rank-ine wind field model provides a more consistent match to wind speed observations as demonstrated by the RMSE at buoys 44013, 44008, 44007, and 44025. The Rankine model minimizes the error introduced by the forcing wind field at three of these specific locations.
The predicted wind directions are consistently similar for all three models. They are deemed an adequate representa-tion of wind direcrepresenta-tion, which implies the best-track hurricane data are generally accurate. The peak winds at buoy 44025 arrive several hours earlier than the observed peak for all the models. It is assumed that this discrepancy may be re-lated to an inaccurate position along the hurricane track from the best-track data. These incorrect forcing data impose some limitation on the model’s ability to reproduce observed val-ues at this location.
3.2 Delft3D-FLOW parameter sensitivity
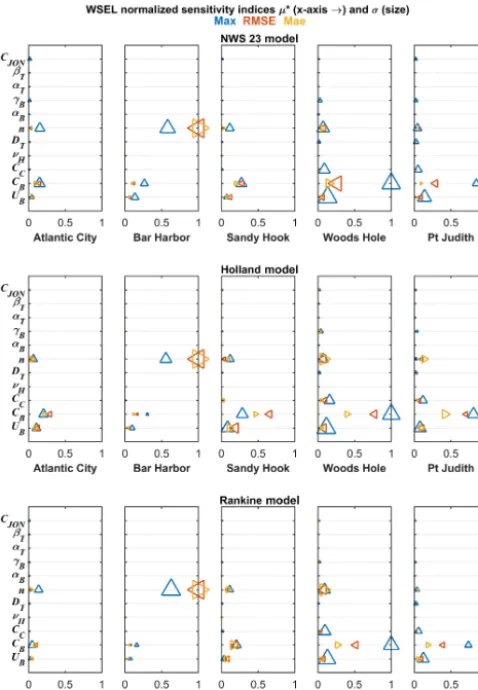
Delft3D-predicted water surface elevations and significant wave heights show sensitivity with respect to the wind drag terms(UB, CB, CC)and the bottom friction(n)(Figs. 3, 4). The bottom friction parameter has a significant influence only at the Bar Harbor station as this location is subject to large tidal oscillations. Stations with smaller tidal oscilla-tions (< 1 m) show lesser effect of the bottom friction on peak surge elevation, RMSE, or MAE. Bottom friction
formula-Figure 2.Wind fields versus observations at coastal buoys. Blue is NWS23, red is Holland, yellow is Rankine, and black dots are observed; 18 August 1991 12:00–20 August 1991 12:00 GMT.
tion of Manning’snalso had a significant effect on the wave height at Buoys 44007 and 44025. This effect is likely due to the wave buoys being located in shallower water than the other buoys and therefore more influenced by the bed friction (Table 2).
The wind drag parameters reveal significant sensitivity at Sandy Hook, Woods Hole, and Point Judith for peak surge elevation. The importance of the wind drag terms scales with proximity of the hurricane track to the tidal gage sta-tion and resulting surge elevasta-tion (Fig. 1). These same loca-tions showed some sensitivity of the wind drag parameters to RMSE and MAE, but the sensitivity was somewhat reduced. These results suggest that the ability to properly calibrate these model parameters is more reliant on the quality of the wind forcing data applied as opposed to appropriate model parameter selection. The lack of sensitivity of the wind drag demonstrated at Atlantic City and Bar Harbor is ascribed to the Hurricane Bob causing only a minor surge at these loca-tions.
Figure 3.Campolongo sensitivity indices for water surface eleva-tions at tidal gage locaeleva-tions for different wind models and error function: blue upward pointed triangle is Maxdiff; red left pointed triangle is RMSE; yellow right pointed triangle is MAE. Triangle size proportional toσ parameter.
The threshold depth parameter (DT) and the horizontal eddy viscosity parameter(νH)have no discernable effect on the model output. We suggest that these parameters may be safely neglected in future hurricane hazard uncertainty stud-ies, thereby reducing the computational demand. It should be noted that theDT parameter has numerical implications (Deltares, 2014b) and should still be carefully selected to avoid improper calculation of water surface elevations in ar-eas with strong tidal oscillations. Within the present study any value within the numerically allowable range produced similar quality results.
3.3 Delft3D-WAVE parameter sensitivity results The Delft3D-WAVE model parameterization is primarily re-lated to shallow water processes where wave energy is dis-sipated due to wave–bed interactions. As such we see a spa-tially distributed set of model parameter sensitivities. At each NOAA wave buoy the simulated waves are primarily deep
Figure 4.Campolongo sensitivity indices for wave height at buoy locations for different wind models and error function: blue upward pointed triangle is Maxdiff; red left pointed triangle is RMSE; yel-low right pointed triangle is MAE. Triangle size proportional toσ
index.
Figure 5.Campolongo sensitivity indices for wave height at buoy locations for different wind models: blue upward pointed triangle is NWS23; red right pointed triangle is Holland; yellow left pointed triangle is Rankine. Triangle size proportional toσ index.
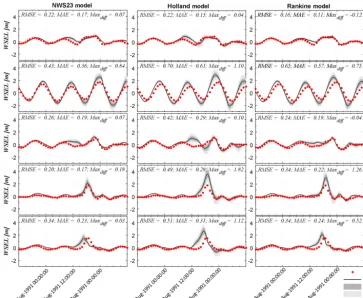
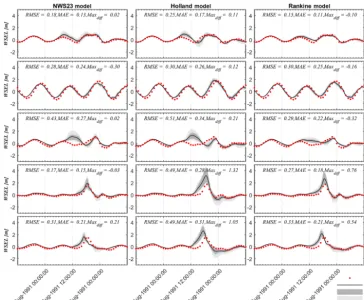
infor-Figure 6.Water surface elevation simulation results at tidal locations for different wind models for the 5 km resolution model. Error measures in meters.
mation for hurricane wave modeling. Along the coast at the tidal stations the predicted waves experience wave–bed in-teractions and therefore show greater sensitivity to the model parameters.
The wave parametersCJONandγBhad some minor effect on the peak surge elevation (Fig. 3). It has been previously shown that the wave setup can have some effect on storm surge predictions (Weaver and Slinn, 2004); however, these results demonstrate that the parameterization of the wave model does not play a significant role in predicting the peak surge elevation. The primary consideration here is that the wave model was coupled with the surge model to impart the appropriate wave stresses.
Delft3D-WAVE model predictions at NOAA buoys within deep water show significant sensitivity with respect to the CJON parameter, Manning’s roughness, and the wind drag parameters (Fig. 4). Here we observe an almost identical pa-rameter sensitivity with respect to wind-wave simulations. The depth-induced breakingγBparameter showed some mi-nor sensitivity. The WAVE model predicted that peak wave height is almost exclusively a function of theCJON parame-ter and the wind drag parameparame-ters. The additional parameparame-ters affecting model output only show up when evaluating the en-tire time series with RMSE and MAE. Within shallow water at the tidal stations, the predicted wave heights are primarily sensitive to theCJONandγBparameters (Fig. 5).
Wave parameters showing sensitivity do not show an inter-action among the wave parameters (Figs. 3, 4 and 5). These feasible space of these parameters can be treated as marginal parameter spaces independent of other model parameters.
TheβT, αT, andαBwave parameters had no significant ef-fect on the simulated wave height. Selection of any parameter values within the allowable range for these parameters pro-duced similar results. We therefore suggest that these param-eters may be neglected for model calibration and uncertainty analysis.
3.4 Delft3D-FLOW simulation uncertainty for 5 km resolution model
As stated in Sect. 2.5, in order to assess the model sensi-tivity, we ran Delft3D with 600 different parameter sets for each of the three wind models, i.e., a total of 1800 runs. The 600 samples provide a thorough coverage of the feasible pa-rameter space, specified in Table 1, and can be used to assess the overall model performance and the associated parameter-related uncertainty.
On Fig. 6 we present the entire set of 600 water surface ele-vations (ensemble) obtained from the simulations with 5 km resolution for each wind model at five tidal gage locations. The mean, the 50 and 95 % quantiles of the corresponding distribution are highlighted. They are picked to show the re-sponse from south to north over the domain following the track of Hurricane Bob. The ensemble results for wave height at the buoy locations are presented on Fig. 7. The error
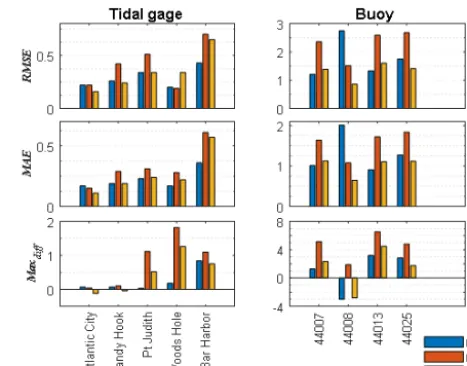
statis-Figure 8.Error performance measures, in meters, for mean of simu-lations with 5 km resolution. Water surface elevations at tidal gages (left panel) and wave heights at buoys (right panel).
tics for the mean at all the locations are also presented in Table 3 and on Fig. 8.
The results highlight that the model has a somewhat high level of precision, i.e., the bounds of the simulations are quite tight. The accuracy of the simulations, i.e., the bracketing of the observations, has some problems. For all the three wind models, at Bar Harbor the tidal amplitude during the simula-tion period is larger than the observed with an overestimasimula-tion of the peak water surface elevation. There are also some tim-ing errors on the peak value, particularly at the Point Judith location. Interestingly, the model shows some surge not ob-served in the data at the Sandy Hook location. It appears that the NWS23 yields a superior performance simulation at the Woods Hole location. The Holland model overestimates the peak value almost by a factor of 2.
Based on the error measures computed (Fig. 8, Table 3) the overall performance of the model with the NWS23 wind model seems to yield simulations that more closely resemble the observations at the Bar Harbor location by a significant margin. This is mostly related to the timings. The accuracy of the Rankine model outperforms the other two, except at Bar Harbor. This is most likely related to the best fitting of the wind fields using the Rankine model (Fig. 2).
The wave height simulations show a better performance for the Rankine model, with the Holland significantly over-predicting at buoys 44007 and 44013. Overall, it appears that for the chosen event and locations the Holland model shows the less accurate performance.
3.5 Delft3D-FLOW simulation uncertainty for multiple resolution model
Table 3.Error performance measures for mean of 5 km resolution simulations.
Tidal gage Water surface elevation
NWS23 Holland Rankine
RMSE (m) MAE (m) Maxdiff(m) RMSE (m) MAE (m) Maxdiff(m) RMSE (m) MAE (m) Maxdiff(m)
Atlantic City 0.22 0.17 0.07 0.22 0.15 0.04 0.16 0.11 −0.12 Sandy Hook 0.26 0.19 0.07 0.42 0.29 0.10 0.24 0.19 −0.04 Point Judith 0.34 0.23 0.03 0.51 0.31 1.12 0.34 0.24 0.52 Woods Hole 0.20 0.17 0.18 0.19 0.28 1.82 0.34 0.22 1.26 Bar Harbor 0.43 0.36 0.84 0.70 0.61 1.10 0.65 0.57 0.75
Buoy Wave height
44007 1.21 1.01 1.28 2.36 1.64 5.14 1.39 1.13 2.33 44008 2.75 2.01 −3.01 1.51 1.08 1.89 0.86 0.65 −2.81 44013 1.33 0.91 3.20 2.59 1.72 6.54 1.60 1.11 4.49 44025 1.75 1.27 2.84 2.68 1.84 4.80 1.41 1.12 1.76
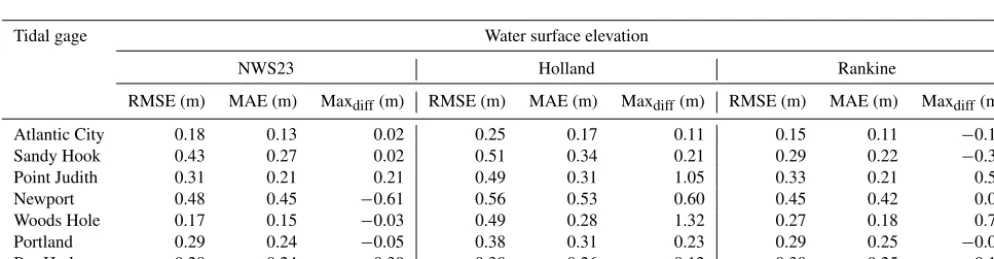
Table 4.Error performance measures for mean of multiple resolution simulations.
Tidal gage Water surface elevation
NWS23 Holland Rankine
RMSE (m) MAE (m) Maxdiff(m) RMSE (m) MAE (m) Maxdiff(m) RMSE (m) MAE (m) Maxdiff(m)
Atlantic City 0.18 0.13 0.02 0.25 0.17 0.11 0.15 0.11 −0.10 Sandy Hook 0.43 0.27 0.02 0.51 0.34 0.21 0.29 0.22 −0.32 Point Judith 0.31 0.21 0.21 0.49 0.31 1.05 0.33 0.21 0.54 Newport 0.48 0.45 −0.61 0.56 0.53 0.60 0.45 0.42 0.03 Woods Hole 0.17 0.15 −0.03 0.49 0.28 1.32 0.27 0.18 0.76 Portland 0.29 0.24 −0.05 0.38 0.31 0.23 0.29 0.25 −0.06 Bar Harbor 0.28 0.24 −0.30 0.30 0.26 0.12 0.30 0.25 −0.16
the model performance. This model was only run with the FLOW component and with a subset of five trajectories (35 parameter sets for FLOW) established following Cam-polongo et al. (2007). Two additional locations were consid-ered for the evaluation: Newport, Rhode Island, and Portland, Maine. The results of this ensemble of simulations are shown on Fig. 9 and the error statistics on Table 4 and Fig. 10.
The only location with a significant improvement, over the coarse resolution, in model performance is Bar Harbor. The RMSE and MAE are reduced by almost a factor of 2. At this location, a significant increase in the precision of the simu-lations is also observed. This may be related to significant changes in the bathymetry. At the other locations, somewhat unexpectedly, there is actually a deterioration in the preci-sion of the model. Improvements in the accuracy are also location dependent. For example, a deterioration in accuracy is observed at Sandy Hook. The improvement at the other locations, in terms of the errors, is marginal.
As for the coarse-resolution model, the Holland wind field shows the least accurate performance. It seems that the Hol-land model used here needs some tuning to improve the model responses.
4 Summary and Conclusions
In the present study we have used a sensitivity analysis methodology that is particularly suited for models with large computational overburden to determine the model parameter sensitivities for the case of hurricane-induced storm surges. An evaluation of the overall model performance, using a large ensemble, has been conducted which allowed for the determination of the overall model precision and accuracy. The results from the sensitivity analysis will allow for the re-duction in the required number of simulations to calibrate the models.
Selection of the appropriate theoretical wind field model is a significant consideration for surge and wave modeling. The model parameters demonstrate similar sensitivity with differ-ent wind and pressure field forcing data; however, the ability of Delft3D parameters to function as calibration parameters for successful reproduction of storm surge and wave char-acteristics is largely dependent on proper wind and pressure forcing.
Figure 9.Water surface elevation simulations results at tidal locations for different wind models with multiple resolutions. Error measures in meters.
Figure 10.Error performance measures for water surface elevation, in meters, for mean of multiple resolution simulations.
CJON. The Delft3D-WAVE model can be reformulated to a five-parameter model for hurricane wave hazard simulation. The primary parameters of interest are UB, CB, n, γB, and CJON.
The threshold depth parameter(DT), horizontal eddy vis-cosity parameter (νH), nonlinear triad interaction parame-ters(αT, βT), and depth-induced breaking alpha parameter (αB)had no significant effect on the hurricane surge or wave hazard model output. The dimensionality, and therefore the computational overburden, of Delft3D storm surge and wave simulations can be reduced considerably. This is particularly important for probabilistic hazard estimates which require a significant number of simulations.
The sensitive model parameters showed significant nonlin-earity in the model response and interactions among model parameters. Calibration of a Delft3D storm surge model should therefore consider the dependency of model param-eters on each other. A traditional “one-at-a-time” calibration methodology may oversimplify the task of model calibration and could arrive at incorrect parameter value combinations.
Overall, Delft3D shows an ability to reproduce the water surface observations with reasonable precision and accuracy at most of the locations considered. However, the perfor-mance in terms of the wave height is of a lesser accuracy, with the precision significantly decreasing at the tail of the simulated event. As expected, the simulations are dependent on the wind fields driving the model.
wind models, the Holland model produced an overall less ac-curate and less precise set of simulations. This suggests that some fine tuning of the wind field model parameters should be required in order to improve the quality of the simulations associated with a specific wind model.
We are currently working on the use of optimization algo-rithms for Delft3D calibration and identification of parameter value distributions, making use of the results presented here.
5 Data availability
All the data are available from the NOAA websites: NOAA Re-Analysis Project, Hurricane Research Division, NOAA Tide and Currents website, and National Buoy Data Center (NOAA, 2015a, b, c). The location identification of the data used is listed in the paper. See Table 4 for a listing of all the data locations used.
Acknowledgements. The authors would like to thank Justin Pistininzi for continuing support and two anonymous reviewers whose thoughtful comments helped improve this paper.
Edited by: N. Pinardi
Reviewed by: two anonymous referees
References
Adrani, S. and Kaihatu, J.: Uncertainty analysis and parameter esti-mation for nearshore hydrodynamic models, in AGU Fall Meet-ing, p. OS21B-1753, San Francisco, CA, 3–7 December 2012. Akpınar, A., van Vledder, G. P., Kömürcü, M. ˙I., and Özger, M.:
Evaluation of the numerical wave model (SWAN) for wave sim-ulation in the Black Sea, Cont. Shelf Res., 50, 80–99, 2012. Andreas, E. L., Mahrt, L., and Vickers, D.: A new drag relation for
aerodynamically rough flow over the ocean, J. Atmos. Sci., 69, 2520–2537, 2012.
AOML: Atlanic Oceanographic and Meteorological Laboratory: Hurricane Data, available at: http://www.aoml.noaa.gov/hrd/ data_sub/hurr.html, last access: May 2015.
Bacopoulos, P., Hagen, S. C., Cox, A. T., Dally, W. R., and Bratos, S.: Observation and simulation of winds and hydrodynamics in St. Johns and Nassau Rivers, Paper 177, US Army Research, 2012.
Battjes, J. A. and Janssen, J. P. F. M.: Energy loss and set-up due to braking of random waves, paper presented at 16th International Conference on Coastal Engineering, American Society of Civil Engineers, New York, 27 August–3 September 1978.
Beji, S. and Battjes, J. A.: Experimental investigations of wave propagation over a bar, Coast. Eng., 19, 151–162, 1993. Booij, N., Holthuijsen, L. H., and Ris, R.: A third-generation wve
model for coastal regions, Part I, Model description and valida-tion, J. Geophys. Res., 104, 7649–7666, 1999.
Briere, C., Giardingo, A., and van der Werf, J.: Morphological mod-eling of bar dynamics wiht Delft3d: The quest for optimal free
parameter settings using an automatic calibration technique, Pro-ceedings of the 32nd Conference on Coastal Engineering, Shang-hai, China, edited by: McKee, J. and Lynett, P., ISBN-13: 978-0-9896611-0-2, 30 June–5 July 2010.
Campolongo, F., Keijnen, J., and Andres, T.: Screening methods, in: Sensitivity Analysis, edited by: Saltelli, A., Chan, K., Scott, F. M., John Wiley & Sons, Ltd., New York, ISBN-13: 978-0-470-74382-9, 2000.
Campolongo, F., Cariboni, J., and Saltelli, A.: An effective screen-ing design for sensitivity analysis of large models, Environ. Mod-ell. Softw., 22, 1509–1518, 2007.
Cheung, K. F., Tang, L., Donnelly, J. P., Scileppi, E. M., Liu, K. B., Mao, K. B., Houston, S. H., and Murnane, R. J.: Numerical modeling and field evidence of coastal overwash in southern New England from Hurricane Bob and impli-caitons for paleotempestology, J. Geophys. Res., 112, F03024, doi:10.1029/2006JF000612, 2007.
Cialone, M. A. and Smith, J. M.: Wave transformation model-ing with bottom friction applied to southeast Oahu, in 10th In-ternational Workshop on Wave Hindcasting and Forecasting & Coastal Hazard Assessment, US Army Engineer Research & De-velopment Center, 11–16 November 2007.
Dailey, P. S., Zuba, G., Ljung, G., Dima, I. M., and Guin, J.: On the relationship between north Atlantic sea surface temperatures and U.S. hurricane landfall risk, J. Appl. Meteorol. Clim., 48, 111–129, 2009.
Dao, M. H. and Tkalich, P.: Tsunami propagation modelling – a sensitivity study, Nat. Hazards Earth Syst. Sci., 7, 741–754, doi:10.5194/nhess-7-741-2007, 2007.
Dean, R. G. and Dalrymple, R. A.: Water wave mechanics for en-gineers and scientist, Prentice Hall, New York, NY, ISBN-10: 9810204213, 1984.
Deltares: Validation Document Delft3D-FLOW, Delft, the Netherlands, available at: https:// oss.deltares.nl/c/document_library/get_file?uuid=
39169f8f-4ab0-4f7b-9771-c3f7d0ddd61f&groupId=183920 (last access: April 2015), 2008.
Deltares: Delft-3D-WAVE, Simulation of short-crested waves with SWAN, User Manual Version 3.05, Revision 34160, 206 pp., Deltares, 2600 MH Delft, the Netherlands, 2014a.
Deltares: Delft3D-Flow Simulation of multi-dimensional hydrody-namic flows and transport phenomena, including sediments, User Manual, Version: 3.15, Revision 36209, 686 pp., Deltares, Delft, the Netherlands, 2014b.
Depperman, C. E.: Notes on the origin and structure of Philippine typhoons, B. Am. Meteorol. Soc., 28, 399–404, 1947.
Dietrich, J. C., Zijlema, M., Allier, P. E., Holthuijsen, L. H., Booij, N., Meixner, J. D., Proft, J. K., Dawson, C. J. Bender, C. N., Naimaster, A., Smith, J. M., and Westernink, J. J.: Limiters for spectral propagation velocities in SWAN, Ocean Model., 70, 85– 102, 2012.
Donelan, M. A., Haus, B. K., Reul, N., Plant, W. J., Graber, H. C., Brown, O. B., and Saltzman, E. S.: On the limiting aerodynamic roughness of the ocean in very strong winds, Geophys. Res. Lett., 31, L18306, doi:10.1029/2004GL019460, 2004.
landfalls in southern New England, Geol. Soc. Am. Bull., 113, 714–727, 2001.
Donnelly, J. P., Butler, J., Roll, J., Wengren, S., and Webb, T.: A backbarrier overwash record of intense storms from Brigantine, New Jersey, Mar. Geol., 210, 107–121, 2004.
Eldeberky, Y. and Battjes, J. A.: Spectral modeling of wave break-ing: application to Boussinesq equations, J. Geophys. Res., 101, 1253–1264, 1996.
Elias, E. P. L., Walstra, D. J. R., Roelvink, J. A., Stive, M. J. F., and Klein, M. D.: Hydrodynamic validation of Delft3D with field measurements at Egmond, in: Coastal Engineering Con-ference, edited by: ASCE, 2714–2727, Sydney, Australia, 16– 21 July 2000.
Emanuel, K.: Climate and tropical cyclone activity: A new model downscaling approach, J. Climate, 19, 4797–4802, 2006. Emanuel, K., Ravela, S., Vivant, E., and Risi, C.: A
statistical-deterministic approach to hurricane risk assessment, B. Am. Me-teorol. Soc., 19, 299–314, 2006a.
Emanuel, K. A., Ravela, S., Vivant, E., and Risi, C.: A statistical de-terministic approach to hurricane risk assessment, B. Am. Math. Soc., 87, 299–314, 2006b.
Emanuel, K., Sundararajan, R., and Williams, J.: Hurricanes and global warming. Results from downscaling IPCC AR4 simula-tions, B. Am. Meteorol. Soc., 89, 347–367, 2008.
Ferreira, C. M., Irish, J. L., and Olivera, F.: Uncertainty in hurricane surge simulation due to land cover specification, J. Geophys. Res.-Oceans, 119, 1812–1827, doi:10.1002/2013JC009604, 2014.
Filipot, J. F. and Cheung, K. F.: Spectral wave modeling in fringing reef environments, Coast. Eng., 67, 67–79, 2012.
GEBCO: General Bathymetric Chart of the Oceans, available at: http://www.gebco.net/data_and_products/gridded_bathymetry_ data/, last access: June 2015.
Golshani, A.: A hydrodynamic study of the south of Persian Gulf using Delft3D-Flow, International Journal of Maritime Technol-ogy, 7, 67–74, 2011.
Grinsted, A., Moore, J. C., and Jevrejeva, S.: Protected Atlantic hur-ricane surge threat from rising temperatures, P. Natl. Acad. Sci., 110, 5369–5373, 2013.
Hasselmann, K., Barnett, T. P., Bouws, E., Carlson, H., Cartwright, D. E., Enke, K., and Walden, H.: Measurements of wind-wave growth and swell decay during the Joint North Sea Wave Project (JONSWAP), Deutches Hydrographisches Institut, Ham-burg, 95 pp., Ergänzungsheft zur Deutschen Hydrographischen Zeitschrift Reihe A (8◦), Nr. 12, 1973.
Hebert, D.: An estimate of the effective horizontal eddy viscosity in the Gulf Stream due to internal waves, J. Phys. Oceanogr., 17, 1837–1841, 1987.
Holland, D. A.: A revised hurricane pressure-wind model, Mon. Weather Rev., 136, 3432–3445, 2008.
Holland, G. J.: An analytic model of the wind and pressure profiles in hurricanes, Mon. Weather Rev., 108, 1212–1218, 1980. Holt, T., Altaf, U., Mandli, K., Hadwiger, M., Dawson, C. N., and
Hoteit, I.: Visualizing uncertainties in a storm surge ensemble data assimilation and forecasting system, Nat. Hazards, 77, 317– 336, doi:10.1007/s11069-015-1596-y, 2015.
Horstman, E. M., Dohmen-Janssen, C. M., and Hulscher, S. J. M. H.: Modeling tidal dynamics in a mangrove creek catchment
in Delft3D, Coastal Dynamics Arcachon, France, 833–844, 24– 28 June 2013.
Huang, Y., Weisberg, R., Zheng, L., and Zijlema, M.: Gulf of Mex-ico hurricane wave simulations using SWAN: Bulk formula-based drag coefficient sensitivity for Hurricane Ike, J. Geophys. Res.-Oceans, 118, 3916–3938, doi:10.1002/jgrc.20283, 2013. Irish, J. L., Resio, D. T., and Cialone, M. A.: A surge response
func-tion approach to coastal hazard assessment. Part 2: Quantificafunc-tion of spatial attributes of response functions, Nat. Hazards, 51, 183– 505, 2009.
Irish, J. L., Resio, D. T., and Divoky D.: Statistical properties of hur-ricane surge along a coast, J. Geophys. Res.-Oceans, 116, 1978– 2012, 2011a.
Irish, J. L., Song, Y. K., and Chang, K. A.: Probabilistic hurricane surge forecasting using parameterized surge response functions, Geophys. Res. Lett., 38, L03606, doi:10.1029/2010GL046347, 2011b.
Jelesnianski, C. P.: Numerical computations of storm surges without bottom stress, Mon. Weather Rev., 94, 379–394, 1996.
Johnson, H. K. and Kofoed-Hansen, H.: Influence of bottom friction on sea surface roughness and its impact on shallow water wind wave modeling, J. Phys. Oceanogr., 30, 1743–1756, 2000. Kara, A. B., Metzger, E. J., and Bourassa, M. A.: Ocean
current and wave effects on wind stress drag coefficient over the global ocean, Geophys. Res. Lett., 34, L01604, doi:10.1029/2006GL027849, 2007.
Knighton, J. and Bastidas, L.A.: A proposed probabilistic seismic tsunami hazard analysis methodology, Nat. Hazards, 78, 699– 723, doi:10.1007/s11069-015-1741-7, 2015.
Li, Z., Chen, Q., Xu, Q., and Blanckaert, K.: Generalized likelihood uncertainty estimation method in uncertainty analysis of numer-ical eturophication models: Take BLOOM as an example, Math. Probl. Eng., 2013, 701923, doi:10.1155/2013/701923, 2013. Lin, N., Emanuel, K., Smith, J. A., and Vanmarcke, E.: Risk
assess-ment of hurricane storm surge for New York City, J. Geophys. Res., 115, D18121, doi:10.1029/2009JD013630, 2010.
Lin, N., Emanuel, K., Oppenheimer, M., and Vanmarcke, E.: Phys-ically based assessment of hurricane surge threat under climate change, Nature Climate Change, 2, 462–467, 2012.
Lin, N., Lane, P., Emanuel, K., Sullivan, R. M., and Donnelly, J.: Heightened hurricane surge risk in northwest Florida re-vealed from climatological-hydrodynamic modeling and pale-orecord reconstruction, J. Geophys. Res.-Atmos., 119, 8606– 8623, doi:10.1002/2014JD021584, 2014.
Ling, N. and Chavas, D. R.: On hurricane parametric wind and applicaitons in storm surge modeling, J. Geophys. Res., 117, D09120, doi:10.1029/2011JD017126, 2012.
Makin, V. K.: A note on the drag of the sea surface at hurricane winds, Bound.-Lay. Meteorol., 115, 169–176, 2005.
Mayo, T., Butler, T., Dawson, C. N., and Hoteit, I.: Data assim-ilation within the Advanced Circulation (ADCIRC) Modeling Framework for the estimation of Manning’s friction coefficient, Ocean Model., 76, 43–58, doi:10.1016/j.ocemod.2014.01.001, 2014.
Medeiros, S. C. and Hagen, S. C.: Review of wetting and drying algorithms for numerical tidal flow models, Int. J. Numer. Meth. Fl., 71, 473–487, 2013.
Mortlock, T. R., Goodwin, I. D., and Turner, I. L.: Nearshore SWAN model sensitivities to measured and modelled offshore wave scenarios at an embayed beach compartment, NSW, Aus-tralia, Australian Journal of Civil Engineering, 12, 67–82, doi:10.7158/C14-016.2014.12.1, 2014.
NOAA: Meteorological criteria for standard project hurricane and probable maximum hurricane windfields, Gulf and East Coasts of the United States, NOAA Technical Report NWS 23, National Weather Service, 1979.
NOAA: Analysis Project, edited by: AOML, Hurricane Re-search Division, available at: http://www.aoml.noaa.gov/hrd/ hurdat/Data_Storm.html, last access: July 2015a.
NOAA: NOAA Tides and Currents Website, Center for Opera-tional Oceanographic Products and Services, available at: https: //tidesandcurrents.noaa.gov/, last access: July 2015b.
NOAA: National Buoy Data Center, available at: http://www.ndbc. noaa.gov/, last access: July 2015c.
Padilla-Hernández, R. and Monbaliu, J.: Energy balance of wind waves as a function of the bottom friction formulation, Coast. Eng., 43, 131–148, 2001.
Powell, M. D., Vickery, P. J., and Reinhold, T. A.: Reduced drag co-efficient for high wind speeds in tropical cyclones, Nature, 422, 279–283, 2003.
Reichl, B. G., Hara, T., and Ginis, I.: Sea state dependence of the wind stress over the ocean under hurricane winds, Oceans, 119, 30–51, doi:10.1002/2013JC009289, 2014.
Resio, D. T., Irish, J., and Cialone, M. A.: A surge response function approach to coastal hazard assessment. Part 1: Basic concepts, Nat. Hazards, 51, 163–182, 2009.
Resio, D. T., Irish, J., Westerink, J., and Powell, N.: The effect of uncertainty on estimations of hurricane surge hazards, Nat. Haz-ards, 66, 1443–1459, doi:10.1007/s11069-012-0315-1, 2013. Siadatmousavi, S. M., Jose, F., and Stone, G. W.: The effects of bed
friction on wave simulation: implementation of an unstructured third-generation wave model, SWAN, J. Coastal Res., 27, 140– 152, doi:10.2112/JCOASTRES-D-10-00073.1, 2010.
Smit, P., Zijlema, M., and Stelling, G.: Depth-induced wave break-ing in a non-hydrostatic, near-shore wave model, Coast. Eng., 76, 1–16, doi:10.1016/j.coastaleng.2013.01.008, 2013.
Sraj, I., Mandli, K., Knio, O., Dawson, C. N., and Hoteit, I.: Un-certainty quantification and inference of Manning’s friction co-efficients using DART buoy during the Tohoku tsunami, Ocean Model., 83, 82–97, doi:10.1016/j.ocemod.2014.09.001, 2014. Stelling, G. and Leendertse, J.: Approximation of Convective
Pro-cesses by Cyclic AOI methods, in: Estuarine and coastal model-ing, Proceedings 2nd Conference on Estuarine and Coastal Mod-elling, edited by: Spaulding, M. L., Bedford, K., Blumberg, R., and Cheng, C., Swanson Tampa Florida, 13–15 November 1991, American Society of Civil Engineers, New York, ISBN-13: 978-0-87262-861-8, ISBN-10: 0-87262-861-2, Soft Cover, 798 pp., 1992.
Taflanidis, A. A., Kennedy, A. B, Westerink, J. J, Hope, M., Tanaka, S., Smith, J., and Cheung, K. F.: Probabilistic hurricane surge risk estimation through high-fidelity numerical simulation and response surface approximations, in: Proceedings of the Interna-tional Conference on Vulnerability and Risk Analysis and Man-agement/Fifth International Symposium on Uncertainty Model-ing and Analysis, 11–13 April, Hyattsville, Maryland, 2011. Tonkin, H., Holland, G. J., Holbrook, N., and Henderson-Sellers,
A.: An evaluation of thermodynamic estimates of climatologi-cal maximum potential tropiclimatologi-cal cyclone intensity, Mon. Weather Rev., 128, 746–762, 2000.
van der Westhuysen, A. J.: Modeling of depth-induced wave break-ing under finite depth wave growth conditions, J. Geophys. Res.-Oceans, 115, C01008, doi:10.1029/2009JC005433, 2010. van Vledder, G., Zijlema, M., and Holthuijsen, L.: Revisiting
the JONSWAP Bottom Friction Formulation, in: Proceedings of 32nd Conference on Coastal Engineering, Shanghai, edited by: McKee Smith, J. and Lynett, P., China, ISBN-13: 978-0-9896611-0-2, doi:10.9753/icce.v32.waves.41, 2010.
Vatvani, D., Zweers, N. C., van Ormondt, M., Smale, A. J., de Vries, H., and Makin, V. K.: Storm surge and wave simulations in the Gulf of Mexico using a consistent drag relation for atmospheric and storm surge models, Nat. Hazards Earth Syst. Sci., 12, 2399– 2410, doi:10.5194/nhess-12-2399-2012, 2012.
Vickery, P. J., Skerjl, P. F., and Twisdale, L. A.: Simulation of hurri-cane risk in the U.S. using empirical track model, J. Struct. Eng.-ASCE, 126, 1222–1237, 2000.
Vickery, P. J., Masters, F. J., Powell, M. D., and Wadhera, D.: Hur-ricane hazard modeling: The past, present, and future, J. Wind Eng. Ind. Aerod., 97, 392–405, doi:10.1016/j.jweia.2009.05.005, 2009.
Villarini, G., Vecchi, G. A., Knutson, T. R., Zhao, M., and Smith, J. A.: North Atlantic tropical storm frequency response to an-thropogenic forcing: Projections and sorces of uncertainty, J. Cli-mate, 24, 3224–3238, 2011.
Walton, T. L. J.: Distributions for storm surge extremes, Ocean Eng., 27, 1279–1293, 2000.
Weaver, R. J. and Slinn, D. N.: Effect of Wave Forcing on Storm Surge, Proceedings of the 29th International Conference on Coastal Engineering, Lisbon, Portugal, 19–24 September 2004. Zachry, B. C., Schroeder, J. L., Kennedy, A. B., Westerink, J. J.,
Letchford, C. W., and Hope, M. E.: A case study of nearshore drag coefficient behavior during Hurricane Ike, J. Appl. Meteo-rol. Clim., 52, 2139–2146, 2013.
Zhong, L., Li, M., and Zhang, D.L.: How do uncertainties in hur-ricane model forecasts affect storm surge predictions in a semi-enclosed bay?, Estuar., Coast. Shelf S., 90, 61–72, 2010. Zijlema, M., van Vledder, G. P., and Holthuijsen, L. H.: Bottom