The Importance Of Metrics For The Evaluation Of
Design Performance For An Axiomatic Design
System Development
Andrea Girgenti, Alessandro Giorgetti, Fernando Rolli, Gabriele Arcidiacono, Alessio Sgrevi, Paolo Citti
Abstract: This paper explains the role of metrics and their important contribution in assessing how far a system is with respect to a target. This is even more important to establish a common language and to drive an organization towards goals being sure at the same time each part of the organization itself is aligned. Measuring performances through a shared and accepted metric is even more critical as a tool to achieve the continuous improvement of traded solutions, design parameters, and processes. It allows one to quantify how much a system is currently providing in terms of outputs and to plan the next steps to achieve the expected performances if a misalignment is detected. Metrics, compared with targets, make the appraiser able to measure advances and next actions to deploy. This paper proposes a system of metrics to drive the choice of design parameters of both physical and non-physical systems (human organizations for instance) through the decomposition. In this context the quality function deployment links back the design parameters to customer needs through the found system of metrics and provides a tool for assessing the goodness of found solutions.
Index Terms— Axiomatic Design, customer satisfaction, design, product customization, metrics, performance measurement, product development.
—————————— ——————————
1 INTRODUCTION
Providing solutions able to meet customers’ expectations and
create value is the core mission of the modern industry where the trend is to push more and more towards a higher service level and customization [1]-[5]. This aspect is even more important in mature markets where competition is high, and the main driver tends to be the price of goods sold. From this point of view, understanding potential unexplored markets through the creation and satisfaction of new needs is a key factor in achieving success. Many authors have proposed several methods [6] and philosophies to develop new markets minimizing entrepreneurial risk [7].As demonstrated by many authors in a wide range of applications [8]-[14], the methodology called Axiomatic Design (AD) provides a highly-structured decision-making process for the design phase of a
successful product/process. In this scenario, the
entrepreneurial bet is shaped by the understanding of customer needs (CNs) and the right choice of functions (FRs) the traded good or service shall provide. The CNs collection might not be easy since some are not explicit and often a proactive approach is required to better explore the potential success of a new concept/idea [7]. Of course, the closest is the perceived value of the proposed product to customer expectations, the highest is the probability to have a product or a serviceable to achieve commercial success. A similar successful product or service is called market winner, being opposite to an order qualifier product or service, i.e. one with minimum contents just to be taken into account by customers [15].From a wider point of view, the success of a company does not depend only on having the right product/service to win the market, but it depends on the whole business model and adopted a strategy to adhere to its market placement and loyalty to customer promises.This concept is even more important if one considers the perceived value not only like features implemented in what is sold but a full package made by the whole customer experience, being scaled through the
whole supply chain. The definition of what parameters deal with the value created by the whole offered package is very important and could be significant to maximize sales and profits. On the other hand, neglecting one of these parameters that are important for customers might be detrimental for the whole business.The whole business model, including the supply chain and operations, are deeply affected by this concept and need to adhere to the top-level strategy to be coherent to what are customer expectations [16], [17].For product development, the translation of FRs into design parameters (DPs) represents another critical point in the product (or service) development process since the designer is virtually free to achieve the FR with several different solutions depending on his knowledge, experience, available technology, and budget. A turbine, a petrol engine, or a steam engine are just three-way, or design parameters at a macroscopic level, to satisfy the function ―To produce torque‖ for instance. Of course, implemented FRs can meet customer expectations in very different manners, thus it is the most important key to determine if a product will be an order qualifier rather than a market winner, once launched on the market. Many authors dealt with this mechanism [18]–[21]. Among these, Kano [22] split design features (intended as FRs) into three categories: ―must be‖ (expected by the customer), ―more is better‖ (more attractive if more present), and ―delighter‖ (not expected and surprising). The presence (or absence) of one particular kind of these kinds of features can make a product (or service) successful or not, since it is directly tied to perceived value by customers. The presence (or absence) of features affects the perceived value of traded goods or services and finally the customer satisfaction. Must be featured are those that make customers very unsatisfied if not present because the market expects them.
Delighter features are those who make customers very satisfied if present. Typically, they may be difficult to spot, but, if discovered and implemented, they will make the perceived value higher from the customer's standpoint. The order winner products or services are those whose perceived value is the highest due to the higher content of delighter features.More is better features are those whose presence linearly affects customers' perception of the value of the traded product or service.At the same time, different design parameters can ————————————————
Andrea Girgenti, Alessio Sgrevi, Lincoln Electric Italia S.r.l., Genova, Italy
Alessandro Giorgetti, Fernando Rolli, Gabriele Arcidiacono,
4794 achieve the same FR differently, providing more or less
perceived value.Notwithstanding its importance, understanding the right and most innovative set of FRs is not enough to win competitors and the market since the designed solutions might not be able to meet expected performance or not be able to perform enough.A business needs to define what adds value from the customers' perspective in order to be run successfully. Once this has been spotted, scales to measure performance are needed, and goals need to be set. A key characteristic of any metrics is that they have to be shared, understood and accepted by all individuals that are interested in measuring the achievement level of a function or the efficacy of a deployed solution. As a common measuring scale, metrics are a tool to communicate and share ideas among functions within an organization or through the whole supply chain (several organizations). This paper deals with the need to set of metrics that are parameters that define measures of performance at all levels, being scaled down from the highest strategy until the most straightforward and most operative operation.
2
MATERIALS
AND
METHOD
2.1 Metrics as a way to measure performance within a customer-oriented system
Metrics are meant to measure the design performance with respect to the FR to be achieved because they provide a scale to quantify the distance from a fixed target.In this context, the object of design is not just a found technical solution but rather any engineered system in its most extensive meaning that considers, for example, accounting human organizations, services, business models, material management, social systems till the above mentioned technical design.In the same manner, internal or external customers can be all the stakeholders that have interests in a certain operation o towards which a function of the considered system is addressed.On the other hand, the tolerance definition is as important as the definition of the right metric itself; it represents the reference to measure the fulfillment rate of that function able to optimize the customer needs. Maximum and minimum values, between a metric can range, also define the acceptable level of attended performance, being at the same time a thermometer of customer satisfaction.The need to measure results brought by human activity is implicit in the business management from the highest level to the lowest one. This is the reason why in each function, office, or
operation, metrics are defined, monitored and assessed. FRs and DPs can be scaled with a top-down logic and in the same way, metrics can be scaled top-down from the strategy level to the middle management one in a private company for instance.For example, If we consider a mechanical device, a high-level metric could be the number of its sales. A high-level DP is a technical solution to accomplish a function (high-level FR) that solves a need (CNs). Like FRs and DPs can be further split, being translated in more specific and technical parameters, metrics can be split accordingly to define how a single function is fulfilled.From this point of view, we can define a metrics tree where the highest top-level indicator (Top MTR) is decomposed in more simple ones, according to Figure 2. An FR, both at the highest and lower levels, is satisfied by a DP at the same level. Both can be split into lower FRs and DPs that are tied each other [23]. Metrics at the same level of decomposition (MTRs) mean how much a specific DP fulfills the corresponding FR with respect to a given target. The fulfillment of expectations according to a set measuring scale can be assessed and quantified for each couple FR/DP in an uncoupled design or for a whole group of DPs that depend on an FR in a coupled design.The efficacy of a particular DP in fulfilling its corresponding FR can be defined as a function of the information content of the DP itself (or of the whole design from a wider standpoint). The higher is the efficacy of the provided solution, the lower is its information content, until being able to spot the best design as the one that has the lowest information content [20]. Than, metrics make it possible to interpret the information content of a system as the difference between the current value and the target, providing a tool to assess how much the deployed design can fulfill FRs punctually. In other words, each metric, being a measurable parameter monitored (through time for instance) and compared with specs, accounts for the information content that is tied to a specific couple of FR/DP(s). In Figure 1 each i-th MTR assesses how much the i-th DP fulfills the corresponding i-th FR.Like FRs and DPs, metrics [24] can also be scaled through time and space. In fact, an approach to spot the most successful set of FRs for the proposed good or service takes into account the whole customer experience, including all the interactions between the stakeholders and the product/service itself through these two domains [25], [26]. Stakeholders in this context represent a wider group than just the final customer because they also include who design, assemble, sell, mount, dismantle the product/service. At the same time, the metrics definition varies as customer needs and FRs vary.
During the life of the product or its use by the customer, some different needs might take place, corresponding to different FRs, DPs and hence metrics. As an example, the design of an actuator to be mounted on a pipeline in the desert shall satisfy a lot of FRs depending on its life stage during its assemblage in the workshop, commissioning on the oilfield, its service lives and finally, dismantling. The same for a car, a fridge or every traded good or service. At the same time metrics will refer to the FR achievement in several moments of the product /service life. As metrics can be scaled on time, they can also be aggregated or disaggregated through space to measure how a design requirement is fulfilled. A damper can provide different damping factors as a function of its stroke or the outer part of a crankcase, in an air-cooled engine, expels heat while the inner part holds the combustion.Metrics can also be scaled in transactional processes and through organizations, since it is pretty common strategies are deployed to lower levels using specific KPIs that are tied but different from those defined at a higher level.
2.2 A practical method to define metrics
How to define metrics? How to make them adherent to what customers want?
In this section, the authors will provide answers to these questions from customer-oriented organizations that put the service to customers and the spotting of their needs as a top priority [27], [28]. The focus on the creation or optimization of perceived value by customers is a mean priority for these organizations. As already stated in previous sections, this is functional to generate order winners goods or services to increase profits and assure the long term stability of the company on the market [29].Since metrics define what is worthwhile to be monitored and assessed, the most reasonable goal for a customer-oriented organization is to link metrics with what its customers need or, in other words, what provides them value.This is the reason why the proactive search and understanding of customer needs are crucial for similar companies, often having dedicated functions like customer relationship management [15], [30], [31].The quality function deployment (QFD) is a well-known method to collect customer needs and to translate them into functional requirements, technical parameters that basically are metrics to optimize for achieving the maximum customers' satisfaction and finally DPs.Customer needs, in the Business-to-Consumer (BTC) environment, are often stated in non-technical terms; hence the translation in technical parameters is firstly required. This translation deals with the spotting of the technical KPIs that recall at best what customers expressed and that mostly is tied with it. In Business-to-Business environments or when customers are internal (the top management of a company, investors, or expert technicians of the dealt field) some CNS can be expressed directly through technical parameters.The QFD can be a structured and well-defined way to define correlations among one domain and the following. On the other hand, one of the main parts of the QFD is the correlation matrix, where correlations among inputs and outputs are
usually accounted giving a three-level numerical score depending on the strength of the correlation itself.This matrix, being a part of the QFD, is very similar to the design matrix, and this latter can be derived from the first one through a criterion like taking into account only strong correlations or only the strong and the medium ones for instance.As a second step, the shift from the FRs domain to the DPs one might be sometimes based on the experience of the designer [14], or it can be managed through the same QFD/design matrix. The identification of the best set of DPs can be achieved carrying out first the design matrix among FRs and MTRs. In fact, the MTRs can be used to drive the design that needs to maximize or minimize the specific metric or KPI focusing on what is technically important for the customer. The technical KPI that is found through this second design matrix is a noun; often a measurable physical parameter in engineering systems (mechanics, electronics, etc.), financial indicators (the operative margin, the ROI etc. for investors), process parameters (Overall Equipment Effectiveness, Cp, Cpk [32], etc.) and many others depending on the specific field of application.
3
CASE
STUDY
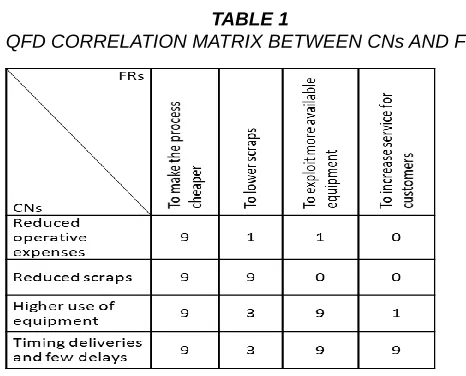
Let us consider an example dealing with a manufacturing process and the translation of CNs in FRs, without claiming to be exhaustive. In the dealt example the customer is internal since CNs may represent needs from investors, managers or other people able to decide and act directly on the manufacturing process within the company.The FRs can be derived through a QFD (omitted in this text), marking strong, average or weak correlations respectively with 9, 3 and 1. The design matrix can summarize these scores, just marking correlations through an "X" where they satisfy a particular criterion. Table 1 shows the QFD correlation matrix, highlighting the strength of correlations; 9 means strong, 3 means average, 1 means weak and 0 means none.The design matrix can be derived from the QFD, one marking just strong and medium correlations. Where weak or absent correlations are present none is reported.
TABLE 1
4796 TABLE 2
DESIGN MATRIX BETWEEN CNs AND FRs DOMAINS
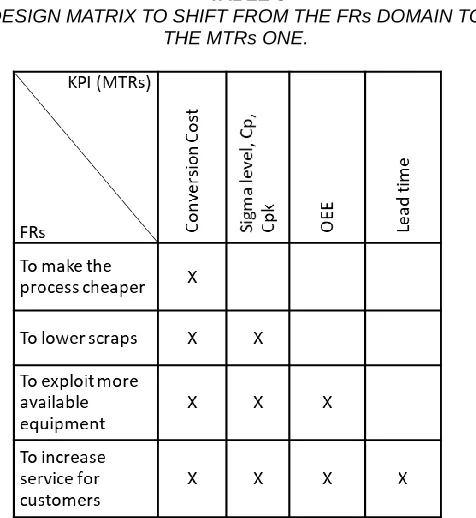
At this second step, the translation from FRs to the MTRs domain is required to spot the measuring scale to assess the goodness of DPs. The goodness of a found DP is the minor amount of information content, i.e. the minor distance between the current value of the metric and its target. In the dealt example the design matrix to switch from the FRs domain to the MTRs one is shown in Table 3:
TABLE 3
DESIGN MATRIX TO SHIFT FROM THE FRs DOMAIN TO THE MTRs ONE.
While FRs can be expressed in a quite general manner, especially at higher levels of decomposition, metrics are very focused on specific aspects and are very technical. This makes the designer aware of what parameters he needs to take into account to develop the design (DP).One can hence consider the intermediate MTRs tree between the FRs one and the DPs one to help the designer to spot DPs. In other terms, during the setting of design solutions (i.e., the design parameters), the designer needs to answer to how to optimize values for spotted metrics, keeping into account eventual constraints, often economical, technological or derived by the product position on the market.At the same time, the MTRs tree can be used in the opposite way providing a list of parameters to measure how much a given design satisfies a set of FRs and to estimate their distance from targets, accounting for the information content. Table 3 could be hence rearranged in the following way to account for this twofold relationship with FRs and DPs, previously shown in Fig.1.Table 4 introduces those parameters that according to designer knowledge and experience affect found MTRs. Their actual impact on FRs will be measured in a second phase through the same MTRs tree.In the deal example shown through Table 4, desired functions are translated in design parameters that have an impact on the found KPIs. The conversion cost is the metrics to take into account in order to make the process cheaper. Since conversion cost is the sum of both the labor and the overhead costs, three possible high-level parameters to work on are wages, utilities, and product design that may require a more complex manufacturing process due to needed machining.The capability of a process to perform within assigned specs is accounted through two metrics: the Cp and Cpk. They account respectively, for process variation in respect with specs and its shift from the target. Two high-level DPs that may affect these metrics are the implementation of procedures and standard work for manual operations and the use of automation. In this way, both the FRs and DPs trees can be decomposed further in more detailed functions and design parameters. These can be inspired and measured through more detailed metrics accordingly.When the design is wholly defined till its lower-level details and the system is implemented, its performance can be appraised comparing the achieved value of each metric with its target and the corresponding tolerance according what seen in paragraph 2.1.
4797 IJSTR©2020
DESIGN MATRIX TO SHIFT FROM THE FRs DOMAIN TO THE DPs ONE.
4 CONCLUSION
This paper reviews the twofold role of metrics as a key driver to set design parameters and an appraisal scale to assess the fulfillment of desired functions.Both these two roles are critical in order to win the competition in modern markets where perceived value by customers due to the right combination of product features with the right price according to the market positioning is the key to deploy order winner products and set a sustainable and profitable business. Some tools with a customer-oriented approach, like the QFD, can be helpful in order to spot functions and metrics directly tied with customers' preferences, to maximize the probability to succeed. The correlation matrix of the QFD allows one to obtain the design matrix through a customized skimming criterion that links DPs to FRs through found metrics. The proposed method can be a valid tool for the designer to spot DPs through a systematic approach and have a base for judging the goodness of found solutions.
REFERENCES
[1] Du, X, Jiao, J, Tseng, M.M. (2006). Understanding
customer satisfaction in product customization.
International Journal of Advanced Manufacturing
Technology;31:396–406.
[2] Purwati, A.A. Hamzah, M.L. (2019). Total service quality
management and it’s impact on customer satisfaction and
loyalty of online transportation in Indonesia", International Journal of Scientific and Technology Research, 8(11), 1066-1070.
[3] Musmedi, D.P. Prasodjo, A. (2018), Consumer perception
on imported franchise restaurants in Jember district: Product quality, customer satisfaction, and brand loyalty, International Journal of Scientific and Technology Research, 7(4), 206-210.
[4] Tseng, M.M., Du, X. (1998). Design by Customers for
Mass Customization Products. CIRP Annals. 47:103–106.
[5] Setyowati, T., Fadah, I. (2018). Differentiation competitive
strategy in winning smes advantage at creative industry in Jember, International Journal of Scientific and Technology Research. 7(2), 165-169.
[6] Kim, W.C., Mauborgne R. (2014). Blue ocean strategy :
how to create uncontested market space and make the competition irrelevant.
[7] Girgenti, A., Pacifici, B., Ciappi, A., Giorgetti, A.. (2016). An Axiomatic Design Approach for Customer Satisfaction through a Lean Start-up Framework. Procedia CIRP. 53.
[8] Suh, N.P.. (2001). Axiomatic design: Advances and
applications. Oxford University Press, New York.
[9] Suh, N.P., (2005). Complexity: Theory and Applications,
Ed. Oxford University Press.
4798
[11]Arcidiacono, G., Giorgetti, A., Ciappi, A. (2017). An
Axiomatic Design framework for reliability improvement. ACM Series 2017, 214-217.
[12]Arcidiacono, G., Brown, C.A., Bucciarelli, L., Melosi, F. (2016) Axiomatic Design of Production Systems for Performance Improvement: A Project Identification and Prioritization Model. In: Farid A., Suh N. (eds) Axiomatic Design in Large Systems. Springer, Cham.
[13]Coelho, A.M.G., Mourão, A.J.F. (2007) Axiomatic design
as support for decision-making in a design for manufacturing context: A case study. Int J of Prod Economics, 1-2, 81-89
[14]Girgenti, A., Giorgetti A., Anselmi M., Scatena A.,
Improvement of the Test Equipment for a Stress Corrosion Lab through the Axiomatic Design. Procedia CIRP 34, 162-167.
[15]Blackstone, J., Cox. J.F. (2005), APICS Dictionary.
[16]Arcidiacono, G., Pieroni, A. (2018). The revolution Lean Six Sigma 4.0. International Journal on Advanced Science, Engineering and Information Technology. 8(1), 141-149.
[17]Arcidiacono, G., De Luca, E.W., Fallucchi, F., Pieroni, A. (2016). The use of lean six sigma methodology in digital curation. CEUR Workshop Proceedings, 1764.
[18]Shah, J.J. (1991). Conceptual development of form
features and feature modelers. Res Eng Des 2, 93–108.
[19]Johann, R, Johann, R. (1997). Design and innovation in
successful product competition. Technovation. 17,537– 548.
[20]Frankenberger, E, Birkhofer, H, Badke-Schaub, P. (1998)
Designers : the Key to Successful Product Development. Springer London.
[21]Kano, N. (1984). Attractive quality and must-be quality. Hinshitsu Quality, J Japanese Soc Qual Control. 14:39– 48.
[22]Suh, N.P. (1990). The principles of design. Oxford Univ Press New York.
[23]Giorgetti, A., Girgenti, A., Citti, P., Delogu M. (2016). A novel approach for axiomatic-based design for the environment. Axiomatic design in large systems: Complex products, buildings and manufacturing systems. 131-148.
[24]Gentile, C., Spiller, N., Noci, G. (2007). How to Sustain the
Customer Experience: An Overview of Experience Components that Co-create Value With the Customer. Eur Manag J. 25, 395–410.
[25]Berry, L.L., Carbone, L.P., Haeckel, S.H. (2002).
Managing the total customer experience. MIT Sloan Manag Rev. 43,85–89.
[26]Kaushik, M. (2013). Customer‐ oriented organizations: a
framework for innovation. J Bus Strategy; 34:49–56. [27]Brady, M.K., Cronin, J.J. (2001), Customer Orientation:
Effects on Customer Service Perceptions and Outcome Behaviors. J Serv Res 3:241–251.
[28]Olhager, J. (2003). Strategic positioning of the order
penetration point. Int J Prod Econ. 85:319–329.
[29]Payne, A., Frow, P. (2005). A Strategic Framework for
Customer Relationship Management. J Mark. 69:167– 176.
[30]Mark, L. (2004). Maximising customer relationships and
minimising business risk. Int J Bank Mark. 22:291–296.
[31]Chan, L.K., Cheng, S.W., Spiring, F.A. (1988). A New