Container – Terminal –
Gate – System Optimization
Abdelkader Mazouz, Al Ain University of Science & Technology, UAE Loay Naji, Al Ain University of Science & Technology, UAE
Yuanzhi Lyu, China Gate System, Shanghai, China
ABSTRACT
The utility of the container terminal has become quite remarkable all over the world. It is vital to maximize the utility of the container yard and the terminal gate system. With the ever-increasing importance of containerization in the world, more than 60% of cargo is transported by containers, this ratio even reaches 100% in some highly economic developed and political stable places. It is estimated that, the total quantity of containerization in the world will increase by 10% every year before 2020. The aim of this work is to be used as a decision support system tool when designing and constructing container terminals. The article focuses on optimizing the staging of containers within a terminal gate system. A Port within the main Land China is being used as a test bed to demonstrate the Simulation Model based on Queuing Theory. The analysis considers both the facility and the setting of the terminal gate system by considering the Discrete Event System Theory and the terminal gate system in order to make the daily operation more suitable for the terminal. The research combines the computer simulation method and the actual complex discrete event system, and identifies the most suitable setting and the theoretical maximum capacity for the terminal. Normally, the usage ratio (the busy time) should be around 75%, the simulation findings, the channel performance measures indicators are the usage ratio and the average waiting time the proper number of channel is 3 for entrance channel, and 2 for exit channel with usage ratios of 74% and exit usage of 55%, allocating 3 Entrance Channel (gates) and 2 Exit Channels (gates). Both the entrance and exit saved 2 channels. Both the capacity and channel number calculation are treated as a reference for the future decision maker when it comes to the container terminal construction.
Keywords: System Optimization; Container Terminals; Simulation Model Based; Queuing Theory; Discrete Event System Theory; Terminal Gate System
INTRODUCTION
container terminal is an interface that connects container vessels at sea with trucks on land (Zhang, Liu, Wan, Murty, & Linn, 2003). Although the task is simple, getting the containers from the source to their destination requires many different decisions. Where containers are placed can affect the workload needed to operate the port and, hence, cost time and money. Figuring out the optimum capacity of containers has been under research since the inception of the containers in the 1960s (Zhang et al., 2003). Many researchers, technicians, and analysts have been working to maximize the benefits of port systems with minimal cost. The construction of two-berth container terminals costs about $150, not including dredging and navigation-channel modifications (Kia, Shayan, & Ghotb, 2000). To avoid the high cost of construction, researchers create simulation models to study the benefits of any changes made at the port.
Some research conducted on container capacity included that by Kim and Kim (1998), which focused on the relationship between minimizing the total cost of space with the number of yard cranes needed. Many other researchers addressed how to efficiently handle different attributes of container shipping including space requirements and congestion, crane capacity, and even remarshaling strategies (Kim & Bae, 1998; Kim & Kim, 1998; Taleb-Ibrahimi, de Castilho & Daganzo, 1993; Zhang et al., 2003).
Veras, 1996). Another focus was the relationship between minimizing the total cost of space, and the number of yard cranes needed (Kim & Kim, 1998). For storage capacity, Roux (1996) derived analytical equations to calculate the minimum storage capacity needed under the constraint of infrequent congestion.
Simulation (automation) is one way to calculate how to efficiently handle cranes without the need to physically do the work. Liu, Jula, and Ioannou (2002) explored the benefits of using automated storage/retrieval systems to reduce container-terminal problems. Kia et al. (2000) created a simulation model to compare two different operational systems for two types of containers, with and without an electronic tracking device. Bruzzone and Signorile (1998) used genetic algorithms and simulation to determine the storage clusters of containers of vessels.
Saanen and Dekker (2007) detailed simulating a (transshipment) container terminal with rubber-tired gantry cranes, carefully simulating all movements of the trucks and cranes. Kia, Shayan, and Ghotb (2002) used a computer-simulation technique combined with a mechanical-design technique based on computer-simulation software multi-Gen, to research the port loading/offloading system. Kia et al. (2002) made a three-dimensional virtual simulation of the loading/offloading process to be visualized and parameterized for the Kwai Chung port in Hong Kong, to realize high accuracy for processes forecast at a port. In fact, the aim of (Shabayek & Yeung, 2002) is to make this forecast technique more popular.
This paper analyzes the terminal gate system at China Port, one of the busiest ports in the world, using discrete-event-simulation theory. The goal behind this research was to calculate the maximum throughput of the terminal and the proper number of entrance and exit channels, based on the existing facility and setting in the terminal. Basing our work on the queuing theory, we created a simulation to determine optimum container staging in a terminal-gate system. The paper is divided into three sections. The first section is the research framework section where we explain the simulation events used in the Queue Theory. The second section is the simulation result and analysis where we discuss the details of the simulation run using WITNESS™ software. And finally, the third section where we summarize the findings and provide suggestions for further studies under the conclusion and future work.
RESEARCH FRAMEWORK Methodology
Discrete Event Simulation and Queue Theory
The discrete-event simulation is the process of codifying the behavior of a complex system as an ordered sequence of well-defined discrete events. Understanding a event system is the precondition for understanding discrete-event simulation. Discrete means discontinuous in that each discrete-event occurs at a particular instant in time and does not continue and the interval between each other event is not the same but in has some stochastic character. The simulation in a discrete-event system that aims to change the state of an entity or machine according to the actual operation process. The operation process denotes the sequence of the entity in the whole simulation process. The yard gate system is considered the uncertain and stochastic activities in the system; the discrete-event-system simulation model can predict the gate system through simulation.
Queue Theory
Queue theory is a mathematical theory and method to research the random service system; it is also a main branch of operation research. Many queue problems arise in daily life. For example, buying food in restaurant, borrowing a book at the library, or waiting at a bus stop. In those examples, customer and server, reader and librarian, passenger and bus driver all are separate forms of a queue system and a service system. Congestion has become the most complex problem in queue theory (Hu & Guo, 2007).
Figure 1. Random service system
Service
agency
gather
disperse
input
output
Figure 1 demonstrates a random gather/disperse service system. Any queue system can be considered a random gather/disperse service system (Xu, 1980). In this research, gather means the customer arrives, whereas disperse
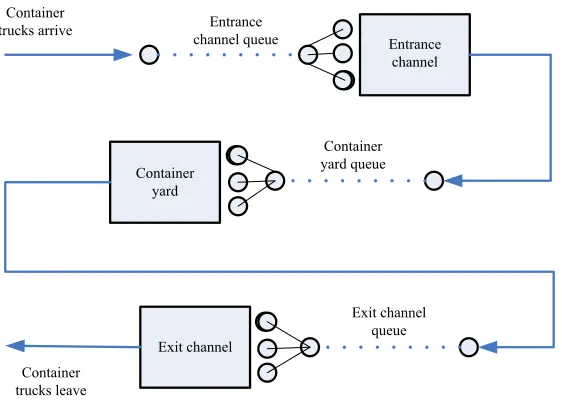
means the customer leaves. Figure 2 demonstrates the queue system used in this dissertation. Figure 2 and Table 1 provides the logical foundation for the modeling process. The service mechanism of the queue system might be First In, First Out or Last In, First Out; however, the system obeys some certain distribution.
Figure 2. Container-truck service queue system
Entrance channel queue
Container yard queue
Exit channel queue
Entrance channel
Exit channel Container
yard Container
trucks arrive
Container trucks leave
Table 1. Description of Yard-Gate System and Operation Process Terminal gate system includes the several operations listed below:
Entrance gate The channels where trucks enter the port and are checked, weighed and examined. Exit gate The channels where the trucks leave the port and are checked and examined.
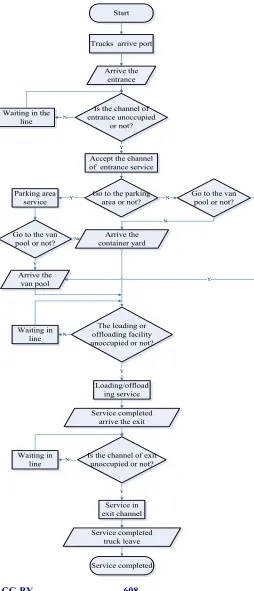
Figure 3 demonstrates the flow of operations at the terminal gate system.
Figure 3.The flow of operations at the terminal-gate system
Start
Trucks arrive port
Arrive the entrance
Is the channel of entrance unoccupied
or not?
Accept the channel of entrance service Waiting in the
line
Go to the parking area or not? Parking area
service
Go to the van pool or not?
Go to the van pool or not?
Arrive the container yard
Arrive the van pool
The loading or offloading facility unoccupied or not?
N Y
Loading/offload ing service
Service completed arrive the exit
Is the channel of exit unoccupied or not? Waiting in
line
Service completed truck leave
Service completed
N
N
Waiting in line
Service in exit channel
N
Y
Y
Y
Y N
N
WITNESS™ Simulation
WITNESS™ is a process-simulation software widely used by companies and universities. In various real business cases, this tool has been successfully used to design and validate plant layouts. In one of the most famous successful cases, WITNESS™ helped the European aeronautics company Airbus design a new passenger aircraft wing facility (Briano, Caballini, Mosca, & Revetria, 2010). WITNESS™ ensured a lean wing-production process and provided a good overall view for the plant. The most remarkable benefit is that the WITNESS™ layout design can bring significant savings in equipment.
Simulation Discrete Elements
The basic discrete modeling elements in WITNESS™ are parts, labor, machines, and buffers (Markt & Mayer, 1997). Parts is the most basic discrete element, representing any object moving through all other discrete elements such as the container. The machine is a discrete element for processing widgets and sending them to their destination. The buffer is where discrete elements are stored. Finally, labor represents resources; each form of labor has its priority. This one is not include in our model but is included in this cursory introduction.
The Operation
Using data obtained from a port in mainland China, a simulation based on queuing theory was generated to optimize the staging of containers in a terminal-gate system. The port in mainland China was used as a test case to demonstrate the WITNESS™ simulation, based on queuing theory. The analysis considers the facility and the setting of the terminal-gate system and combines discrete-event-system theory and the terminal-gate system to make the daily operation of the terminal suitable for the discrete-event-system simulation. The WITNESS™ simulation process rests on queuing theory, simulating the actual operation process of the container-terminal-gate system. In the resulting analysis, the maximum capability and the suitable number of channels demonstrates its rationality. The research combines the computer-simulation method and the actual complex discrete-event system, and discerns the most suitable setting and theoretical maximum capacity for the terminal.
The container-terminal gate is the channel for container trucks transporting cargo. The gate is a key part of the container terminal and a precondition of many operations. Facing progressive throughputs in the ports, how does one effectively organize and design the container terminal system? How does one get the maximum operation capability?
Generally, the container terminal is described specifically with respect to its equipment and stacking facilities. Usually, there are four parts of facilities: the gate system, yard, apron, and berth. From a logistics standpoint, terminals can be considered to have only two components: stock and transport vehicles. The interchanging function of containers is one of the most important aspects of container transportation. Usually, the interchange between the container terminal and people taking/returning containers is the foundation of the division of responsibility between the container manager (the container owner, carrier, etc.) and the container user (the shipper, consignee, and freight forwarder). Figure 1 displayed the logical foundation for the following modeling process: the service mechanism of the queuing system might be First In, First Out or Last In, First Out, but the system obeys certain distributions.
The Simulation Process of WITNESS™
The methods we used to construct this model greatly reduced model-building time. However, it did require a basic knowledge of how WITNESS™ works. WITNESS™ models build on three steps:
1. Display the necessary elements 2. Detail the elements
Display-Model Elements
WITNESS™ is excellent visual-simulation equipment that can display the entity in two- or three-dimensional images. It can display the truck, widget, and labor running state. The user can choose images through the display menu bar or the user can import their own image document in *.dwg format.
Detailing Model Elements
Detailing is a critical approach to the modeling process. Almost all input/output rules, type, lot size, and duration can be defined in this part. WITNESS™ developed its own programming language, push, pull, least parts, etc. We list details in the following modeling process.
Input/output rules. WITNESS™ provides 11 predefined input rules and 12 output rules. The most frequent are push, pull, least, percent, and wait.
Description of the yard-gate system and the operation process. The terminal-gate system includes the entrance gate, exit gate, marshaling yard, container yard, van pool, parking area, and container trucks. The entrance gate is the channel for trucks to enter the port, and also the place to check, weigh, and examine the trucks. The exit gate is the channel for trucks to leave the port, and also the place to check and examine them. The marshaling yard is used for vessels loading/offloading containers to accelerate the task. The container yard is used to transfer and store containers and is used for yard to yard container transferring. The truck can be divided into empty and heavy; heavy trucks are those with containers.
SIMULATION RESULT AND ANALYSIS
The standard of measure the channel’s performance is the usage ratio and average waiting time (Huang, Hsu, Chen, Ye & Nautiyal, 2008). Normally, the usage ratio (the busy time) should be around 75%, if the ratio is too high, there would be congestion and the blocked ratio will be too high in some certain time. It is obvious that if the ratio is too low, it will be a waste for both the construction and labor cost.
Through the WITNESS™ simulation, the final result follows:
Table 2. WITNESS™ Simulation Parameters Parameter
TEU Channel Usage ratio (%) Avg. waiting time (s)
2 Entrance channel Exit channel 46.7 28.9 29.8 3.1
2.3 Entrance channel Exit channel 53.7 33.3 36.5 5.3
2.6 Entrance channel Exit channel 60.8 37.7 43.7 7.90
3 Entrance channel Exit channel 70.0 43.4 53.1 10.6
3.2 Entrance channel Exit channel 74.7 46.3 58.2 12.4
3.3 Entrance channel 76.9 60.3
Exit channel 47.7 13.2
Note. TEU = 20-foot-equivalent units.
Analysis of the Proper Number of Channels
Status Quo Analysis
Presently, the total TEU is 1.85 million, based on the empirical formula below.
𝑁 =𝑄$𝐽𝐾'((1 − 𝐾')
𝑇.𝑇/0𝑃.𝑞3
𝑄$= 1 ,850,000,
𝐾'= 33%
𝐾'(= 2.5,
𝑇0== 360 (𝑑),
𝑇.= 24 (ℎ),
𝑃.= 39 𝑡/ℎ,
𝑞3= 1.1,
𝑁 = 8
The number of entrance channels is five, and exit channels is four. Because presently the total TEU is about 1.85 million, it should be less than the estimate number. It is necessary to find the proper number for the entrance and exit channels. Not only can this simulation save construction costs for the expanding construction, but it can save the current maintenance and labor costs.
Parameter Analysis
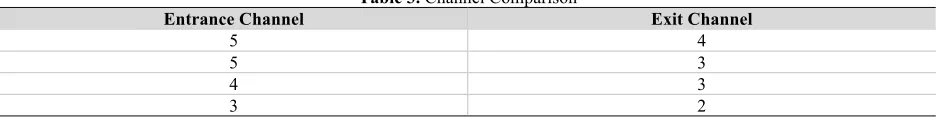
Because the number of channels in the simulation is not fixed, it should be around the actual number: the entrance channel is five and the exit channel is four.
Table 3. Channel Comparison
Entrance Channel Exit Channel
5 4
5 3
4 3
3 2
Table 3 shows the variables; all others are fixed, as shown in Table 4.
Table 4. Fixed Variables
Parameter Data
The trucks arrive interval EXP(16.8, 0.06)
Entrance channel service time (empty) EXP(23.45, 0.04) Entrance channel service time (heavy) EXP(33.18, 0.03) Exit channel service time EXP(15,0.07) The proportion of heavy truck to van pool 1%
The proportion of heavy truck to parking 9% The proportion of heavy truck to container yard 90% The proportion of empty truck to van pool 1% The proportion of empty truck to parking 4% The proportion of empty truck to container yard 95%
The yard crane service time Empirical distribution
The parking time Empirical distribution
The service time in van pool Triangle (3,5,8) min
Time spend on path Normal (3.5,0.5) min
Simulation duration Six month
Through the WITNESS™ simulation, the final result is shown in Table 5. The table shows the simulation results.
Table 5. Result of the WITNESS™ Simulation
Parameter/Pair Channel Usage ratio (%) Avg. waiting time (s)
(5, 4) Entrance channel Exit channel 44.4 27.5 27.1 2.6
(5, 3) Entrance channel Exit channel 44.4 36.6 27.1 3.4
(4, 3) Entrance channel 55.5 35.2
Exit channel 36.6 3.4
(3, 2) Entrance channel Exit channel 73.9 54.9 40.2 5.7
The standards of measure of the channel’s performance are the usage ratio and average waiting time. Normally, the usage ratio (the busy time) should be around 75%, so from the simulation results, the proper number of channels is three for entrance channel, and two for the exit channel. The entrance and exit can each save two channels. The capacity and channel-number calculation can be treated as a reference for future decision makers in container-terminal construction. Table 5 expresses the following as the usage ratio and the average waiting time displayed at each gate, either an Entrance or Exit Gate. For instance for the pair (5,4) where we have 5 Entrance Gates and 4 Exit Gates, the results show 44.4% usage at the Entrance gates and 27.5% at the Exit gates. The best scenario depicted from the WINESS Simulation is (3,2) where there are 3 Entrance Gates and 2 Exit Gates displaying 73.9% entrance usage rate and 54.9% exit usage rate, and average waiting time are 40.2 seconds at the Entrance gates and 5.7 seconds at the exit.
CONCLUSION AND FUTURE WORK
The goal of the TEU is 3.2 million, so the maximum throughput is determined accordingly. Based on the simulation runs, the interval in minutes is inversely proportional to TEU, as the objective of the TEU increases the interval in minutes will decrease, considering all other variables are fixed as stated in table 4. Based on the existing number of channels, the number of entrance channels is 5 and the number of the exit channel is 4. The total last year TEU is 1.85 Million. The standard measure of the channel’s performance is the usage ration and average waiting time.
Under normal conditions, the average ought to be 75%, in case the ratio is too higher than 75%, the system is considered in an overload congestion state. On the other hand, if the ratio is less than 75%, the system is not using resources in an optimized manner, and hence wasting resources. From the WITNESS™ Simulation run, the TEU of 3.2 the usage ratio at the entrance channel is 74.7 and at the exit channel is 46.3. These runs are acceptable and translated in a close to 75% for the entrance channel with a waiting time of 58.2 sec, and the exit channel having a very low waiting time of 12.4 sec. Even if the TEU is increased to 3.3, the entrance and exit channels average waiting time is closer to the previous ones.
A viable suggested future work is to gather data from two shipyards within the Gulf Region having high traffic for instance Jabel Ali in Dubai, and Doha port in Qatar ports and run a similar simulation using WITNESS™ Platform and can benefit from testing this proposed model to improve port performance.
REFERENCES
Briano, E., Caballini, C., Mosca, R., & Revetria, R. (2010). Using WITNESS™™ Simulation Software as a validation tool for an industrial plant layout. Proceedings of the 9th World Scientific and Engineering Academy and Society International Conference on System Science and Simulation in Engineering (pp. 201–206). Sofia, Bulgaria.
Bruzzone, A., & Signorile, R. (1998). Simulation and genetic algorithms for ship planning and shipyard layout. Simulation, 71, 74–83.doi:10.1177/003754979807100202
Holguin-Veras, J. (1996). Priority systems for marine inter-modal containers (Unpublished doctoral dissertation). The University of Texas, Austin.
Hu, Y. Q, & Guo, Y. H. (2007). Operation research. Beijing, China: Tsinghua University Press.
techniques’. Int. J. Computer Applications in Technology. Vol. 247-248
Kia, M., Shayan, E., & Ghotb, F. (2000). The importance of information technology in port terminal operations. International Journal of Physical Distribution & Logistics Management, 30, 331–344. doi:10.1108/09600030010326118 Kia, M., Shayan, E., & Ghotb, F. (2002). Investigation of port capacity under a new approach by computer simulation.
Computers & Industrial Engineering, 42, 533–540. doi:10.1016/S0360-8352(02)00051-7
Kim, K. H. (1997). Evaluation of the number of rehandles in container yards. Computers & Industrial Engineering, 32, 701–711. doi:10.1016/S0360-8352(97)00024-7
Kim, K. H., & Bae, J. W. (1998). Re-marshaling export containers in port container terminals. Computers & Industrial Engineering, 35, 655–658.doi:10.1016/S0360-8352(98)00182
-X
Kim, K. H., & Kim, H. B. (1998). The optimal determination of the space requirement and the number of transfer cranes for import containers. Computers & Industrial Engineering, 35, 427–430.doi:10.1016/S0360-8352(98)00125-9 Liu, C. I., Jula, H., & Ioannou, P. A. (2002). Design, simulation, and evaluation of automated container terminals. IEEE
Transactions on Intelligent Transportation Systems, 3, 12–26. doi:10.1109/6979.994792
Markt, P. L., & Mayer, M. H. (1997). WITNESS™ simulation software: A flexible suite of simulation tools. Proceedings of the 1997 IEEE Winter Simulation Conference (pp. 711–717). New York, NY.
Roux, E. D. (1996). Storage capacity for import containers at seaports (Unpublished doctoral dissertaton). University of California, Berkeley.
Saanen, Y. A., & Dekker, R. (2007). Intelligent stacking as way out of congested yards? Part 1. Port Technology International, 31, 87–92. Retrieved from https://www.tba.nl/resources
/press+section/publications/intelligent_stacking_as_way_out_of_cngested_yards._part_1.pdf
Shabayek A., Yeung W. (2002). A simulation model for the Kwai Chang container terminals in Hong Kong[J]. European Journal of Operational Research. 140: l—11.
Taleb-Ibrahimi, M., de Castilho, B., & Daganzo, C. F. (1993). Storage space vs handling work in container terminals. Transportation Research: Part B: Methodological, 27, 13–32. doi:10
.1016/0191-2615(93)90009-Y
Thompson, B. (1994). A tutorial for modeling with the WITNESS™ visual interface simulation. Proceedings of the 1994 Winter Simulation Conference. 517-518.
Xu, G. (1980). Stochastic service system (2nd ed.). Beijing, China: Science Press.