The Use of BPM and Lean Thinking to
Reduce Processing Time in Technical
Assistance for Electronic Devices
Anderson L.N.de Oliveira1, Mário Cesar Fialho21
Student ofIndustrialEngineering, Faculdades Integradas de Cataguases- FIC/UNIS 2
Expert in Business Logistics, Universidade Federal de Juiz de Fora-UFJF
Abstract: Process management is important for optimizing the results of organizations. This study introduces the Business Process Management (BPM) and Lean Thinking application in a small business that provides technical assistance services on electronic devices. The BPM is a comprehensive concept that features a variety of process management solutions and information technology focused on optimizing results. The methodology was adapted to the context of the small company studied. It was made the mapping of the current state of the process in BPMN, analyzed the problems to identify its causes, then proposed a new optimized model in which the processing time is shorter. The comparison of the results was performed by simulating the two scenarios in Bizagi Modeler software. According to the simulation results, the resource wait time has been reduced from 7% to 1.9% of the total processing time, while the average processing time has been reduced by 8 days and 12 hours.
Keywords - BPM, Process, Simulation, Lean, BPMN
I.INTRODUCTION
Organizations, especially Small and Medium-sized Enterprises (SMEs), to remain competitive need to innovate and actively manage their processes in order to achieve the best results, both financial and organizational. To meet this need it is necessary to adapt new administrative models. According to Lima (2017), many companies are motivated to restructure their processes, seeking to reorganize and recover their potential in the market.
It is observed that companies make use of Business Process Management (BPM) to reformulate their processes in order to obtain satisfactory results in their business. The BPM, according to Severo (2017), has been transmitted in order to understand end-to-end work processes, organize activities and improve performance through process orientation. The authors Jacoski and Grzebieluchas (2011), conclude that BPM is used as a differential by large companies and meets the worldwide trend of managing processes. And that this concept, along with several other tools like continuous improvement, Plan, Do, Check, Act (PDCA), Six Sigma, among others, constitute a way to manage processes.
According to the Instituto Brasileiro de Geografia e Estatística - Brazilian Institute of Geography and Statistics (IBGE, 2018), the Pesquisa Nacional por Amostra de Domicílios - National Household Sample Survey (PNAD, 2016) showed that 92.6% of Brazilian households had cell phones in 2016. This survey also reported that cell phone was the Internet access means most used in households, mainly used to communicate. Today, electronic devices are used daily by much of the world's population. The media are increasingly diverse: notebook, tablet, mobile phones and smartphones; making it a necessity for much of society.
Thus, the present work is justified by the need for quality technical assistance, given that customers are increasingly demanding, seeking to reduce lead time and excellence in service provision.
In addition, according to Santos and Costa (2016), for SMEs to remain competitive in the market, it is necessary to obtain an end-to-end view of their processes so that it is possible to know what are the origins of the problems faced by the organization, which today represent inefficiency in the strategic processes, either because the nature of the problem is the lack of managerial vision and the application of good administrative practices, for not having so many resources to invest or for the complexity of the strategic planning tools. Knowing the source of the problem is crucial, because you can only improve what you really know and how it is performed.
Thus, the objective of this paper is to optimize the process of an electronic technical assistance in a company located in Zona da Mata Mineira. The aim is to identify waste and opportunities for improvement in their processes, reducing the time used from the arrival of the device in the service, until its return to the customer.
II.LITERATUREREVIEW
A. Business Process
According to the Association of Business Process Management Professionals (ABPMP, 2013), process can be defined as a set of activities ordered and integrated for a productive purpose specified by a customer or market for the purpose of obtaining products or services.
Still according to ABPMP (2013), “a Business Process is work that delivers value to customers or supports / manages other processes. This work can be end-to-end, cross-functional and even inter-organizational. The notion of end-to-end work is key, as it involves all the work, crossing functional boundaries needed to deliver value to customers.”(ABPMP, 2013, p. 35).
According to Lima (2017), in the organizations view, processes are not seen as loose activities and procedures, but as what should make sense and aim at the final customer focus, ensuring business sustainability.
B. Process Management
Working through processes is to have an overall view of the activities performed in an organization to identify how those activities add value to the product or service delivered. According to Cavalcanti (2017), companies are structured in a departmental view, that is, each one performs their task individually without having the notion of the set of activities that generate the product. In process management, there is a globalization of all processes and the interconnection of departments, which ensures customer satisfaction.
a) BPM Life Cycle: The ABPMP (2013) proposes a typical life cycle for pre-modelledbehavioral processes that includes the activities: Planning, Analysis, Design, Implementation, Monitoring & Control and Refinement; However, it points out that BPM CBOK is not a prescriptive guide, emphasizing that this cycle can be found in different ways in the literature. This same lifecycle model is also found in the previous version of the ABPMP book published in 2009.
Bezerra et al. (2018), in a comparative analysis between various BPM lifecycle models, presented some attributes that should be associated with BPM implementation and that it is essential that they contain the lifecycle used for efficient process management. These key attributes are alignment with the organization's strategy; relationship with the external environment; alignment with organizational resources and capabilities; activities and tools that support each phase of the cycle; culture and staff; information Technology; feedback / continuous improvement.
According to Milan and Soso (2012), it is important to use a well-structured BPM lifecycle model to evolve from departmental to process vision, so that this model serves the organization's
employees and customers well, adding value to the business. The author also points out that the life cycle proposed by ABPMP (2009) is a simple and intuitive model, being extremely useful for deploying BPM in an organization.
b) Process Mapping: According to Albertin and Pontes (2016), process mapping allows a better understanding of how an organization works through visual representation, which facilitates the identification of opportunities for improvement and simplification of activities. Cavalcanti (2017) points out that process modelling aims to graphically represent the chain of activities that make up a process and that the purpose is to provide a simplified but integrated view, which may contain the inputs and outputs of the process, the interfaces, the performers of the activities, or any information necessary for a predetermined purpose. The author also states that, due to the complexity of reality, a model becomes very useful, since it represents a simplification of this reality, which facilitates the understanding of what is happening.
According to Back et al. (1998 apud Jacoski and Grzebieluchas, 2011) for the organization to implement a proper mapping, it is essential that the person responsible for modelling knows the process in detail. In this way, it is possible to know the methodologies, tools and techniques included in the process so that the modelling represents its global vision.
c) BPMN – Business Process Modelling Notation:
The BPMN is a process modelling notation that was created in 2004 by the Business Process Management Initiative (BPMI).
According to Tessari (2008), BPMN has a set of symbols that allows the creation of models for communication purposes and business process documentation. This notation, according to the author, “was designed to be easy to use and understand and to provide the ability to model complex business processes” (TESSARI, 2008).
“Business Process Modelling Notation (BPMN) is a notation, in which there is a set of rules for standardizing both business process modelling and design” (MARANHÃO, 2011).
C. Lean Thinking
According to Almeida (2010, apud ANDRADE, 2014) the term “Lean Production” was coined by researchers from the Massachusetts Institute of Technology (MIT) in James P. Womack's The Machine That Changed the World., Daniel T. Jones and Daniel Roos. The book features the Toyota Production System (SIT), by the Japanese automaker that stood out in the 1980s for being a different production system from those found in the US at the time.
possible to make major investments in the face of the financial crisis in which Toyota was at the time so they decided to adopt a system that can identify and eliminate losses to increase productivity.
Although it comes from the auto industry, Lean can be applied to any business. According to Lopes (2011), a kind of block has been created between the industries of other branches to accept that the technique can be applied in other types of business. Thinking about ending this block, authors Womack and Jones (2004) created the book “The Lean Thinking”, which presented Lean no longer as a production system, but as a management philosophy that can be applied to any organization. The Lean philosophy is based on eliminating waste or activities that do not add value to the customer. According to ABPMP (2013), to draw a TO-BE map of how a process should flow to add value to the product / service, one of the critical aspects is “reducing waste related to overproduction, handling, waiting, transportation, defects, inventory, and worthless processing (known as the seven basic Lean waste).”(ABPMP, 2013, p. 238).
III.METHODOLOGY
This work was produced from literature review and applied in a company that provides technical assistance services in electronic devices, such as smartphones, tablets, video games and notebooks.
The organizational context was studied, as well as the target audience of the company object of study, its mission and the main problems faced by the organization. It was made available by the company, through PDF file, the descriptions of the processes and subprocesses associated with the management of Service Orders (SOs). Other material available, also in PDF, was the satisfaction survey report carried out in 2017. The study process includes 9 (nine) employees: 4 (four) technicians, 3 (three) attendants, and 2 (two) assistants.
The company uses the SHOficina system for SO management. The SHOficina is an SME management software focused on the field of support, repair and maintenance of equipment in general. From it were extracted SO data from January to December 2018. The report extracted from this system contains information such as number of open and closed SOs, the average time between opening the SO and getting ready, the time from ready to delivery to the customer, opening and closing times, peak demand, device types, etc. Analyzing this report was helpful in planning and understanding the context of the organization, opportunities, and even issues it faced.
A. Modelling and Simulation
For the AS-IS and TO-BE process modelling, the BPMN was adopted and the Bizagi Modeler tool, which is a process modelling software. The software, besides being simple, intuitive and totally based on
BPMN, also simulates the processes drawn in it. During all stages (Planning, Mapping, Design, Implementation, Monitoring and Refinement), process participants were involved.
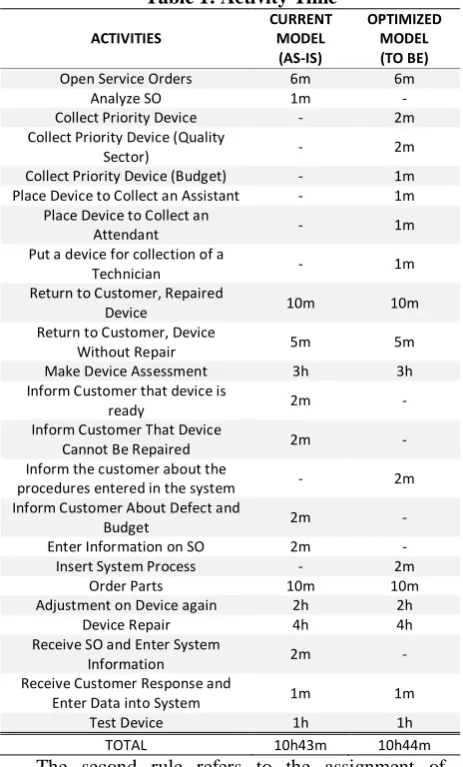
To perform the simulation of the AS-IS and TO-BE scenarios, the Bizagi Modeler software simulation tool was used. So that the two models could be compared, rules were defined. The first rule was to have equivalent times for activities. Table 1 describes the process activities and the times assigned to them in both scenarios. Time was based on on-site measurements during the activities. For activities that exist in the TO-BE model but are not in AS-IS, time was hypothetically defined from the measurements made in the current model (AS-IS).
Table 1: Activity Time
ACTIVITIES
CURRENT MODEL (AS-IS)
OPTIMIZED MODEL (TO BE)
Open Service Orders 6m 6m
Analyze SO 1m -
Collect Priority Device - 2m
Collect Priority Device (Quality
Sector) - 2m
Collect Priority Device (Budget) - 1m
Place Device to Collect an Assistant - 1m
Place Device to Collect an
Attendant - 1m
Put a device for collection of a
Technician - 1m
Return to Customer, Repaired
Device 10m 10m
Return to Customer, Device
Without Repair 5m 5m
Make Device Assessment 3h 3h
Inform Customer that device is
ready 2m -
Inform Customer That Device
Cannot Be Repaired 2m -
Inform the customer about the
procedures entered in the system - 2m
Inform Customer About Defect and
Budget 2m -
Enter Information on SO 2m -
Insert System Process - 2m
Order Parts 10m 10m
Adjustment on Device again 2h 2h
Device Repair 4h 4h
Receive SO and Enter System
Information 2m -
Receive Customer Response and
Enter Data into System 1m 1m
Test Device 1h 1h
TOTAL 10h43m 10h44m
Table 2: Gateways and Percentages
GATEWAYS
PERCENTAGE TO “YES”
Budget? 80%
Authorized Service? 80%
Need to Request Parts? 90%
Device had repair? 80%
Device Had Repair?
(Readjustment) 90%
Flawless Device? 90%
Finally, the number of inputs that are generated by the process start event was defined. This number defines how many times the process will be executed, in other words, how many devices will enter the simulated process. The amount of 100 inputs has been assigned in both scenarios.
IV.RESULTSANDDISCUSSIONS
A. Planning
As already mentioned, the company provides technical assistance services in various electronic equipment, as well as being a store. The present work focused on the critical business process, which is Service Order (SO) Management.
According to the report provided by the company, Smartphones represent 60.1% of equipment received to be repaired. It also fixes Tablets (10.2%), Video Games (9.6%), TV Receivers (9.2%) and other electronic equipment (10.9%). Throughout the SO management process, the devices go through three sectors of the company: the service, technical assistance and quality sector. Only service employees have direct contact with customers and the SO management system. Over a period of one year, the company opens an average of 4115 SOs. In 2018 (period analyzed), the company closed 3604 SOs. Of this total of outgoing equipment, 2341 (65%) were
delivered repaired and 1263 (35%) delivered unrepaired, either because the customer did not authorize the service after budget or because the device had no repair. The report also points out that the average time between opening the SO and its status being set to “ready” is 12 days and 12 hours and from “ready” to “returned” is 33 days and 14 hours.
In this phase, the definition and study of the organizational context, mission of the company, its values and the definition of the profile of customers using the services was fundamental. The company aims to exceed customer expectations regarding the quality of services. From the facts briefly identified in this step, it became easier to identify the root of the problems by mapping the current process (AS-IS). It is mentioned in BPM CBOK (2013) that the BPM cycle begins with a planning that provides direction according to the organization's strategy. In this phase, goals, methodologies and expectations are also defined. The company studied aims to reduce complaints regarding the delay in delivery of handsets. Analyzing the research and satisfaction material made in the year prior to the present study, the main customer complaints are about the non-compliance with the delivery times of the handsets and what makes the customers more satisfied is the good service and quality in the services provided.
B. AS-IS Mapping
In general, the mapped process addresses from when a defective device comes to service until it is returned to the customer. The current situation modelling (AS-IS) was performed in three meetings based on the testimony of employees and with the help of documentation provided by the company. With the information acquired, the AS-IS Flow was obtained, as shown in Fig. 1. After that, the flow was validated with the process manager.
Fig 1:AS-IS Model
With the mapping performed, the execution time of the activities was measured with the help of the
shown in Table 1) was identified, in which parts of the designed process are the “Waits” and identified rework, i.e. showed how much the same activity needed to be performed again. for the same service. All information was recorded and considered during the AS-IS analysis.
C. AS-IS Analysis
With the AS-IS model ready it was possible to have an overview of the activities and their relationships, thus identifying inefficient points of the process. It was noticed during the meetings that, on several occasions, the main problems were due to excessive waiting during the process as a whole; failure to communicate between employees or between the company and the customer; lack of prioritization to perform the services.
For each activity performed, the SO is subject to waiting in some way, either due to lack of customer approval, lack of stock or simply waiting for one of the employees to be available to proceed with the process (awaiting appeal). The time waiting for resource can be viewed for the main activities described in Table 3. These waiting points have been mapped and are identified with event timer symbol in the AS-IS drawing for better viewing. According to the simulation data, the SO is in the “Standby” state waiting up to 2 days 11 hours and 36 minutes, which represents 7% of the total processing time (34d, 16h and 45m) of the 100 inputs.
Table 3: AS-IS Activities Wait Time
ACTIVITY
TOTAL TIME WAITING FOR
RESOURCE (HH:MM:SS)
Analyze SO 01:42:17
Make Device Assessment 16:00:52
Order Parts 19:27:59
Adjustment on Device again 04:32:30
Device Repair 17:52:29
TOTAL 59:36:08
The activities described in Table 3 are just where the waiting points appear in the drawing. “Analyze SO” is the activity that starts testing devices by the quality industry; “Make Device Assessment”, “Order Parts” or “Device Repair” are the activities that initiate the repair done by technicians in the technical assistance; “Adjustment on Device again” are the times the technician needs to repair the same device for the second (or nth) time.
The process is structured so that only the attendant has direct contact with the customer, so if the customer passes any information after the opening of the SO, which is printed, the information is entered in the system, but not always reaches other employees who are in touch with the provision of the service. This happens because these employees perform their
activities based on what is on paper rather than what was entered in the system or simply spoken by the attendant (updated information). Often this miscommunication causes the customer's desire for service not to be fully met in a timely manner. On the other hand, assistants and technicians have the custom of writing in this printed SO relevant information. This information needs to be entered into the system, but this does not always happen. When information is on paper only and is not entered into the system, there is a risk that it will not reach the customer as the system prints this information (from the system) on the delivery term (or warranty term).
The SOs are opened, printed, this paper is placed next to the device to wait for a technician to collect and perform the services. After opening each SO, the devices are placed on hold in the “Authorized” or “Awaiting Technician Evaluation (Budget)” box. So, the technicians collect these two heaps of handsets, make the budget ones first, and then the authorized ones. There is no prioritization criterion that guides which device of that mount should be evaluated first or which service of that mount should be done first.
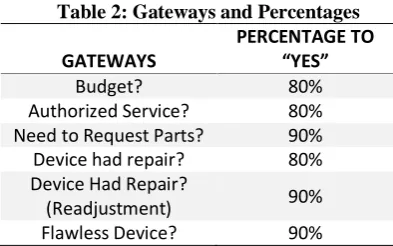
D. TO-BE Modelling
The TO-BE drawing was prepared according to the strategy described in section IV-A and is shown in Fig 2.
The process was designed so that each employee, instead of making notes in the printed SO, enter the information directly into the system and change the status of the service, generating procedures. Employees access the information entered in the system before starting their activities to each SO, which ensures that if any information coming from the customer is entered after the opening of the SO, the employee will know. Another improvement implemented in the new process is the use of service prioritization, which has now become possible for all employees to access the system before starting their activities. The system itself informs which priority service according to arrival order and priority at SO opening time. The system always had this management function, but it was not used in AS-IS, as the devices were all collected together, and the system was not consulted by assistants and technicians before they began their activities.
demonstrated inside this pool that do not have this symbol, can only be performed by technicians, as shown in Fig 4.
Fig 3 Example of activity performed by assistants or technician, object has a user drawing to differentiate it from other activities.
Fig 4 Example activity performed by technicians only.
Importantly, the number of employees has not changed. The quality sector, which once had two assistants, now has only one. The change was local, at TO-BE an assistant also works within the technical assistance.
E. Process Simulation
To simulate, we used the business process models AS-IS and TO-BE. The purpose of the simulation is to compare the efficiency of the optimized process with the current process. The simulation tool was parameterized in both scenarios according to the rules described in section III-A.
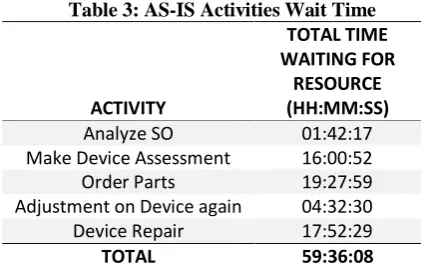
According to the simulation result, using the 100 inputs, the average processing time was 11 days, 2 hours and 41 minutes in the current model. This means that in the AS-IS scenario, a single SO takes an average of 11 days to set to “ready”, which makes sense to look at the result displayed in the report extracted from the SHOficina software. The Fig5 shows the simulation of the current process displayed by Bizagi Modeler software.
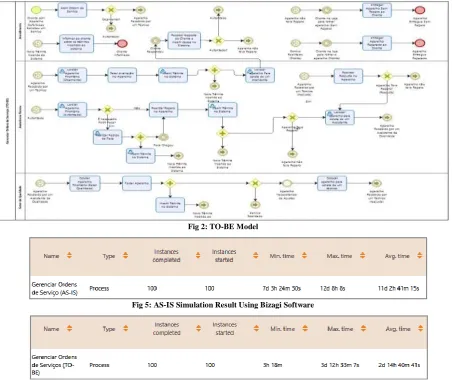
The simulation of the TO-BE model using 100 inputs showed an average of 2 days, 14 hours and 40 minutes per SO, demonstrating that the processing time was reduced. The Fig 6 shows the simulation result of the TO-BE model.
Fig 2: TO-BE Model
Fig 5: AS-IS Simulation Result Using Bizagi Software
Fig 6: TO-BE Simulation Result Using Bizagi Software
Comparing the result of the two scenarios, it is observed that the optimized process runs more efficiently. The TO-BE model processes 8 days and
Another important result to compare is the waiting time for resources. It was observed during analysis of the AS-IS model, that of the total time used, 7% was “Waiting” state. While in the AS-IS model the total waiting time was 2 days 11 hours and 36 minutes, in the TO-BE model 14 hours and 4 minutes were obtained as a result. This represents 1.9% of the total time used in the TO-BE model (30d, 17h and 53m). The Table 4 describes the differences in waiting time for AS-IS and TO-BE activities.
Table 4: AS-IS and TO-BE Total Waiting Time
ACTIVITY
TOTAL TIME WAITING FOR RESOURCE
(HH:MM:SS) AS-IS TO-BE
Analyze SO 01:42:17 -
Collect Priority Device (Quality Sector) - 4:23:05
Collect Priority Device (Budget) - 0:46:47
Collect Priority Device (Quality Sector) - 0:01:33
Put a device for collection of a Technician
00:00:00 0:10:00
Make Device Assessment 16:00:52 1:21:09
Insert System Process - 00:52:01
Order Parts 19:27:59 0:01:00
Adjustment on Device again 04:32:30 1:13:29
Device Repair 17:52:29 5:14:40
TOTAL 59:36:08 14:03:43
Analyzing the times described in Table 4, we can observe the large time difference, especially in the activity “Order Parts”. This is because on the TO-BE model, a technical assistant can order parts.
V.CONCLUSIONS
This work optimized a small business process and showed that satisfactory results can be achieved using management tools used in large organizations. The purpose of this paper was to use BPM concepts for process improvement, identifying the company's strategies and aligning the processes with these objectives. To perform this task, BPMN Process Modelling and Process Simulation were performed to measure the results.
In general, the study achieved the objective mentioned in the work proposal, which is to reduce processing time for faster service. The SO management process was analyzed and mapped, so improvements were suggested through BPM from the perspective of lean thinking. According to Lean Thinking, waste should be reduced, and activities directed to customer needs, making it the focus of the business process. After mapping the current process, it was possible to clarify in which points of the process were the causes of the problems faced by the company. The proposed transformations in the new mapped process were aligned with the company's strategy. Although there were no major process transformations, it was possible to identify
the causes of delivery delays and eliminate them in the new model, which has a much greater interaction between employees, which allowed the reduction of waiting times and processing through more efficient communication, service prioritization scheme and meeting customer needs. From these improvements, the resource wait time has been reduced from 7% of total processing time to 1.9% of total processing time. And the average processing time was reduced by 8 days and 12 hours.
The most notable academic contribution of this study is the success of process management even in small organizations. The work was carried out following the proposed steps, and no major barriers were identified, as BPM has a wide range. For future studies, suggest is using this simulation tool (Bizagi Modeler) to identify maximum input capacity or using Bizagi Studio software for a deeper and broader view of dependencies from one activity to another.
REFERENCES
[1] ABPMP - ASSOCIATION OF BUSINESS PROCESS MANAGEMENT PROFESSIONALS. Guia para o gerenciamento de processos de negócio: corpo comum de conhecimento (BPM CBOK). Versão 3.0. Chicago: Association of Business Process Management Professionals, 2013. Primeira liberação em português. [2] ALBERTIN, M. R.; PONTES, H. L. J. Gestão de processos
e técnicas de produção enxuta. InterSaberes. Curitiba, 2016. [3] ANDRADE, Karen Franco. Aplicação de Conceitos do
Lean Office para Melhoria de Fluxos de Informação. 54 p. Monografia (Graduação em Engenharia Industrial Química) - Universidade de São Paulo, Lorena, 2014.
[4] BEZERRA, M. C. da C.; TAVARES, M. S. de A.; SILVA, R. M. da (2018). Gerenciamento dos processos de negócio: uma análise dos modelos de ciclo de vida BPM. Revista Produção Online; v. 18, n. 3. Disponível em: <https://producaoonline.org.br/rpo/article/view/2905>. Acesso em: 31 mar. 2019.
[5] CAVALCANTI, Rubens. Modelagem de processos de negócios: roteiro para realização de projetos de modelagem de processos de negócio. BRASPORT. Rio de Janeiro, 2017.
[6] IBGE – INSTITUTO BRASILEIRO DE GEOGRAFIA E ESTATÍSTICA (2018). Pesquisa Nacional por Amostra de Domicílios (PNAD): domicílios com acesso à internet em
2016. Disponível em:
<https://agenciadenoticias.ibge.gov.br/agencia-sala-de- imprensa/2013-agencia-de-noticias/releases/20073-pnad- continua-tic-2016-94-2-das-pessoas-que-utilizaram-a-internet-o-fizeram-para-trocar-mensagens>. Acesso em: 15 mar. 2019.
[7] JACOSKI, C. A.; GRZEBIELUCHAS, T. Modelagem da contratação de projetos utilizando os conceitos de BPM - gerenciamento de processos de negócio. Produto e Produção, Porto Alegre, v. 12, n. 3, p.29-37, 01 out. 2011.
Trimestral. Disponível em:
<http://seer.ufrgs.br/index.php/ProdutoProducao/article/vie w/9538/13957>. Acesso em: 28 mar. 2019.
[8] LIMA, Rodolfo Neves de. Análise de processos sob a ótica do bpm e lean office: estudo de caso da empresa júnior do curso de administração da UFRN. 2017. 63f. Trabalho de Conclusão de Curso (Graduação em Administração), Departamento de Ciências Administrativas, Universidade Federal do Rio Grande do Norte, Natal, 2017.
Engenharia de Produção) - Universidade de São Paulo, São Carlos, 2011.
[10] MARANHÃO, Mauriti. MACIEIRA, Maria Elisa Bastos. O processo nosso de cada dia: modelagem de processos de trabalho. 2. ed. Rio de Janeiro: Qualitymark Editora, 2011. [11] Milan, G. S., & Soso, F. A. (2012). BPM – Business
Process Management Como Prática De Gestão em uma Empresa Metalúrgica com Estratégia de Produção ETO – Engineer-To-Order. Revista Gestão Industrial, 8(2), 164– 185.
[12] SANTOS, Deliane Pessoa. COSTA, Robson Antonio. Business process modeling notation nas micro e pequenas empresas: um estudo de caso na empresa chocolate com tapioca. Revista Interdisciplinar Científica Aplicada,
Blumenau, v.10, n.3, p.22-39, TRIII 2016. ISSN 1980-7031.
[13] SEVERO, Ricardo Augusto Niederauer Flores. BPM e Lean integrados em uma abordagem de mapeamento e análise de processos: estudo de caso em uma instituição de ensino superior pública. 2017. 75f. Trabalho de Conclusão de Curso (Graduação em Administração), Departamento de Ciências Administrativas, Universidade Federal do Rio Grande do Norte, Natal, 2017.