Breakdown and Reliability Analysis in a Process Industry
Dibyojyoti Deka
1,Dr.Thuleswar Nath
21Masters in Production & Industrial Engg, JorhatEngg. College 2Associate Professor, Mechanical Engg. Deptt.JorhatEngg. College
Abstract- The complex nature of modern equipment and systems often lead to failures and as a consequence lead to increase in machine downtime0 thus affecting production. The failures of machineries cause disruptions in production resulting in a loss of availability of the system .This further increases the cost of maintenance. TPM has been proved as a successful tool for increasing the OEE of machineries by using simple effective techniques. Initially in this study Pareto analysis was used to figure out the major contributors towards downtime losses. RCA using the Why-Why technique was done so as to explain the reasons behind equipment breakdown. This helped in developing a PM schedule for the machines. Reliability is an important parameter for any piece of equipment. In this study Weibull statistics was used to measure the reliability of the system and also explain the CDF governing the rate of failure. The fitness of the model developed using weibull distribution was further verified using the KS test which is a “distance test”. The value of the shape parameter β helped to understand the current state of the machine and justify the use of the PM schedule developed.
Keywords: Downtime Losses, TPM, OEE, Pareto analysis, PM schedule,Weibull distribution, CDF, Distance test, K-S test.
Abbreviations:
TPM: Total Productive Maintenance.
OEE: Overall Equipment Effectiveness. RCA: Root cause analysis.
PM: Preventive Maintenance.
CDF: Cumulative distribution function. K-S: Kolmogorov-Smirnov.
I. INTRODUCTION
In most cases machine operators fail to detect the actual causes behind any problem whenever a failure occurs. They are often seen treating the symptoms rather than eliminating the problem at the grass root level. This further elevates the problem to a whole new level which would have otherwise not occurred had it been treated correctly in the first place. An in depth analysis together with experience and training only prepares an individual for proper handling of failed equipments. A thorough practical knowledge of mechanical, electrical as well as electronic parts able an operator to run a complex piece of equipment like the pouch machine smoothly. Mostly operators gather the basic knowledge through experience in the field. But this has a side effect as well, till the time they had become experts in their fields they had already wasted a considerable amount of valuable production time. Analysis of root causes through brainstormingand training sessions can only give a clear picture to the operators of equipments they are handling. This study was done on the pouch machine or the vertical filling and sealing machine in a cosmetic plant. This machine has a wide variety of applications from packing liquids, semi liquids to powder products as well. Table Ishows specifications of the machine under study.
TABLE I: MACHINE SPECIFICATIONS
II. LITERATURE REVIEW
Equipment breakdown has always contributed towards machine downtime. Industrial Engineers have always tried to reduce downtime and increase the availability of machineries. TPM plays a vital role in achieving it. Wakjira, MelesseWorkneh. et al. (2012) has been able to reduce downtime and increase the OEE of existing machineries by TPM implementation in boiler plant in an Ethiopian malt manufacturing unit. Through TPM, Gupta, Amit Kumar. et al. (2012) has been instrumental in increasing the availability of existing machinery hence reducing the need for further capital investment. The forth pillar of TPM,Planned maintenance addresses the problem of equipment breakdown. Preventive
maintenance, Breakdown maintenance, Corrective maintenance and lastly Maintenance prevention are
Speed
Up to 66 strokes per min. Depending upon product and
quantity to be packed.
Max roll width 800 mm
Max roll diameter 600 mm
Max pouch length 135mm
No. Of tracks 8
Main motor
3 hp, A.C. 3 phase 440 V, induction motor
Power consumption 10 KW
Machine dimensions 3.25 m*1.6 m *2.7 m Air required 12 cfm at 12 kg per cm
Net weight 2000 kg
the techniques involved in Planned maintenance. Preventive maintenance checklists as prepared by M, Manoj., et al (2014) helped increase availability, MTBF and reduce MTTR significantly. Also the number of machine breakdowns were reduced after implementation in this case. Parameters like reliability, MTTR and MTBF are also important factors that define Equipment breakdown and help to understand equipments better. To measure the reliability of any equipment, it is of utmost importance to find out the cumulative distribution function (CDF) governing the failure rate. Mirzai, M. et al. (2006)
uses weibull distribution to explain the failure rate of power transformers in an Iranian electric company. This paper further does a goodness of fit test on the developed mathematical model by using the KS test.
Bose, D., et al (2013) evaluates reliability, availability and maintainability of a diesel locomotive engine and uses weibull statistics to explain the failure rate.Wang, Hsaio-Mei., (2009) states that for distance tests in cumulative distribution function (CDF) the KS test is a good approach. He further makes a comparison between the Chi-square test and the KS test.
III. OBJECTIVE
The objectives of this work are to study the root causes behind equipment breakdown. Secondly, to develop a PM schedule based on the findings of the RCA analysis. Thirdly, to find out the cumulative distribution function governing the rate of failure and lastly to measure the reliability of the machine based on the model parameters.
IV. METHODOLOGY
At first, a Pareto analysis of machine downtime losses showed that equipment breakdown was the greatest contributor. To understand Equipment breakdown better, a RCA using the Why-Why technique was done with the help of machine operators and maintenance personnel. This was followed by the development of a PM schedule based on common industrial practices.
As for determining the cumulative distribution function governing the failure rate the weibull distribution was adopted as a model. The loading time was expressed in terms of minutes and
parameter) were estimated from the graph itself. The values of the distribution function were compared with the original cumulative failure rate to verify the correctness of the model using the Kolmogorov-Smirnovcriteria.
To measure the reliability of the machine using the weibull parameters β and ηo, the formula R(t) = exp[-(t/ηo)β]was used. The time period taken was the average loading time for a period of six months.
V. ANALYSIS & DISCUSSION
A. Downtime Analysis.
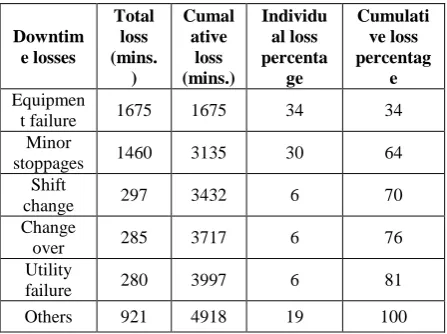
There are a total of fifteen major downtime losses which are recorded by the production department. In order to narrow down the study only to the important ones, the individual loss percentage and cumulative loss percentage were calculated. Downtime data is provided in details in Table II.
TABLE II: MACHINE DOWNTIME DATA
Pareto analysis of downtime losses in Fig. 1 gives a better picture of the situation. The various types of downtime losses are plotted along the primary horizontal axis. The individual loss in minutes is plotted along the primary vertical axis, while the cumulative loss percentage is plotted against the secondary vertical axis.
Downtim e losses
Total loss (mins.
)
Cumal ative loss (mins.)
Individu al loss percenta
ge
Cumulati ve loss percentag
e Equipmen
t failure 1675 1675 34 34
Minor
stoppages 1460 3135 30 64
Shift
change 297 3432 6 70
Change
over 285 3717 6 76
Utility
failure 280 3997 6 81
Fig.1: Pareto Analysis of Machine Downtime.
From the Pareto analysis the factors contributing roughly eighty percent towards downtime were found to beEquipment breakdown, Minor stoppages, Shift change, Change Over, Utility failure.Out of these five major losses equipment breakdown was further studied. Table III shows equipment breakdown in details.
TABLE III: EQUIPMENT BREAKDOWN DATA.
A second Pareto Analysis as in Fig. 2 was done so as to figure out the primary causes of equipment breakdown. Various causes related to equipment breakdown are plotted along the primary horizontal axis. The primary vertical axis shows loss in minutes and the secondary vertical gives the loss percentage.
Fig. 2: Pareto Analysis of Equipment Breakdown
Thus, from the Downtime analysis, the major equipment breakdown causes were found to be Vacuum pump failure , Photocell sensor failure, heater failure, Cutting failure, paper setting problem, batch cutting failure and the occurrence of leakage and wrinkle(fold marks) on the pouches. Vacuum pump, heater and photocell are essentially machine components while cutting failure, paper setting problem, batch cutting failure, leakage and wrinkle are undesirable effects caused during machine operation.
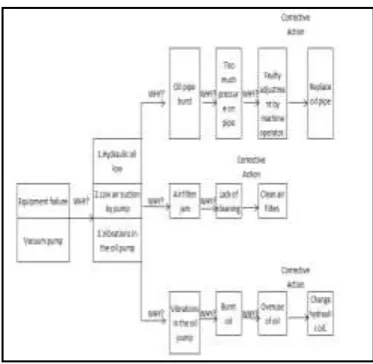
B. Root Cause Analysis.
Root Cause Analysis is a method to understand the actual reasons behind any undesirable effect, so as to address the problem at the grass root level. A typical example of RCA using the why-why technique in case of vacuum pump is shown Fig. 3.
Fig. 3: Why-Why Analysis Of Vacuum Pump failure.
34
64 70 76
81 100
0 20 40 60 80 100
0 500 1000 1500 2000
Types of downtime losses
25
42 52
62 68 73 77 81
100
0 20 40 60 80 100
0 2000 4000 6000 8000 10000 12000 14000
Types of equipment breakdown
Equipment breakdown
/ failure statement
Total loss (mins.
)
Cumulat ive loss (mins.)
Individu al loss percenta
ge
Cumul ative
loss percent
age Vacuum
pump
11695 11695 25 25
Photocell sensor
7460 19155 16 42
Heater 4910 24065 11 52
Cutting 4660 28725 10 62
Paper setting
2720 31445 6 68
Batch cutting
2195 33640 5 73
Leakage 2010 35650 4 77
Wrinkle 1655 37305 4 81
C. Preventive Maintenance Schedule.
Based on the RCA, PM checklists were prepared keeping in mind common industrial practices. Table IV gives an idea on the monthly PM schedule.
TABLE IV: MONTHLY PM CHECKLIST.
Activity
description Tools
Frequen
cy Time Std.
Lubrication of Join Bracket
Grease
gun/oil can Monthly 30 sec
10 gm/10
ml
Lubrication of motor wheel
sprocket bearing bolt
Grease
gun/oil can Monthly 30 sec
10 gm/10
ml
Lubrication of Pull Roller bolt
Grease
gun/oil can Monthly 30 sec
10 gm/10
ml
Lubrication of Guide shaft
bearing
Grease
gun/oil can Monthly 30 sec
10 gm/10
ml
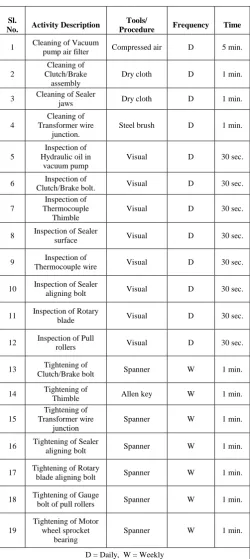
DailyPreventive maintenance activities like cleaning, inspection and tightening prove necessary in the long run. Activities like cleaning and tightening are normally assigned to be completed within one minute, while around thirty seconds are available for inspection activities. Cleaning is normally done with dry cloth since most of the machines have electrical components in them. Compressed air also provide a faster way of cleaning. Compressed air for cleaning do not require any special set up since most of the machines in the process industry have pneumatic cylinders in them which are operated through compressed air.The supply pipes for compressed air can be easily used for spraying purpose. Steel brushes are used while cleaning hard surfaces or electrical wires where carbon accumulation makes it almost impossible to be cleaned with cloth or air. Carbon accumulation causes heating of wires which ultimately lead to tearing. As for tightening Allen keys and
TABLE V: DAILY CUM WEEKLY PM CHECKLIST.
Sl.
No. Activity Description
Tools/
Procedure Frequency Time
1 Cleaning of Vacuum pump air filter Compressed air D 5 min.
2
Cleaning of Clutch/Brake
assembly
Dry cloth D 1 min.
3 Cleaning of Sealer
jaws Dry cloth D 1 min.
4
Cleaning of Transformer wire
junction.
Steel brush D 1 min.
5
Inspection of Hydraulic oil in
vacuum pump
Visual D 30 sec.
6 Inspection of
Clutch/Brake bolt. Visual D 30 sec.
7
Inspection of Thermocouple
Thimble
Visual D 30 sec.
8 Inspection of Sealer
surface Visual D 30 sec.
9 Inspection of
Thermocouple wire Visual D 30 sec.
10 Inspection of Sealer
aligning bolt Visual D 30 sec.
11 Inspection of Rotary
blade Visual D 30 sec.
12 Inspection of Pull
rollers Visual D 30 sec.
13 Tightening of
Clutch/Brake bolt Spanner W 1 min.
14 Tightening of Thimble Allen key W 1 min.
15
Tightening of Transformer wire
junction
Spanner W 1 min.
16 Tightening of Sealer
aligning bolt Spanner W 1 min.
17 Tightening of Rotary
blade aligning bolt Spanner W 1 min.
18 Tightening of Gauge
bolt of pull rollers Spanner W 1 min.
19
Tightening of Motor wheel sprocket
bearing
Spanner W 1 min.
Table VI below provides details about the preventive action.TABLE VI: PM & CM ACTION CHECKLIST.
D. Reliability Analysis.
1. The cumulative distribution function: The first step in reliability analysis is to find the distribution function governing the rate of failure.In order to better understand equipment failure, it is of utmost importance to know the CDF governing the rate of failure. This section attempts in finding out the CDF governing the failure rate of the machines. We first introduce the weibull distribution which defines a number of failures. Therefore, we use current data to obtain the specific distribution.
Weibull cumulative distribution function is shown below
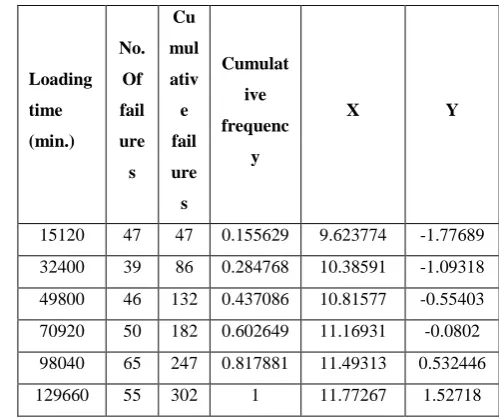
In which β and ηo must be determined, where β and ηo are the shape parameter and scale parameter respectively. To achieve a linear equation, we use log normal function twice. Now, the equation has the form lnln =βln(t)–βln(ηo) whichis also asimple linear equation Y = mX – A , Where, Y = lnln ; X = ln(t) and A = βln(ηo). To calculate the values of X and Y we use the failure data against loading time. Table VII shows loading time, the number of failures and the values of X and Y.
TABLE VII: CALCULATED X & Y FROM FAILURE DATA.
The points X and Y are plotted on graph as in Fig. 4.
Fig. 4: Relative Cumulative Function Graph.
y = 1.449x - 16.01 R² = 0.934 -3 -2 -1 0 1 2
0 5 10 15
ln {ln( 1 /( 1-F`( t) )} ln(t) Sl. N o. Failure
statement Causes
Correct ive action Preventive action 1 Vacuum pump oil pipe burst Too much pressure . Replace ment Pressure adjustment to be done slowly
2 Photocell sensor malfunctio ning Overhea t due to lengthy adjustm ent.
Allow photocel l to cool down for some
time.
Eye mark detection to be
done within one minute. 3 PLC malfunctio ning. Use of negative value(-) as input Installati on of new program s. Avoid Negative value as input.
4 Loose
Pouches. Low Sealing Pressure Pressure adjustm ent by stopping m/c.
Use of Carbon papers to estimate the pressure Before hand. 5 Leakage from pouches. Crack on sealer surface. Replace ment
Keep Sealers in cases. 6 Faulty batch cutting operation. Blade stuck in between the sealers. Re fitting of blade. Operational trial before m/c
running. 7 Wrinkle or fold marks on pouches. Jaw-nozzle touch during sealing. Alignin g of nozzle. Check nozzle alignment before m/c operation. . Loading time (min.) No. Of fail ure s Cu mul ativ e fail ure s Cumulat ive frequenc y
X Y
15120 47 47 0.155629 9.623774 -1.77689
32400 39 86 0.284768 10.38591 -1.09318
49800 46 132 0.437086 10.81577 -0.55403
70920 50 182 0.602649 11.16931 -0.0802
98040 65 247 0.817881 11.49313 0.532446
After plotting the values of X and Y, we get the equation y = 1.449x-16.01. This equation when compared with the standard linear equation gives us the values of β and ηo. Thus, we get β =16.01 and ηo= 62881. From the model the theoretical cumulative distribution function has the form:
2. The Goodness of fit test: Now we use a goodness of fit test so as to measure accuracy or closeness of our values with standard ones. We use the Kolmogorov-Smirnov test for evaluation. The maximum difference between F(t) and F`(t) is the measure of how good fit the model is. Table VIII shows the difference between actual and calculated values. The maximum difference between the values is denoted by:
Dn = max | F (t) − F `(t) |
TABLE VIII: DIFFERENCE BETWEEN ACTUAL &
CALCULATED CUMULATIVE FAILURE RATE.
Loadi ng
time (mins.
)
No. of fail ures
Cum ulati ve No.
Of failu res
Actu al cumu lative frequ
ency
Calcu lated cumul ative frequ ency
Absolut e differen
ce.
15120 47 47 0.155
629
0.1190
89 0.03654
32400 39 86 0.284
768 0.3179
0.03313 2
49800 46 132 0.437
086 0.5099
0.07281 4
70920 50 182 0.602
649 0.6959
0.09325 1
98040 65 247 0.817
881
0.8509 1
0.03302 9
12966
0 55 302 1 0.9424 0.0576
Therefore, Dn= 0.093251 at sample size, n = 182.
This difference, which is a random variable varies with the sample selected, this value is then
TABLE IX:
CRITICALVALUES, CV(α, n)OFTHEKSTESTWITHSAMP LESIZEnATDIFFERENTSIGNIFICANT LEVELS(α).
Sample
size,
(n)
Level of significance (α)
0.40 0.20 0.10 0.05 0.04 0.01
5 0.369 0.447 0.509 0.562 0.580 0.667
10 0.268 0.322 0.368 0.409 0.422 0.487
20 0.192 0.232 0.264 0.294 0.304 0.352
30 0.158 0.190 0.217 0.242 0.250 0.290
50 0.123 0.149 0.169 0.189 0.194 0.225
>50
For α = 0.05 and n > 50, from the above table; we have
=
In this case, n=182, so = 0.10081 and > = 0.093251).
Therefore, the Weibull distribution is verified. Thus the studied machines are in conformity with the weibull distribution for the mathematical failure model.
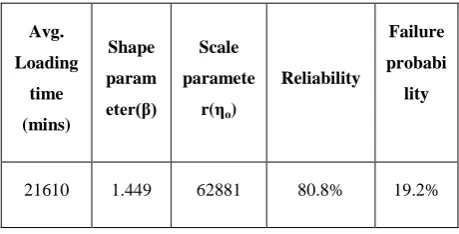
3. Reliability measurement using weibull parameters: Reliability using weibull parameters is given byR(t) = exp[-(t/ηo)β].Putting t = 21610 minutes, ηo = 62881 & β = 1.449, we get, R(t) = 0.80836 or 80.8%.
Table X summarises our model parameters along with the measured value of reliability.
TABLE X: Reliability and probability of failure.
Valueof
Shape
Parameter
Probable
Failure
Mechanism
Possible Cause
Of
Failure
β>2
Age Related Pattern
Accelerated wear & tear of
components
.
The value of the shape parameter β is of special importance, as it gives us an idea about the current state of machines. Table XI summarises machine condition for different values of β.
TABLE XI: CLASSIFICATIONOFSHAPEPARAMETER
From the model the value of the shape parameter β was found to be 1.449.
VI. CONCLUSION
In order to increase the uptime of any piece of equipment or machinery, a deep knowledge behind equipment breakdown is essential. A good number of our day to day products like liquids, semi-liquids and powder products in the form of pouches and sachets comes from the pouch machine. Like any other equipment this machine also is subjected to equipment breakdown during operational hours. Apart from causing production loss, equipment breakdown causes various other losses in the form of maintenance cost, overtime cost, defect, rework etc. A lot of factors contribute towards equipment breakdown. Root cause analysis using why-why technique was used in this regard to better explain the reasons behind breakdowns. Based on the root cause analysis, a new preventive maintenance checklist was prepared for the pouch machine.
Reliability of any equipment is a vital piece of information to the maintenance engineers. Thus, in order to measure reliability one must know the CDF governing the rate of failure. In this study, weibull distribution was adopted to explain the failure rate, later it was also verified through the KS test that the model can be represented by the selected distribution. The level of significance for the model was found to be 0.05. Reliability using the weibull parameters was found to be 80.8% for a mean operating time of 21610 minutes in normal operationg conditions. Thus for β value equal to 1.449, we can say that the machines are
subjected to a time independent failure and its causes are process error, design fault and maloperation.
The present condition of the machine can be improved if the proposed PM schedules are strictly followed This might help in improving the reliability
of the machines in the future.
ACKNOWLEDGEMENT.
I would like to acknowledge the support of EMAMI Ltd. Ghy, Amingaon Unit and all the faculty members of Mechanical Engineering Department, Jorhat Engineering College (Assam).
REFERENCES
[1] Wakjira, MelesseWorkneh.; Singh, Ajit Pal.; ‘Total Productive Maintenance: A Case Study in Manufacturing Industry’; Global Journal of researches in Industrial engineering Volume 12 Issue 1 Version 1.0 February 2012.
[2]Gupta, Amit Kumar.; Garg, R. K.;’OEE Improvement by TPM Implementation: A Case Study’; International Journal of IT, Engineering and Applied Sciences Research (IJIEASR); Vol. 1, No. 1, October 2012.
[3]Mirzai, M.;Gholami, A.; Aminifar, F.; ‘Failure Analysis and Reliability calculation for power transformers’; Journal of Electrical Systems, 2006.
[4]Wang, Hsiao-Mei.; ‘Comparison of the Goodness-of-Fit Tests: the Pearson Chi-square and Kolmogorov-Smirnov Tests’, Metering management journal’, Volume No. 06, 2009.
[5] Bose, D.; Ghosh, G.; Mandal, K.; Sau, S.P.; Kunar, S.; ‘Measurement & evaluation of Reliability, Availability & Maintainability of a Diesel Locomotive Engine’, International Journal of Scientific and Research Publications, Volume 3, Issue 9, September 2013.
[6] Goivil, A.K.; ‘Reliability Engineering’, Tata McGraw Hill Publishing company Ltd., (1983), pg : 44-51.
[7] M, Manoj. ; Mallesh, Dr.G.; ‘Breakdown and root cause analysis of critical machine- a case study’; International Journal of Advanced Technology in Engineering and Science; Volume No.02, Issue No. 07, July 2014.
[8] Rajput, Hemant Singh, Jayaswal, Pratesh.; ‘ A Total Productive Maintenance Approach to improve Overall Equipment efficiency’; International Journal of Modern Engineering Research (IJMER); Vol. 2, Issue-6, Nov-Dec, 2012. ISSN 2249-6645.
[9] Kumar, Praveen. ; Rudramurthy, R. ‘Analysis of Breakdowns and improvement of Preventive Maintenance on 1000 ton hydraulic press’; International Journal of Emerging Technology and advanced Engineering(IJETAE); Vol. 3 ; Issue 8; August, 2013.
[10] Hedge, Harsha G.; Mahesh, N.S.;Doss, Kishan .; ‘Overall Equipment Effectiveness improvement by TPM and 5S technique in a CNC machine shop’; SASTECH; Vol. 8; Issue 2; September, 2009, ISSN 2249-5924.
Avg.
Loading
time
(mins)
Shape
param
eter(β)
Scale
paramete
r(ηo)
Reliability
Failure
probabi
lity