Commonalities and Differences between Requirements
Engineering Tools: A Quantitative Approach
Juan M. Carrillo de Gea1, Joaqu´ın Nicol´as1, Jos´e L. Fern´andez-Alem´an1, Ambrosio Toval1, Christof Ebert2, and Aurora Vizca´ıno3
1
Software Engineering Research Group, University of Murcia, Murcia, Spain {jmcdg1,jnr,aleman,atoval}@um.es
2
Vector Consulting Services, Stuttgart, Germany [email protected]
3
Alarcos Research Group, University of Castilla-La Mancha, Ciudad Real, Spain [email protected]
Abstract. System and software developers are concerned to gain insight into how current requirements engineering (RE) tools support processes. There is an impor-tant number of RE tools currently available on the market but, unfortunately, exist-ing RE tool lists do not usually provide detailed and precise information about the tools they catalogue. In this paper, we study and compare current RE tools in the quest to answer the following research question:What level of variation, in terms of functionality, is observable in state-of-practice RE tools?A 188-item survey was designed, aimed at major tool vendors worldwide and based principally on the fea-tures covered by the ISO/IEC TR 24766:2009. Extensive data obtained from 29 participants was used to classify and group the RE tools, based on their capabilities. First of all, an inter-rater reliability analysis was performed to ensure the trustwor-thiness of the data. Descriptive statistics, hierarchical cluster analysis and statistical hypothesis testing were then applied. The tool scores for each candidate were cal-culated. A total of three clusters were identified. Statistically significant differences in coverage of features among these groups came to light. Our findings can help practitioners to decide which tool is the most suitable among several alternatives, according to their particular needs.
Keywords:clustering, requirements engineering, survey, tools.
1.
Introduction
deviations of their planning [30]. Furthermore, a survey carried out in 2007 found that changes in requirements and scope, chosen by 33% of the respondents, were primary rea-sons for project cancellation [19]. Inability to understand the technical meaning of the requirements, requirements’ vagueness, unavailability of domain experts and too strict timetables have been identified as RE-related issues responsible for project cancellation in projects in which there is a customer-supplier relationship and the supplier has sold a project to the customer [1].
People who take part in these highly-demanding, critical activities and tasks (i.e. project managers, requirements engineers and other stakeholders) need appropriate RE tool support to manage this complexity [25]. The role of automated tool support is to enable effective management of a single, integrated development process, since RE tools “provide capabilities for documenting requirements, managing their change, and integrat-ing them in different ways dependintegrat-ing on project needs” [41]. RE tools make it possible for there to be consistency and efficiency in managing requirements [9].
An additional consideration is that RE activities are even more difficult to manage when carried out in a global software development (GSD) environment, where there is a paradigm shift towards globally distributed development teams [13, 26]. The relevance of globalisation cannot be neglected nowadays, and it also influences software develop-ment [45, 50]. The GSD phenomenon began in the early 1990s but the facts about the software business have made clear that it has become a popular, powerful competitive strategy over the past 15 years [26, 43, 45, 46, 50]. The organizational structure and de-velopment processes required to support this kind of dede-velopment are different from the ones used in co-located environments [45]. In this regard, tools “certainly help in man-aging requirements in a global context” [17]. According to Ebert [17], a professional RE tool with successful capabilities to store and organise requirements, as well as to manage changes and traceability, is recommended for projects that are scattered between two or more locations. It is also advisable for GSD projects involving large teams.
As stated by Reel [47] the success of a software project depends on the availability of good, proven tools from stable companies. There are many RE tools currently available on the market —a sample of them is shown in this paper. Unfortunately, existing RE tool lists do not usually provide enough detailed and precise information about the tools they catalogue. Furthermore, tool vendors normally offer information about their tools as a list of features or in any other form, but this information is dispersed, unorganised, unclear and not standardised. This lack of accumulated, accurate and systematised information about RE tools hinders decision-making.
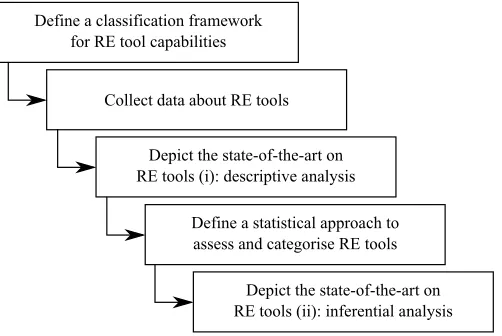
In this matter, “going first-class does not necessarily mean spending the most money” and it is recommendable to “shop carefully, review a lot of options, and involve the entire team in the decision” [47]. Hence, given that the choice of an RE tool “is an important and sensitive issue” [27], the goal of this paper is to provide a comparative framework and procedure, illustrated by a quantitative evaluation of the particularities of commercial RE tools which are currently on the market. This approach allows us to classify tools into coherent groups, according to their attributes or features, and formally evaluate their commonalities and differences. In summary, Figure 1 presents the steps taken during this research work.
Define a classification framework for RE tool capabilities
Collect data about RE tools
Depict the state-of-the-art on RE tools (i): descriptive analysis
Define a statistical approach to assess and categorise RE tools
Depict the state-of-the-art on RE tools (ii): inferential analysis
Fig. 1.Flow diagram summarising the steps of this research work
to see at a glance what is within and beyond the scope of the study. Secondly, a sur-vey among RE tool vendors was carried out and the data gathered by this means was validated by performing an inter-rater reliability analysis. Thirdly, the RE tools were de-picted from a descriptive point of view, using the data collected in the previous step. In fourth place, a procedure for categorising and assessing RE tools was proposed, which includes a statistically-coherent grouping process, namely a hierarchical cluster analysis, followed by the formulation of the research goals and hypotheses of the study to perform an inferential analysis. Lastly, the clustering technique was applied, aiming to highlight commonalities and differences between RE tools, and statistical hypothesis testing was performed to check formally whether the diversity of scores achieved by each cluster is definitely noteworthy or not. This gave an insight into the real differences between the groups obtained from the clustering step. We believe that such an assessment might be helpful both to RE practitioners and RE tool developers. According to White [53], the reason for empirical work in SE is the need for verification of results. Furthermore, ex-perimental results that seem to be compelling are often not statistically significant, hence a statistical analysis is needed to demonstrate statistical significance of the results [53].
All aspects of the issue mentioned in the last paragraph can be summarised in the fol-lowing research question:
RQ1:What level of variation, in terms of functionality, is observable in state-of-practice RE tools?
addi-REmtoolmcapabilitiesmusersmcanmexpect inmordermtomsupportmanmREmprocessmand
othermrelatedmlifemcyclemactivities Price
Softwaremquality attributes
Post-salemservice
Supportmandmtraining Integrationmwith
othermtools
Technicalmknowledge requiredmformdeployment Documentation
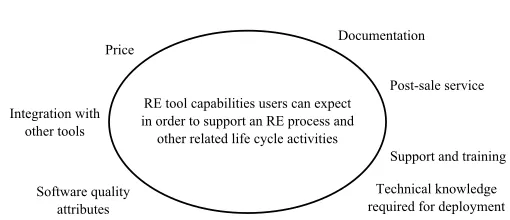
Fig. 2.Issues falling within and beyond the scope of the study
tion to the result of the data analysis itself—, which can be applied periodically to updated data. This practical formally-based approach relies on rigorous statistical foundations to enable us to portray RE tools in great depth, their commonalities and differences, as well as to derive significant conclusions. Moreover, a unified classification framework is also supplied that includes a new category of features —namely, requirements collaboration and GSD.
The structure of this paper is as follows: Section 2 briefly presents our classification framework for RE tool capabilities. Section 3 reports on the survey and data collection procedures. Section 4 presents the results of the descriptive analysis of the data. Section 5 illustrates the method applied to group the RE tools participating in this study, according to their commonalities and differences, and lays the foundations for the subsequent in-ferential analysis of the data. Section 6 shows the outcome of the clustering process and emphasises the categories of features that differ between the groups of tools previously identified, also discussing their comparative coverage of features. Section 7 shows the limitations of this study. Finally, Section 8 highlights our conclusions and sets out future work.
2.
Classification framework
The international guideline ISO/IEC TR 24766:2009 [31] was adopted as the basis of our classification framework for assessing RE tools. It is appropriate and useful for this purpose, since the list of required capabilities that it contains can be used for evaluating and choosing an RE tool. Furthermore, it is backed up by an important standardisation organisation and, to the best of our knowledge, it is the most formal document available in relation to this subject. This guideline is aType 2 Technical Report (TR), which means that there is a future possibility of an agreement on anInternational Standard.
The RE tool capabilities under study belong to one of the categories of features set out below:
1. Elicitation. This category includes features focusing on the ability of the tools to support in the identification of stakeholders, as well as in the capturing and tracing of business/user requirements, non-functional requirements, and functional require-ments during elicitation work.
conflicts. It also determines where there may be unclear, incomplete, ambiguous or contradictory requirements and resolves all these issues.
3. Specification. This category encompasses features that focus on documenting the functions that a software or system must provide, along with the constraints that it must respect. These functions and constraints must be specified in a consistent, ac-cessible and reviewable manner to accomplish that goal.
4. Modelling. This category includes features focusing on the application of certain techniques to produce useful and verifiable requirements models.
5. Verification and validation (V&V). This category includes capabilities aimed at giving support to the various tests and means of evaluation in verifying and validating the requirements.
6. Management. This category explores the ability of the tools to support the monitor-ing of the changes and the maintenance of the requirements, thus ensurmonitor-ing that the requirements accurately reflect the product.
7. Traceability. This category includes capabilities which focus on documenting the life of a requirement, providing linkage mechanisms between associated requirements, and tracking changes made to each requirement.
8. Collaboration and global software development (GSD). This category is made up of features on decision methods, requirements review and inspection, collaborative access, control and coordination, loss of communication mitigation, avoidance of misunderstandings and misconceptions, and fostering of mutual trust.
9. Other tool capabilities. This category takes in features related to the integration of the tool into the system and software development environment.
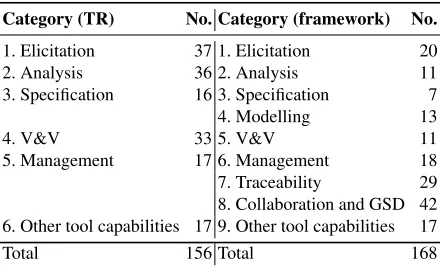
A comparison between the number of capabilities falling within each category of fea-tures in the ISO/IEC TR 24766 and in our classification framework is provided in Table 1. Note that the categories of features stated in the technical report were maintained in our classification framework, but new categories of features —modelling,traceabilityand col-laboration and GSD— were also added. Moreover, the ISO/IEC TR 24766 includes 156 features, but some of these were aggregated (9 features into 4), disaggregated (3 features into 12) and even excluded (37 features). At the same time, 45 new features inspired by the scientific literature (e.g. see L´opez et al [38]) and/or based on our own experience were added, obtaining an eventual total of 168 features in our classification framework.
These new features were included according to several subjects, namely: importing and exporting to and from other sources, modelling and specification languages, V&V, open data model, traceability, control and coordination, loss of communication, misun-derstandings and misconceptions, mutual trust and data integration. Most of the newly added capabilities lie in the collaboration and GSD category, since as mentioned above, it is not present in the ISO/IEC TR 24766 and thus had to be populated. The features concerning traceability are fairly spread out throughout the whole document; some of them are redundant and appear several times. They thus represent most of the excluded capabilities as we tried to consolidate duplicates.
framework comprises a wide range of characteristics aimed at giving support to the entire RE process, while its size still remains manageable.
Although our classification framework is strongly based on the ISO/IEC TR 24766, both the newly-defined categories of features and the new features themselves allowed us to tailor our classification framework to our needs more closely. It also helped to re-flect present and relevant issues that are in harmony with our point of view. On the one hand, the lack of modelling features in the ISO/IEC TR 24766, despite the importance of such concerns, led us to complete our classification framework with new capabilities in requirements modelling. In addition, since the technical report pays little attention to the GSD paradigm, references from the scientific literature were consulted so that relevant features for RE tools in GSD settings could be gathered for assessment. On the other hand, there are a lot of features to do with traceability in the ISO/IEC TR 24766 that were col-lected and organised in a specific category. In our opinion, the newly-defined categories of features endow our classification framework with better order and understandability.
In summary: (1) the ISO/IEC TR 24766 was useful and important as the baseline for our classification framework; (2) our classification framework (and therefore our ques-tionnaire) was improved with the use of the newly-defined set of categories of features, rearranging some features and deleting others; and (3) our classification framework ben-efited from the inclusion of certain new capabilities inspired by the industrial experience of the authors that were not originally considered in the ISO/IEC TR 24766.
3.
Data collection
We followed the DESMET [32] evaluation method in this study, which was designed to assess software engineering methods and tools. According to DESMET, evaluation exercises can be classified in two types: (1)quantitativeorobjectiveevaluations aimed at establishing measurable effects of using a tool; and (2)feature analysis,qualitativeor subjectiveevaluations aimed at establishing tool appropriateness. The first type is based on identifying the benefits a new tool is expected to deliver in measurable terms and collecting data to determine whether the expected benefits are actually delivered. The second type is based on identifying the requirements that users have for a particular task or activity and mapping them onto the features that a tool aimed at supporting that task or activity should possess. At this point, evaluators assess the level of provision of the identified features by a number of alternative tools based on personal opinion.
Starting from the set of tool capabilities already identified and selected (see Section 2), a qualitative method can be naturally applied. Following the DESMET terminology, a qualitative survey is a feature-based evaluation carried out by people who have experi-ence in using or have studied the tools of interest. In order to apply this type of evaluation, the capabilities included in the classification framework were directly mapped into ques-tions of a questionnaire, and a web-based survey was carried out to collect information from vendors, who acted as assessors. The process was implemented by using the open source survey applicationLimeSurvey4. Two key advantages were obtained through this approach: (1) the most qualified expert in any tool should, in principle, be its own vendor, and this knowledge is required for carrying out a good evaluation; and (2) it allowed us to
4
Table 1.Number of capabilities
Category (TR) No. Category (framework) No.
1. Elicitation 37 1. Elicitation 20
2. Analysis 36 2. Analysis 11
3. Specification 16 3. Specification 7
4. Modelling 13
4. V&V 33 5. V&V 11
5. Management 17 6. Management 18
7. Traceability 29 8. Collaboration and GSD 42 6. Other tool capabilities 17 9. Other tool capabilities 17
Total 156 Total 168
study many more tools, which greatly increases the relevance of the results; the classifi-cation framework is large and the effort to get to know every tool at acceptable level and evaluate them would be otherwise unattainable.
The questionnaire was designed and prepared between September and November, 2010. A total of 168 enquiries constitute the technical part of the survey since, as men-tioned earlier, the number of features in the classification framework directly corresponds to the number of effective technical questions in the questionnaire (i.e. each question of a technical nature in the questionnaire is exactly related to a certain feature in the classifi-cation framework, and therefore belongs to a certain category of features). Moreover, the categories of features are arranged into subcategories, in order to get better order and clar-ity. For example, the question “The RE tool supports decision methods as follows: Storing and managing the list of conflicting requirements” is included in the category “Collabo-ration and GSD”, subcategory “Decision methods”; the question “The RE tool supports requirements capture by allowing the user to: Store and manage the documentation for interviews, workshops, and observation” is included in the category “Elicitation”, subcat-egory “Requirements capture”. There were four possible replies to each question: “Yes”, “No”, “I don’t know” and “No answer”. The design of the questionnaire, populated by atomised and dichotomous questions, made unnecessary to include a “Partially” answer. There was also an additional set of 20 questions in the questionnaire regarding the basic demographic information about the tools (e.g. tool name, vendor name, current version). Hence, the total number of enquiries was 188.
For the sake of space, the fully-detailed list of explored capabilities is not shown in this paper. However, our RE tool survey is publicly available on a website5. It must be remembered that previous work on the part of the classification framework and the survey related to general RE tool capabilities —i.e. leaving out requirements collaboration and GSD— was already carried out, and can be consulted for further information [9, 10].
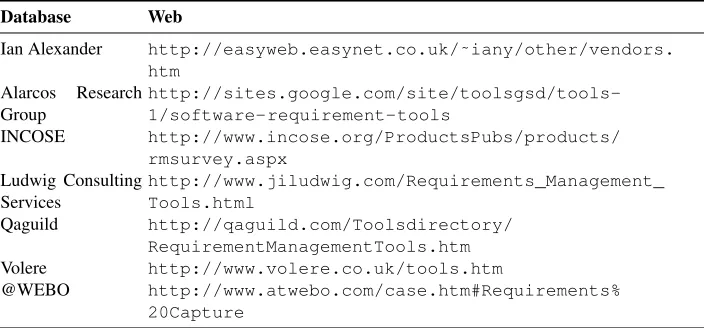
The databases of RE tool lists which were consulted in selecting the set of candidates to participate in the study are shown in Table 2. At this point, it must be emphasised that the definition of RE tool followed throughout this paper is implicitly determined by these sources. In other words, these sources set out what is meant by “RE tool” in the scope
5
of this study, according to the kind of tools they list. This leads to a wide definition of RE tool, so that if a tool can be used to provide dedicated support to any activity of the RE process, then it can be considered and assessed through the approach proposed in this paper. A tool does not necessarily have to cover all the activities of the RE process to be considered an RE tool. Our approach is therefore compatible with this idea, given that an individual score is calculated for each category of features, as will be shown later.
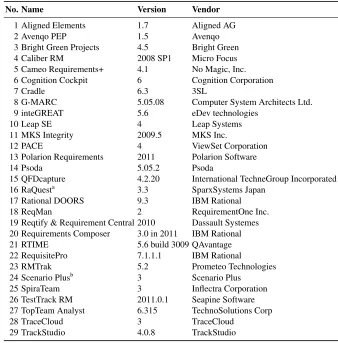
Data were gathered between December, 2010 and February, 2011. The questionnaire was answered by 38 out of 94 candidates, initially. However, the tool representatives had the option of not filling in the questions if it was the case that they did not know the an-swer (“I don’t know”) or for any non-specified reason (“No anan-swer”) when anan-swering the questionnaire. This situation might lead to survey results being called into question when the number of unanswered enquiries is too high. To minimize this potential problem, if the tool representative answered at least 50% of the questions of each set which represents the whole set of features corresponding to a concrete category, then the tool is considered as a participant. If this does not occur, the tool is not considered as a participant and the questions answered (if any) within the category are discarded. As a result, the number of participants in each category of features may vary accordingly. Nevertheless, missing data are not allowed for the advanced analysis technique applied later on (see Section 5), and so the absence of any data led us to reject additional cases. This meant that only 25 participants were valid cases. However, the incomplete answers of 4 vendors were filled in by ourselves. We did this to be able to study these tools (see Section 3.1), given the special importance of the participants in question (T4,T17,T20andT22). Eventually, 29 tools were included in this study (see Table 3).
3.1. Data validation
Given that most of the tool data were not directly gathered by the authors, a data validation process was performed to verify and ensure their truthfulness, correctness and acceptabil-ity. We aim to mitigate the threats to the internal validity of the study through this data validation process (for more information, see also Section 7).
The answers of 9 out of 29 participants (31.03%) were directly evaluated by our-selves, as explained below. During this process, we had access to full-featured, evaluation installations of these tools and we also relied on their documentation.
The answers concerning 4 tools out of 29 participants (13.79%) were incomplete. We critically examined their accuracy and also filled in the missing information so as to be able to include the tools in our study. The representativity of our sample was benefited from this deviation of the protocol, given the relevance and widespread adoption of these major tools (see Section 3). Moreover, the validity of these data can be taken for granted, as there is no conflict of interest and the information we provide is free of subjectivity biases.
Table 2.Databases hosting RE tools lists
Database Web
Ian Alexander http://easyweb.easynet.co.uk/˜iany/other/vendors. htm
Alarcos Research Group
http://sites.google.com/site/toolsgsd/tools-1/software-requirement-tools
INCOSE http://www.incose.org/ProductsPubs/products/ rmsurvey.aspx
Ludwig Consulting Services
http://www.jiludwig.com/Requirements_Management_ Tools.html
Qaguild http://qaguild.com/Toolsdirectory/ RequirementManagementTools.htm
Volere http://www.volere.co.uk/tools.htm
@WEBO http://www.atwebo.com/case.htm#Requirements%
20Capture
data. The procedure was performed by using Analyse-it6 version 2.26 for Microsoft Ex-cel72010.
Inter-rater agreement is commonly used to evaluate the agreement between differ-ent classifications, which might include nominal or ordinal scales. In particular, Cohen’s Kappa coefficient [14] makes it possible to calculate such agreement between two ob-servers on the assignment of classes of a categorical variable, although it does not take into account the degree of disagreement between observations. Since we start from or-dered codes (very high,high,medium,lowandvery low) and Weighted Kappa [15] allows different levels of agreement to contribute to the value of Kappa when the categories are ordered (i.e. when the variable is ordinal), this method was applied in the end. In addi-tion, quadratic weights were chosen instead of linear weights, as the difference between the first and second category is less important than the difference between the second and third category, etc. The inter-rater reliability for the two observers —vendors and researchers— was found to be Kappa = 0.72, SE = 0.16, 95% CI (0.4, 1). The strength of agreement is thereforesubstantial[34] orgood[3], which points to the fact that the data obtained seem to be trustworthy.
We raised the level of confidence of the evaluation coming from the researchers by using the triangulation technique [7] in the cross-check, to ensure that the data collected enable us to draw valid conclusions. We applied investigator triangulation as follows: three external assessors tested the tools (one assessor was assigned to each tool), three authors supervised their evaluation work, and another three authors reviewed the findings. Finally, a comparison was made, to ensure similar conclusions.
6http://www.analyse-it.com/ 7
Table 3.Participants
No. Name Version Vendor
1 Aligned Elements 1.7 Aligned AG
2 Avenqo PEP 1.5 Avenqo
3 Bright Green Projects 4.5 Bright Green
4 Caliber RM 2008 SP1 Micro Focus
5 Cameo Requirements+ 4.1 No Magic, Inc. 6 Cognition Cockpit 6 Cognition Corporation
7 Cradle 6.3 3SL
8 G-MARC 5.05.08 Computer System Architects Ltd.
9 inteGREAT 5.6 eDev technologies
10 Leap SE 4 Leap Systems
11 MKS Integrity 2009.5 MKS Inc.
12 PACE 4 ViewSet Corporation
13 Polarion Requirements 2011 Polarion Software
14 Psoda 5.05.2 Psoda
15 QFDcapture 4.2.20 International TechneGroup Incorporated
16 RaQuesta 3.3 SparxSystems Japan
17 Rational DOORS 9.3 IBM Rational
18 ReqMan 2 RequirementOne Inc.
19 Reqtify & Requirement Central 2010 Dassault Systemes 20 Requirements Composer 3.0 in 2011 IBM Rational
21 RTIME 5.6 build 3009 QAvantage
22 RequisitePro 7.1.1.1 IBM Rational
23 RMTrak 5.2 Prometeo Technologies
24 Scenario Plusb 3 Scenario Plus
25 SpiraTeam 3 Inflectra Corporation
26 TestTrack RM 2011.0.1 Seapine Software 27 TopTeam Analyst 6.315 TechnoSolutions Corp
28 TraceCloud 3 TraceCloud
29 TrackStudio 4.0.8 TrackStudio
aRequires Enterprise Architect b
Requires Rational DOORS
4.
Descriptive analysis
As shown previously, the features of the classification framework and the correspond-ing questions in the survey are grouped into categories of features. For each category of featuresc, participation of the tooltin the categorycis determined as follows:
participant(t, c) =
true, N A(t, c)≥N Q(c)/2;
false,otherwise.
score(t, c) =
PN Q(c)
q=1 score(t, q) N Q(c)
score(t, q) ∈ {0,1} is the score of the tool t in the questionq. After this, s =
score(t, c) ∈ [0,1]is discretised on a 5-interval scale using a global unsupervised dis-cretisation method [16], a variation of the equal width interval binning in which the lower and upper bins are shorter than the others, the intention being to discriminate extreme scores:
discretisation(s) =
Very low, s∈[0,0.125];
Low, s∈(0.125,0.375];
Medium, s∈(0.375,0.625];
High, s∈(0.625,0.875];
Very high, s∈(0.875,1].
A total of nine variables were studied, one for each category of features (see Sec-tion 2):elicitation(20 items),analysis(11 items),specification(7 items),modelling(13 items),V&V (11 items),management (18 items),traceability(29 items),collaboration and GSD(42 items), andother tool capabilities(17 items). The scores of the tools can be represented by means of 9-tuples, ordered lists of values that codify the scores achieved in each category of features —e.g. the scores of the tool number 1 (T1) are (0.8, 1, 0.86, 0.92, 1, 0.56, 0.79, 0.4, 0.29)—. All the individual scores of each tool are shown in Ta-ble 4. Furthermore, the raw data including the vendors’ answers to each single question are available on the website8, thus guaranteeing the reproducibility of our research.
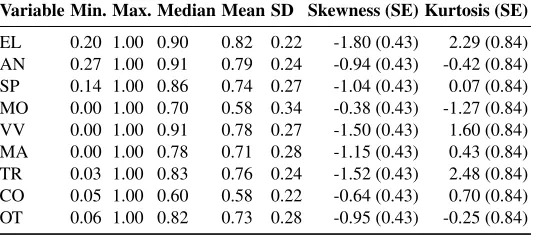
Summary statistics are presented in Table 5 to describe the variables of the study. The arithmetic mean (a measure of central tendency), the standard deviation (a measure of dispersion), and the skewness (a measure of the shape of the distribution) are included, among other statistics.
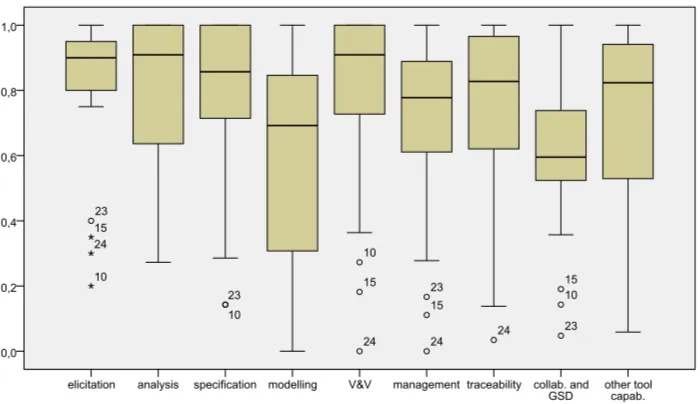
Figure 3 depicts the variables selected from a descriptive point of view. The boxplot, as a method of graphic display concerned with the data’s symmetry and skewness, provides us with numeric measures of central tendency, location and spread of the variables [44].
Most tools achieve broad coverage of features inelicitation,analysisandV&V fea-tures (the median of their scores isvery high), which therefore seem to be better covered than in the case of the other variables, as shown in Figure 3. In this sense, the variables specification,modelling,management,traceabilityandother tool capabilitiesrepresent a second step, since the median of their scores ishigh. These variables present a comparable situation characterized mostly by a span of observations. It should be noted, though, that while the tool coverage of features in themodellingfeatures is lower than in the case of the other variables, its standard deviation is the highest. This situation leads to the lowest mean value for this variable, together with the collaboration and GSDvariable. More-over, the median of the distribution is lower (medium) incollaboration and GSDfeatures than in the other variables, meaning that these capabilities are not yet common in the RE tool market. We deduce from this that current RE tools are more oriented towards collab-orative, distributed work, than to globally distributed development; the focus of the tools on GSD is still in an incipient stage. Some cases withinelicitation,specification,V&V,
8
Table 4.Tool scores. EL: elicitation. AN: analysis. SP: specification. MO: modelling. VV: V&V. MA: management. TR: traceability. CO: collaboration and GSD, OT: other tool capabilities
Tool EL AN SP MO VV MA TR CO OT
T1 (0.80, 1.00, 0.86, 0.92, 1.00, 0.56, 0.79, 0.40, 0.29) T2 (0.90, 0.91, 0.86, 0.08, 0.82, 0.61, 0.97, 0.55, 0.47) T3 (0.90, 0.91, 0.86, 0.92, 0.55, 0.78, 0.72, 0.74, 0.82) T4 (0.95, 0.91, 0.86, 0.31, 0.73, 0.94, 0.83, 0.62, 1.00) T5 (0.90, 0.64, 0.57, 0.46, 0.73, 0.28, 0.59, 0.36, 0.53) T6 (1.00, 0.91, 1.00, 1.00, 1.00, 0.94, 1.00, 0.93, 0.94) T7 (1.00, 1.00, 1.00, 1.00, 1.00, 0.89, 1.00, 0.81, 1.00) T8 (0.95, 1.00, 1.00, 0.85, 1.00, 0.78, 1.00, 0.60, 0.76) T9 (0.95, 0.82, 1.00, 0.92, 0.91, 0.72, 1.00, 0.57, 0.88) T10 (0.20, 0.36, 0.14, 0.31, 0.27, 0.39, 0.55, 0.14, 0.41) T11 (1.00, 1.00, 1.00, 0.54, 0.91, 1.00, 0.86, 0.62, 0.94) T12 (0.95, 1.00, 1.00, 1.00, 1.00, 1.00, 0.79, 1.00, 1.00) T13 (1.00, 1.00, 0.71, 0.85, 0.91, 1.00, 0.97, 0.74, 0.88) T14 (0.90, 0.91, 0.71, 0.77, 0.91, 0.89, 0.83, 0.71, 0.88) T15 (0.35, 0.45, 0.43, 0.08, 0.18, 0.11, 0.14, 0.19, 0.29) T16 (0.75, 0.55, 0.71, 0.85, 0.36, 0.72, 0.72, 0.36, 0.59) T17 (1.00, 1.00, 1.00, 0.69, 0.91, 1.00, 0.97, 0.67, 1.00) T18 (0.95, 0.91, 0.71, 0.69, 1.00, 0.78, 0.86, 0.79, 0.82) T19 (1.00, 1.00, 0.86, 1.00, 1.00, 0.89, 1.00, 0.52, 0.94) T20 (0.95, 0.91, 0.86, 0.69, 1.00, 0.89, 0.86, 0.76, 1.00) T21 (0.90, 0.64, 0.71, 0.62, 0.91, 0.72, 0.72, 0.52, 0.76) T22 (0.80, 0.82, 0.86, 0.23, 0.91, 0.89, 0.76, 0.74, 1.00) T23 (0.40, 0.27, 0.14, 0.00, 0.73, 0.17, 0.59, 0.05, 0.18) T24 (0.30, 0.27, 0.29, 0.15, 0.00, 0.00, 0.03, 0.52, 0.06) T25 (0.90, 0.55, 0.43, 0.00, 0.73, 0.44, 0.62, 0.50, 0.88) T26 (0.80, 1.00, 0.71, 0.31, 0.73, 0.72, 0.62, 0.64, 0.76) T27 (0.85, 0.55, 0.86, 0.69, 0.55, 0.89, 0.97, 0.64, 0.65) T28 (0.75, 0.64, 1.00, 0.69, 1.00, 0.94, 0.86, 0.57, 0.94) T29 (0.80, 1.00, 0.29, 0.23, 0.82, 0.61, 0.45, 0.60, 0.41)
Table 5.Descriptive statistics. EL: elicitation, AN: analysis, SP: specification, MO: modelling, VV: V&V, MA: management, TR: traceability, CO: collaboration and GSD, OT: other tool capabilities, SD: std. deviation, SE: std. error
Variable Min. Max. Median Mean SD Skewness (SE) Kurtosis (SE)
other tool capab. collab. and
GSD traceability management V&V
modelling specification analysis
elicitation 1,0
0,8
0,6
0,4
0,2
0,0
15 24
10 15
10
23 24
23 15
24 10
15
24 10
23 23
Fig. 3.Distribution of capability scores
management,traceabilityandcollaboration and GSDare outliers which represent tools that have achieved low scores in these variables. This reflects that some elements deviate from the norm in the sample of tools taking part in this study.
An interesting topic addressed in the survey was requirements interchange formats. Since companies rarely work on the same requirements repository and do not usually work with the same RE tools [42], a standard format for requirements information is needed. ReqIF [42] is an emerging OMG exchange format that is intended to be generic, open and non-proprietary; all this is a successful step towards bridging the gap. It allows dif-ferent companies to exchange requirements information across organizational boundaries without losing the advantages of managing requirements internally. All of this ensures consistency, reduces defects, speeds up information exchange, enables collaboration and lowers costs [18, 39]. ReqIF is said to be fulfilled by 31.03% of the survey respondents. In contrast, a percentage of 55.17% does not cover this aspect. Moreover, three answers were “I don’t know” (10.34%) and one was “No answer” (3.45%).
4.1. Open answers
Some respondents left valuable feedback when filling in the questionnaire, both from the point of view of their own tools and our classification framework.
UML modeling tool Enterprise Architect, which is the essential tool for RaQuest, provides its capabilities to the functionality of the tool.
The respondent from PACE claimed that the tool is one of the few web-based tools that supports the storage and display of embedded —rather than simply attached— diagrams and graphics over the Web. According to this PACE representative, this ability combined with the PACE support of UNICODE, grants a unique flexibility in being able to load, manage and display virtually any model and language. This respondent from PACE also affirmed that the tool was designed using open standards in a 3-tier architecture, which permits a great level of openness, flexibility and scriptability without sacrificing secu-rity. Moreover, the tool architecture gives PACE immediate data integration support with thousands of applications, services and systems out-of-the-box.
The person replying on behalf of Reqtify asserted that the tool has the ability to con-nect with other RE tools such as Caliber RM, Cradle, MKS Integrity, Rational DOORS, RequisitePro, etc. The respondent from Reqtify also reported that all the topics which are related more to collaborative project management than to RE are covered by other Das-sault Systemes products like ENOVIA Program Central, Knowledgeware Central and all the standard collaborative features offered by the ENOVIA PLM platform.
As regards the feedback on our classification framework, the person giving answers on behalf of G-MARC highlighted that it does not reflect the need to ensure objectivity in requirements expression by conducting natural language semantic analysis, in addition to grammatical and morphological analysis. He/she pointed out, however, that all these demands have already been met in G-MARC. Moreover, he/she argued that just because the RE tool is able to support the monitoring of the changes and the maintenance of the re-quirements, it is by no means a foregone conclusion that the requirements will accurately reflect the product. In this sense, the respondent from G-MARC expressed that there is no mention in our classification framework of the hugely important need for management to be able to acquire knowledge from each application and make such knowledge available to allied projects. Nor was it clear how experience could be abstracted for use in systems or system activities in an effort to reduce development costs progressively by means of the ability to reuse generic knowledge —again, he/she affirmed that G-MARC do indeed address these issues. The person replying on behalf of G-MARC also commented that the features included in ourcollaboration and GSDcategory of features are related more to project management than to RE.
5.
Statistical approach
In this section, a formal approach to assess and categorise RE tools that makes use of statistical techniques is proposed. Firstly, the research goals are defined. Secondly, the process for grouping the tools is presented. Finally, the hypotheses of the experiment that aims at finding the answer toRQ1are formulated.
5.1. Research goals
instrument: it provides only an obvious sorting of tools; insight into existing relations between tools cannot be gained, a large amount of isolated data coming from each cat-egory of features is to be interpreted as a whole, etc. Multivariate analysis techniques, which involve observation and analysis of more than one statistical variable at a time [37], would allow us to address all the variables of the study jointly, in order to perform a better comparison between the tools. Techniques commonly used in this type of analysis include cluster analysis, which is the name given to a collection of algorithms employed to classify objects.
Experimentation in SE is needed if we are to achieve credible knowledge [6]. With regard to experimentation in RE, Akkermans and Gordij [2] state thatevaluationand val-idationare relevant aspects of scientific research which might use both quantitative and qualitative research methods. In this context, evaluation refers to “the study of the proper-ties of an RE problem or solution in practice”, whereas validation alludes to “the study of solution proposals [. . . ] that have not (yet) been implemented or tested in field practice”. Once a cluster analysis is finished, parametric or non-parametric tests can be carried out to determine in which classifying variables significant differences between these groups can be found [8]. In other words, at this point it is useful to gain insight into the differ-ences between the groups obtained from the clustering step, since it helps establish what each cluster is based on and allows us to draw relevant conclusions. Statistical hypothesis testing provides a means of checking formally whether the diversity of scores achieved by each cluster is definitely noteworthy or not. In this study, we followed the practical guidelines for statistical tests set out in [4].
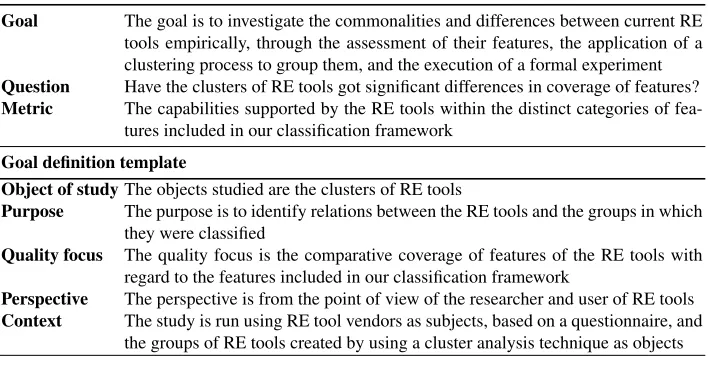
The research goals can be outlined using the goal/question metric (GQM) framework [5]. The GQM template [6] of the experiment is shown in Table 6.
5.2. Cluster analysis
Clustering deals withmobjects that are described bynfeatures [23]. The main concern in the clustering process is to discover interesting data distributions and patterns in the underlying data which would allow us to highlight similarities and differences, as well as to derive useful conclusions about these [24]. Furthermore, the classification aims to reduce the dimensionality of a given dataset by exploiting the similarities and dissimilari-ties between cases. The outcome of the cluster analysis is a set of clusters, such that cases within one of these are more similar to each other than they are to cases in other clusters. It is thus useful for classifying large amounts of information into manageable, meaningful piles, or for discovering similarities between objects.
A statistically-coherent grouping process with the RE tools can be carried out by means of this data mining technique. In this study, the statistical software package IBM SPSS Statistics9 version 20 was used to analyse the collected data and generate the fig-ures. IBM SPSS offers three different procedures for clustering data [40]: (1) hierarchical cluster analysis, which is appropriate for easily examining solutions with an increased number of clusters, and when the data set is small; (2) k-means clustering, useful when the number of clusters is known and the data set is of a moderate size; and finally (3) two-step cluster, appropriate if the data set is large, or there is a mixture of continuous
9http://www-01.ibm.com/software/analytics/spss/products/
Table 6.Goal/Question Metric template
Goal The goal is to investigate the commonalities and differences between current RE tools empirically, through the assessment of their features, the application of a clustering process to group them, and the execution of a formal experiment Question Have the clusters of RE tools got significant differences in coverage of features? Metric The capabilities supported by the RE tools within the distinct categories of
fea-tures included in our classification framework Goal definition template
Object of studyThe objects studied are the clusters of RE tools
Purpose The purpose is to identify relations between the RE tools and the groups in which they were classified
Quality focus The quality focus is the comparative coverage of features of the RE tools with regard to the features included in our classification framework
Perspective The perspective is from the point of view of the researcher and user of RE tools Context The study is run using RE tool vendors as subjects, based on a questionnaire, and
the groups of RE tools created by using a cluster analysis technique as objects
and categorical variables. The chosen option was (1), since our data set is small and the number of clusters is, in principle, unknown.
Hierarchical clustering algorithms, depending on the specific method that produces clusters, can be either agglomerative or divisive [24, 40]. On the one hand, agglomerative algorithms begin with every case being a cluster by itself, and at successive steps they pro-duce a sequence of clustering schemes in a decreasing number of clusters. The clustering scheme produced at each step results from the previous one by merging the two closest clusters into one. The algorithm ends with each case belonging to one single cluster. On the other hand, divisive algorithms start with each case in one single cluster and end with each of the cases assigned to respective individual clusters. These algorithms produce a sequence of clustering schemes of an increasing number of clusters at each step. In con-trast to the agglomerative algorithms, the clustering produced at each step results from the previous one by a cluster being split into two. Obviously whatever method is chosen, neither the first step nor the last step is a solution that is worth seeking.
There are many proximity measures that can be used for the calculation of distances between cases (e.g. Euclidean distance, squared Euclidean distance, Manhattan distance). They quantify how similar two data points (i.e. feature vectors) are [24]. The squared Eu-clidean distance can be an appropriate distance measure in this study, given that it places progressively greater weight on objects that are further apart. It has the disadvantage of depending on the units of measurement for the variables [40]: variables with large values contribute more to the distance measure than variables with small values. This choice is valid in this study, however, since our variables are measured on the same scale.
the survey and collecting the data, we had one set of 168 binary values for each RE tool included in the study. It would have been difficult to show the big picture and provide any kind of meaningful interpretation without higher-level data. For this reason, given that our data were already categorised, we could proceed to aggregate data in order to combine groups of observations —the capabilities included in the same category of features— into summary statistics based on those observations —the continuous score values calculated according to the formulae described in Section 4—. At this point, we have two alternative options to analyse the commonalities and differences between tools by means of cluster analysis: (1) keep the same derived measures —aggregated data— previously used to present the descriptive analysis; or (2) introduce the binary data. Our choice was to go with (1), due to the fact that the interpretation of the cluster analysis could be confusing otherwise. We are thus able to raise the level of abstraction from the low level features to the groups of features. In other words, the intention is to compare and classify the tools according to their score in each category of features, to see if their coverage is similar, rather than according to their particular features to see if they are exactly alike. For instance, let us assume that two tools,TXandTY, have exactly the same score (e.g. 0.5 or 10 out of 20 features) inelicitationand their particular features are as follows:TX (1, . . . , 1, 0, . . . , 0),TY(0, . . . , 0, 1, . . . , 1); a binary proximity measure would tag such tools as completely different, whereas our proximity measure would consider that they are alike, in the sense of having similar ability to deal with elicitation tasks.
As long as there is only one case in each cluster, the smallest distance between the cases in two clusters is established in a straightforward manner by means of the proximity measure described above. However, the need to define a distance measure between pairs of clusters arises when the clusters have more than one case. From among the different methods that IBM SPSS implements to compute this distance between clusters (e.g. near-est neighbour, furthnear-est neighbour, Ward’s method), Ward’s method (minimum variance method) was selected [52]. It is a general agglomerative hierarchical clustering procedure that defines the distance between two clusters as the error function of the unified cluster minus the error functions of the individual clusters. First of all, the means of all variables are calculated for each cluster. Then the squared Euclidean distance to the cluster means is calculated for each case and these distances are added up for all of the cases. Finally, the two clusters that merge at each step are those that result in the smallest increase in the overall sum of the squared within-cluster distances (i.e. the error function) [40]. This ap-proach is efficient and has the advantage of being good at recovering the cluster structure; it yields a unique and exact hierarchy.
will be, but at the same time the analysis of a larger number of groups will be more difficult. On the other hand, the opposite case occurs —the smaller the number of groups defined, the larger they are and the less similar their elements will be, but the analysis of these few groups will in turn be easier.
5.3. Hypotheses
Starting from the result of the clustering algorithm, we can investigate whether the ob-tained groups of RE tools have different levels of support for the categories of features included in our classification framework. The following hypotheses are thus formulated:
The obtained groups of RE tools are not significantly different from each other in terms of their support in:
H10:Elicitation. H20:Analysis. H30:Specification. H40:Modelling. H50:V&V. H60:Management. H70:Traceability.
H80:Collaboration and GSD. H90:Other tool capabilities.
Which are tested against the following alternative hypotheses:
The obtained groups of RE tools are significantly different from each other in terms of their support in:
H1A:Elicitation.
H2A:Analysis.
H3A:Specification.
H4A:Modelling.
H5A:V&V.
H6A:Management.
H7A:Traceability.
H8A:Collaboration and GSD.
H9A:Other tool capabilities.
6.
Categorisation and inferential analysis
is presented below. Next, the hypotheses of the study are evaluated. The final stage is to discuss the results in detail, including some hints for practitioners.
6.1. Outcome of the clustering process
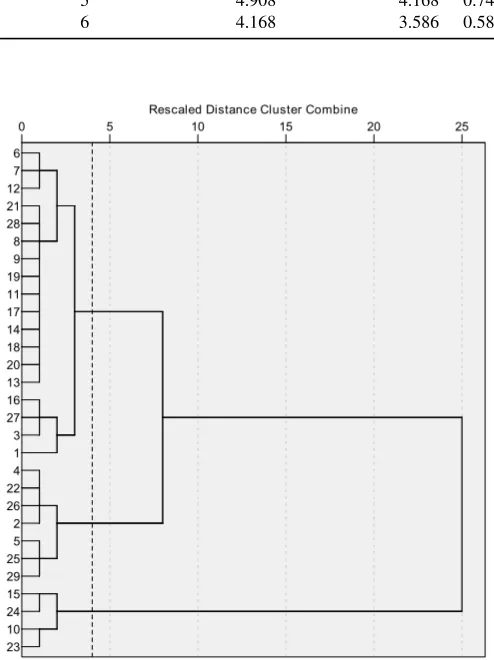
The proximity or dissimilarity matrix that takes in all the distances between the cases under study was obtained first of all. The cluster membership and the agglomeration schedule were then calculated. The agglomeration schedule makes it possible to track the combinations and provides a solution for every feasible number of clusters, from 1 to the number of cases in our sample. Moreover, it provides thecoefficientor value of the distance (or similarity) statistic used to form each cluster. If the coefficients are presented as in Table 7, it is easier to see the changes in them as the number of clusters increase [8]. The difference between coefficients at consecutive steps, shown in the last column of Table 7, allows us to determine the optimum number of clusters. The greater difference is found when a quantity of two clusters is selected, since there are profound dissimilarities between them. However, a quantity of three clusters (C1–C3) is a better choice in this sit-uation: the “change” in the coefficients suggests that this is enough to distinguish between cases, and it is more meaningful to compare three groups of 18, 7 and 4 cases than two groups of 25 and 4 cases. The dendrogram (see Figure 4) supports all these assumptions about the appropriate number of clusters that we deduced from the outcome of the ag-glomeration schedule. It lists all of the cases and indicates at what level of similarity any two clusters were joined, according to the tool scores (see Section 4).
The optimum number of clusters is obtained by cutting the dendrogram at the level of similarity depicted in the chart. The aim is to: (1) minimise variability within clusters; and (2) maximise variability between clusters [8]. It therefore allows us to form homoge-neous groups of tools made up of highly similar elements. Moreover, it provides us with a manageable (not too many) and meaningful (not too few) number of groups which can be analysed easily. The tools classified in each of these groups are shown in Table 8.
Table 9 describes the outcome of the cluster analysis by means of summary statistics. Table 5 and Table 9 present information in a similar way. The difference between them lies in that the first one includes all of the tools —thus giving global insight into the dataset and a general overview of the situation—, whereas the second one offers separate information on each cluster —thus allowing us to compare them. Again, the arithmetic mean, the standard deviation, the skewness and other relevant statistics are included.
To go into greater detail about the three groups obtained, we can remark that tools included inC1stand out in almost all variables;C2mainly includes balanced tools with good overall coverage of features, but one relevant weakness in modelling; C3is com-posed of tools which achieve the lowest scores in the majority of variables.
6.2. Hypotheses evaluation
Parametric tests require certain assumptions about the data to be true, in particular the variables coming from a normal distribution. The Shapiro-Wilk (W-statistic) formal sta-tistical test was performed to confirm that point. If one variable of at least one of the three clusters is not normally distributed, then a non-parametric test is recommended.
Table 7.Agglomeration table
No. of clusters Agglomeration last step Coefficients this step Change
2 17.763 8.554 9.209
3 8.554 5.952 2.602
4 5.952 4.908 1.044
5 4.908 4.168 0.740
6 4.168 3.586 0.582
Y
Rescaled Distance Cluster Combine
25 20
15 10
5 0
23 10 24 15 29 25 5 2 26 22 4 1 3 27 16 13 20 18 14 17 11 19 9 8 28 21 12 7 6
Fig. 4.Dendrogram using Ward linkage
Table 8.Clusters considered Clust. No. Tools
C1 18 T1, T3, T6, T7, T8, T9, T11, T12, T13, T14, T16, T17, T18, T19, T20, T21, T27, T28 C2 7 T2, T4, T5, T22, T25, T26, T29
Table 9.Descriptive statistics of each cluster (C1–C3). EL: elicitation, AN: analysis, SP: specifica-tion, MO: modelling, VV: V&V, MA: management, TR: traceability, CO: collaboration and GSD, OT: other tool capabilities, SD: std. deviation, SE: std. error
Cluster Variable Min. Max. Median Mean SD Skewness (SE) Kurtosis (SE)
C1
(N=18)
EL 0.75 1.00 0.95 0.92 0.08 -1.05 (0.54) 0.08 (1.04) AN 0.55 1.00 0.91 0.87 0.16 -1.19 (0.54) -0.07 (1.04) SP 0.71 1.00 0.86 0.88 0.12 -0.35 (0.54) -1.58 (1.04) MO 0.54 1.00 0.85 0.82 0.15 -0.22 (0.54) -1.16 (1.04) VV 0.36 1.00 0.95 0.88 0.19 -1.92 (0.54) 2.66 (1.04) MA 0.56 1.00 0.89 0.85 0.12 -0.72 (0.54) 0.14 (1.04) TR 0.72 1.00 0.86 0.88 0.10 -0.30 (0.54) -1.38 (1.04) CO 0.36 1.00 0.65 0.66 0.16 0.14 (0.54) 0.03 (1.04) OT 0.29 1.00 0.88 0.84 0.18 -1.84 (0.54) 3.92 (1.04)
C2
(N=7)
EL 0.80 0.95 0.90 0.86 0.06 -0.03 (0.79) -2.07 (1.59) AN 0.55 1.00 0.91 0.83 0.18 -0.84 (0.79) -0.78 (1.59) SP 0.29 0.86 0.71 0.65 0.23 -0.67 (0.79) -1.15 (1.59) MO 0.00 0.46 0.23 0.23 0.15 -0.17 (0.79) -0.15 (1.59) VV 0.73 0.91 0.73 0.78 0.07 1.11 (0.79) 0.27 (1.59) MA 0.28 0.94 0.61 0.64 0.23 -0.24 (0.79) -0.64 (1.59) TR 0.45 0.97 0.62 0.69 0.17 0.37 (0.79) -0.26 (1.59) CO 0.36 0.74 0.59 0.57 0.12 -0.68 (0.79) 1.08 (1.59) OT 0.41 1.00 0.76 0.72 0.25 -0.10 (0.79) -2.21 (1.59)
C3
(N=4)
EL 0.20 0.40 0.32 0.31 0.08 -0.75 (1.01) 0.34 (2.62) AN 0.27 0.45 0.32 0.34 0.09 0.85 (1.01) -1.29 (2.62) SP 0.14 0.43 0.21 0.25 0.14 0.85 (1.01) -1.29 (2.62) MO 0.00 0.31 0.11 0.13 0.13 0.75 (1.01) 0.34 (2.62) VV 0.00 0.73 0.23 0.29 0.31 1.20 (1.01) 1.98 (2.62) MA 0.00 0.39 0.14 0.17 0.16 0.94 (1.01) 1.50 (2.62) TR 0.03 0.59 0.34 0.33 0.28 -0.10 (1.01) -5.27 (2.62) CO 0.05 0.52 0.17 0.23 0.21 1.50 (1.01) 2.65 (2.62) OT 0.06 0.41 0.23 0.23 0.15 0.00 (1.01) -1.20 (2.62)
differences between the three groups of tools. The ANOVA test (F-statistic) hypothesises about the mean instead of the median, as the Kruskal-Wallis test (H-statistic) does. The Kruskal-Wallis test is the non-parametric analog of the ANOVA and was chosen when our data violated the normality assumption, since it requires less stringent prerequisites. Furthermore, scores of each variable differed significantly (p-value < .05) across the three clusters:elicitation(H(2) = 12.746, p = .002),analysis(H(2) = 10.987, p = .004), specification(H(2) = 14.193, p = .001), modelling(F(2,26) = 61.307, p = .000), V&V (H(2) = 13.027, p = .001),management(F(2,26) = 30.452, p = .000),traceability(H(2) = 14.691, p = .001),collaboration and GSD(F(2,26) = 11.959, p = .000) andother tool capabilities(H(2) = 10.021, p = .007).
Mann-WhitneyUtests (non-parametric) were used for an in-depth analysis of the ANOVA and Kruskal-Wallis results, respectively. It was therefore necessary to adjust the significance level with a multiple comparison procedure, designed to avoid calling differences sig-nificant by mistake. Hence, a variant of Bonferroni adjustment called Holm-Bonferroni method [29] was selected.
Some common statistical procedures, such as theT-tests, assume that variances of the populations from which different samples are drawn are equal. The null hypothesis that the population variances are equal, also known as thehomogeneity of variances assump-tion, was assessed by means of Levene’s test (F-statistic) before applying the T-tests. When Levene’s test is significant, modified procedures that do not assume equality of variances are used.
Finally, Table 10 shows thepost-hoctests carried out in this study, including the Stu-dentTand the Mann-WhitneyUstatistics. Its last column indicates whether two specific clusters differ significantly with respect to their scores in each variable or not, after a Holm-Bonferroni adjustment.
Our results indicate that the alternative hypothesesH3A,H5A,H6AandH7Acan be
accepted, since we found support to reject their corresponding null hypotheses for each pair of clusters. Moreover, based on our data, we found that the alternative hypotheses H1A,H2A,H4A, H8A andH9A can be partially accepted; a closer look at specific
pairs of clusters is necessary if we are to know whether they are significantly different or not (see Table 10). Note that there is no alternative hypothesis which can be rejected according to our data (conversely, there is no null hypothesis which can be accepted).
6.3. Discussion
It is possible to analyse the direction in which these differences occur. Given that we already know which clusters have significant differences in coverage of features between them, their particular scores can be checked (see Section 6.1). Broadly speaking, it seems that tools inC1are more complete as compared to tools inC2andC3. It is also likely that tools inC2are more complete than tools inC3:
– Firstly, let us focus on the case ofC1andC2. As shown in Table 10, results from the independentT-tests indicate that the differences in the average scores were significant formodellingandmanagement, but not in the case ofcollaboration and GSD. The Mann-Whitney tests show that the distributions in the two groups differ significantly as regardsspecification,V&V and traceability, but not in the cases of elicitation, analysisandother tool capabilities. This means that we can conclude that tools in C1should be considered when looking for the best possible solution inspecification, modelling,V&V,managementandtraceability. Nevertheless, it is also worth a closer look at alternatives inC2 as well as in C1 if the focus is on elicitation,analysis, collaboration and GSD, along withother tool capabilities.
Table 10.Post-hoc paired comparisons. EL: elicitation, AN: analysis, SP: specification, MO: mod-elling, VV: V&V, MA: management, TR: traceability, CO: collaboration and GSD, OT: other tool capabilities
Var. Pair Parametric tests Sig. Var. Pair Non-parametric tests Sig.
MO
C1–C2T(23) = 8.82, p=.000Yes EL
C1–C2U = 33.50, Z=−1.83, p=.068No C1–C3T(20) = 8.51, p=.000Yes C1–C3U =.00, Z=−3.12, p=.002 Yes C2–C3T(9) = 1.04, p=.323 No C2–C3U =.00, Z=−2.69, p=.007 Yes MA
C1–C2T(23) = 2.95, p=.007Yes AN
C1–C2U = 51.50, Z=−.73, p=.466 No C1–C3T(20) = 9.46, p=.000Yes C1–C3U =.00, Z=−3.16, p=.002 Yes C2–C3T(9) = 3.55, p=.006 Yes C2–C3U =.00, Z=−2.66, p=.008 Yes CO
C1–C2T(23) = 1.34, p=.194No SP
C1–C2U = 25.00, Z=−2.39, p=.017Yes C1–C3T(20) = 4.59, p=.000Yes C1–C3U =.00, Z=−3.18, p=.001 Yes C2–C3T(9) = 3.56, p=.006 Yes C2–C3U = 2.00, Z=−2.30, p=.021 Yes
VV
C1–C2U = 24.00, Z=−2.45, p=.014Yes C1–C3U = 3.00, Z=−2.94, p=.003 Yes C2–C3U = 2.00, Z=−2.38, p=.017 Yes TR
C1–C2U = 20.00, Z=−2.63, p=.009Yes C1–C3U =.00, Z=−3.10, p=.002 Yes C2–C3U = 2.50, Z=−2.18, p=.029 Yes OT
C1–C2U = 47.50, Z=−.95, p=.343 No C1–C3U = 1.50, Z=−2.96, p=.003 Yes C2–C3U =.50, Z=−2.56, p=.010 Yes
– Lastly, let us explore the case ofC2andC3. TheT-tests show statistically-significant differences in the average scores ofmanagementandcollaboration and GSD, whereas this does not happen in the case ofmodelling. Moreover, according to the Mann-Whitney tests,elicitation,analysis,specification,V&V,traceabilityandother tool capabilitiespresent significantly different distributions. As a result, it is recommend-able to consider tools in both groups if the focus is onmodelling, whereasC3can be discarded if the other categories of features are what determine the purchase decision; however, in this case the conditions set out in the previous point will apply once more. Note that our advice with regard toC2andC3tools is intended for customers who, for whatever reason, are not interested in tools included inC1, sinceC1includes the most effective tools in general terms, according to our study.
us to compare the coverage of features of the three centroids visually —and therefore their corresponding clusters— in each variable.
Hints for practitioners The brief example below illustrates the way in which our find-ings can be useful for practitioners who face the challenge of choosing an RE tool, or advising their management on what tool should be bought. Note that it is possible to have different stakeholders with different preferences. On the one hand, let us suppose that an organisation is usually involved in GSD projects. That being the case, it should focus pri-marily on the scores of the tools incollaboration and GSD. This can be achieved directly by consulting Table 4 and looking for the tools that rated higher in those categories of features. However, it would also be meaningful to find out in which clusters those tools are grouped (Table 8), as this might uncover related candidates not taken into account at first. Later, an in-depth study of factors such as price or post-sale service can determine the final decision. On the other hand, let us imagine an organisation devoted to traditional, co-located development that may be interested in all categories of features apart from the distributed and GSD ones. This obviously makes the decision more complicated. Hence, the measures of central tendency in Table 9 forC1–C3inform about the comparative cov-erage of features of a small set of groups of related tools. This can help practitioners to focus only on a particular set of relevant alternatives and simply rule out others, reducing the size of the original, larger set of candidates. Moreover, the formal analysis conducted in this experiment leads practitioners to become aware of statistically-significant differ-ences between categories of features and between groups of tools, thus highlighting their actual commonalities and differences.
The wide definition of RE tool used in this study (see Section 3) makes sense from an RE tool user standpoint, given that user needs regarding RE tool support normally differ depending on the particularities of the user, organisation, domain, environment, etc. As a result, in some cases, a single RE tool capable to deal with the whole RE process is the best choice. In other cases, an RE tool which only addresses specific activities —or a combination of them, if a broader set of activities is to be covered— could be more ap-propriate. In one way or another, a combination of tools can be utilised to achieve similar results to those delivered by a single, more complete RE tool. The following equation, which should be used together with the formulae presented in Section 4, could serve to compute the coverage of features in such a case:
score(∪T, q) =
0,ifPn
i=1score(ti, q) = 0;
1,otherwise.
score(∪T, q)∈ {0,1}is the score of the combination of tools∪T =t1∪ · · · ∪tnin
the questionq. The expression above represents a theoretical approach to the calculation of the score of an arbitrary number of tools. However, there will likely be extra charges coming from the use of various tools which can be also taken into account (e.g. integration overhead, additional training effort). This concept can be seen as the fitnessf(∪T) ∈
[0,1]of a given combination of RE tools to work together. The penalty being imposed for these extra charges can be either negligible (f(∪T) = 1) or make the use of a set of tools completely unfeasible (f(∪T) = 0), with a broad variety of intermediate situations:
Table 11.Centroids. EL: elicitation, AN: analysis, SP: specification, MO: modelling, VV: V&V, MA: management, TR: traceability, CO: collaboration and GSD, OT: other tool capabilities
Cluster EL AN SP MO VV MA TR CO OT
C1 (0.92, 0.87, 0.88, 0.82, 0.88, 0.85, 0.89, 0.66, 0.84) C2 (0.86, 0.83, 0.65, 0.23, 0.78, 0.64, 0.69, 0.57, 0.72) C3 (0.31, 0.34, 0.25, 0.13, 0.30, 0.17, 0.33, 0.23, 0.24)
0.000 0.125 0.375 0.625 0.875 1.000
elicitation
analysis
specification
modelling
V&V management
traceability collab. and GSD
other tool capab.
C1
C2
C3
Fig. 5.Kiviat diagram of the centroids of the clusters
Note that we collected evidence on the richness of the tools in terms of coverage of features. However, the organisational context in which an RE tool gets embedded is critical and should not be ignored. The technology acceptance model (TAM) can help us to put our results into a perspective of technology adoption [51]. The TAM highlights the need to be conscious about the socially-constructed processes in which tools are deployed and used on daily basis. This is because when users are presented with new technology, a number of factors —in particular perceived usefulness and perceived ease of use— influence their decision about how and when they will use it. There is no “one-size fits all” way to select an RE tool effectively. It will largely depend on the specific context, i.e. the type of project, the type of organisation, etc. In this sense, companies must focus on their own RE processes and activities, and especially on the people that carry them out, to be able to find the solution that adapts best to the needs of their particular settings. Furthermore, if there is a tool already in place and most business users are happy with it, then it is probably not appropriate to force the organisation to embark on a large-scale tool change only because the new tool is richer in functionality. That said however, it would make sense for organisations to bear in mind our findings concerning coverage of features, at least, if:
appropriate one among those available could be chosen according to the particular project to be addressed.
2. The company owns only one RE tool, or only one RE tool can be used in one specific project, for whatever reason. Our study could be useful in identifying the deficiencies in the tool before tackling the project. Consequently, there will be a realisation that more effort and experts trained in dealing with these missing features will be needed to fill in the gaps in the tool.
3. A tool replacement is about to take place. The results of our study can be consulted so that the best possible option can be adopted.
If an RE tool is already in use in the organisation, and this is going to be replaced with another tool selected from our study, it is important that practitioners take into account the tool support for the ReqIF format. This would mean that it would be possible to migrate project requirements from their current tool to the new tool seamlessly. Of course, this will only be possible if both the current tool and the new tool include this capability.
7.
Threats to the validity of the study
The validity threats [54] of this research are discussed below.
Conclusion validity. This refers to the ability to draw correct conclusions about re-lationships. The study was validated through a systematic process and sufficient details were included to allow the process to be reproduced, although the number of results ob-tained in the searches might be different in the future. The sample size (29 tools) was below that needed to produce an acceptable statistical power and it is undeniable that a certain number of tools not considered in this research exist; in addition, clustersC2 andC3are smaller than is desirable for the achieving of more conclusive results through the hypothesis-testing procedures. All this being so, conclusions derived from the study must not be considered definitive and further prospective research with a larger sample is recommended, to explore the capabilities of current RE tools in greater breadth. Nev-ertheless, the number of participants represents an important percentage of the entire RE tool-selling community, including major tools, as well as tools from different companies located in three continents (Asia, America and Europe). On the other hand, continuous variables were calculated from the data and a continuous proximity measure was chosen to carry out the cluster analysis, instead of having a binary proximity measure applied di-rectly (see Section 5.2). The reason behind this is that we wish to focus on the categories of features rather than on the features themselves.
External validity. This is concerned with the generalization of the results to industrial practice. In order to be systematic, only tools appearing in well-known RE tool lists were included in this survey, thus leaving out other tools which might be RE tools but which are not collected in these sources yet. As a result, the selection of the participants was adequate, as all of the well-known RE tool databases were screened. In addition, the capa-bilities under study were in the main extracted from a framework specifically designed by experts for the evaluation of RE tools [31]; this was also refined so as to address some ad-ditional topics linked to industry needs. However, these features might not be the precise ones that users of tools find relevant. We do believe, nevertheless, that the experimental evidence collected in this study can be generalised to concrete RE industry settings, tak-ing into account the reflections on this matter presented in Section 6.3. Desirable features of the tools were united in a coherent and general-purpose classification framework, the intention being to broaden out its applicability enough for it to reach a larger audience, even without any contextual information. Moreover, generalisation often depends on the nature of the project and its governance, the maturity level of the organisation and the organisational size; it is up to the reader to evaluate the results for himself/herself and look at how to use them in his/her own setting. Considering these implications, our find-ings can be useful for practitioners, bearing in mind that the technology is evolving and new tools will be introduced to support RE characteristics, apart from the fact that the already-existing tools will no doubt provide new abilities.
8.
Conclusions and further work
in coverage of features, price differences [9] would not be justified, but this is definitely not the case.
Three suitable groups of related tools (C1-C3) were identified through a clustering approach, which could be used to consider different, related options when a decision is to be taken. We can conclude that, if the best coverage of features is to be accomplished, C1 includes the most capable tools inspecification,modelling,V&V,managementand traceability, according to our assessment. It can also be affirmed that tools inC2are able to compete with tools in C1, especially inelicitation,analysis,collaboration and GSD andother tool capabilities, where they have shown a similar level of coverage of features. Finally, tools inC3could be taken into account in certain cases in which the specific needs of the organisation are adequately covered by them, but it has to be said that they present weak points in common use; their support for the whole RE process is incomplete.
Among the topics included in this study, we have examined how the RE tools cope with ReqIF support, as shown in Section 4. Furthermore, if we look at the clusters consid-ered in this study, only one tool inC2provides this feature (14.29%), while the remaining eight tools that include this capability belong toC1(44.44%). In this regard, one respon-dent commented that “A direct-read interface can be built against the API, but this will only be considered once ReqIF, or any competing format, become industry de-facto stan-dard”. Indeed, there is a growing tendency for the RE tool vendors to provide this support; for example, the version of Requirements Composer that was evaluated in this study (3.0) did not implement ReqIF, whereas the new version (4.0) already does10.
In further work, we plan to extend our approach to perform a new cluster analysis on the data, using a binary proximity measure, in addition to the continuous proximity measure already shown. We will then be able to compare the results directly. It is possible to consider it as applying a black-box approach —continuous proximity measure— as opposed to a white-box one —binary proximity measure— with respect to the specific features of the tools.
A new survey will be carried out periodically to update the tool data and to keep the information accurate. The historical data and the newly collected data will allow us to predict future, expected trends on inclusion of new features (e.g. per functionality group). In addition, we will also collect data from users of RE tools in order to acquire additional information and complement the data obtained from vendors. Nevertheless, a number of new issues will be raised that need to be carefully addressed, for example: (1)objectivity: the fact that the feedback come from users cannot guarantee by itself the objectivity of the collected data —like in the case of vendors, users’ judgment criteria can be biased—; (2)knowledge: users might have a limited knowledge of the capabilities of the RE tools, particularly restricted to the use they make of them, which is determined not only by their personal experience, but also by the organisational context (e.g. methods, techniques, domains); (3)commitment: users are not likely to perceive a clear benefit of participating in surveys about RE tools, whereas vendors are commonly interested in taking part in them, since the effort invested in answering the questionnaire will be returned in the form of more visibility for their RE tools; (4)accessibility: users cannot be easily found and reached, especially in the case of minor RE tools, and this problem does not occur with vendors, whose contact details are usually available on their websites.
10