DOI: 10.30954/0424-2513.2.2018.9
©2018 New Delhi Publishers. All rights reserved
The Impact of Microfinance: Helping to Improve Donor
Effectiveness in Microfinance
Shivaprasad G.
1* and K.H Anilkumar
21ABBS School of Management, Off Magadi Road, Andrahalli Main Road, Bangalore, Karnataka, India 2Karnataka College of Management, Bangalore, India
*Corresponding author: [email protected]
ABSTRACT
Microfinance as a financial tool has also seen ups and downs. During 2011, market commentators predicted the end of India’s microfinance market but as on 31 March 2014, there were more than 74.30 lakh savings-linked SHGs, covering over 9.7 crore poor households. The total savings of these SHGs with banks amounted to ` 9897.42 crore. The number of credit-linked SHGs under the programme was 41.97 lakh. In 2011, the government of the state of Andhra Pradesh was seeking to prohibit the microloans business. After the crisis, RBI has handled the sector very vigilantly, carefully and very thoughtfully. The National Bank continued to provide 100 per cent refinance assistance to banks for financing SHGs. The SHG–Bank Linkage Programme (SHG–BLP) has expanded substantially since it was first launched on a pilot scale in 1992. The geographical spread of the movement has also been quite impressive from an essentially Andhra Pradesh – Karnataka phenomenon in the beginning now spreading to even the most remote corners of India. This paper tries to address impact of microfinance on women self help group members in comparison with non-beneficiaries of the microfinance schemes. Study found that the impact of microfinance on rural women economic condition is positive and microfinance is reforming their life. Keywords: Microfinance, economic, SHGs, Empowerment, Rural Women, Beneficiaries, food expenditure, personal expenditure and investment
The status of women in India has seen two ends of the spectrum, from being one of equality and respect to being the disadvantaged populace in the recent times. Over the past millennium, the status of women in India has been subject to a great number of changes. Since independence women’s right are secured under the constitution of India. Equality, dignity and freedom from discrimination are ensured and further many statutes are in place governing the rights of women. Though the status of women has alleviated through the times in terms of social and economic emancipation, Indian women have a long way to go. It is not only the rural women who tend to lack the opportunities to improve their lives but also women in the urban areas too, though their condition is better than the rural women are. In this scenario, any effort to bring the women out of their vicious cycle of poverty that not only impoverishes them but also demoralizes
them needs to be welcomed. Such efforts at the social and economic improvement of the women of India will go a long in not only improving the status of the women but a better nation as well.
REVIEW OF LITERATURE
contribution to household income, and acquisition of household assets (E.M. Reji, 2009). The ‘wider impacts’ of micro-lending on the lives of the poor aim at gauging the social impact analyses of microfinance programs. This wider impact can be taken to be a ‘public good’ that benefits the sector the microfinance institutions (MFIs), donors, borrowers, and even the non-borrowers, in its entirety (Asad Ghalib, 2009).
There is a high correlation between microcredit and children’s education (Yasmine F. Nader, 2008), also income and assets. It has also been proved in various studies that microcredit has improved the health and harmony in the family that has taken the credit. The net impact not only in case of all the borrowers but also in case of the poorest borrowers, shows that the better outreach of the bank linkage programme of borrowing on income is positive. However, certain shortcomings were also observed in some studies. The process of empowerment was poor (K. Sivachithappa, 2013), although a positive impact on poverty was observed.
Microfinance Impact at the Household Level The empowerment of women through SHGs would lead benefits not only to the individual women but also for the family and community as whole through collection action for development these SHGs have collection action (A. Angel Anila, 2012). Microfinance through SHG seems to be a unique action oriented rural development strategy to tap the gesture for the up-liftment in social and economic point of view (Mula G. & Sarker S.C. 2013). The net effect of microfinance on few household durable items like fan, bicycle and sewing machine, of the poor borrowers was found to be positive while the net effect of microfinance on household’s durables of the non-poor borrowers was marginal’. The majority of the poor non-borrowers reported no change in their livestock compared to the poor borrowers (Nasim Shah Shirazi, 2012).
Research Gap and Research Questions
The extensive study of existing literature indicates that several studies have been undertaken either by individuals, institutions or research agencies to review the prospects of the microfinance and socio-economic status of women. Though the
agencies examined the socio-economic impact of the programme, they were not comprehensive and complete in their approach. As a matter of fact, contributions made in this regard by individual academicians and researchers are limited in scope. Further, no study was conducted in Malenadu regions in linking credit with economic conditions of women SHGs in the region. To fill the gap in research, the present study has been undertaken. This study will try to address several questions raised by the past studies i.e., How does microfinance affect economic conditions of women microfinance beneficiaries compare to non-beneficiaries of microfinance in terms of Income, savings, expenditure, education and investment on fixed assets and live stocks of the beneficiaries?
Objectives of the Research
The specific objectives of the present study is to assess the reformative role of microfinance on economic conditions of the women Self Help Group members and compare economic conditions of beneficiaries with the non-beneficiaries of microfinance.
Hypothesis
“The economic conditions of SHGs largely depend upon
the nature of the benefit received when compared with SHGs not receiving any benefits.”
Ho: There is no significant difference in the economic conditions of beneficiaries and non-beneficiaries during pre and post Microfinance period.
Ha: There is a significant difference in the economic conditions of beneficiaries and non-beneficiaries during pre and post Microfinance period.
Type of Research
Descriptive (Ex post facto research- Pre and post Microfinance)
Sources of Data Collection
Primary Data-structured questionnaire interview
Secondary Data- NABARD, APEX, CESS, SERP
Validity
Study is based on Extensive review of literature
- Alreck & Settle, 1995; Gaddis, 1998; Long, 1998; and Leedy & Ormrod, 2001).
Drafted 22 items, 6 content judges and the final scale comprised of 15 items.
Reliability
Cronbach’s Alpha is 0.738 (number of items 15) which is acceptable (Cronbach, 1951; Nunnally & Bernstein, 1994 and George and Mallery, 2003).
Normality
The Shapiro-Wilk Test shows that p value is
more than the alpha value in each factor, it can be understood that data came from a normally distributed population.
Economic Indicators
Income, Savings, Food Expenditure, Personal
Expense, Education, Investments on Fixed Assets & Livestock and Home Appliances.
Tools of Analysis
Paired sample T-test
Data Analysis and Elucidation
Profile of Women Respondents
Profile of women respondents is given in this section. The analysis is based on the data collected from 800 beneficiaries and 200 non-beneficiaries from the Malenadu region of Karnataka State. In order to evaluate the impact of microfinance programme on the women self-help group, it is necessary to know about their demographic background. This helps to identify the factors that led to the successor or otherwise of the enterprises undertaken by them. The demographic profile of the respondents in respect of their religion, age case, literacy level, marital status, size of the family and primary occupation are focused.
The following text and tables relevant shows the independent variables and their distribution, which will form an integral part of data analysis and help us draw further insights and inferences from the
data especially when combined and cross-tabulated with dependant variables (various economic, social, and socio-economic factors and indicators).
Distribution of Women Respondents
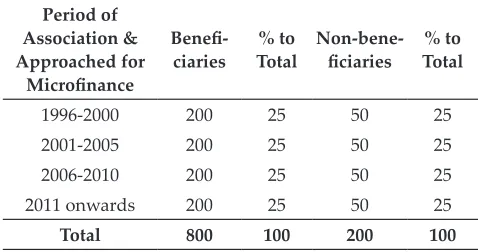
Table 1 provides distribution of women beneficiaries and non-beneficiaries of microfinance programme in Malenadu region.
Table 1: Distribution of Women Beneficiaries and Non-Beneficiaries of Microfinance Programme in
Malenadu Region
Period of Association & Approached for
Microfinance
Benefi
-ciaries Total% to Non-beneficiaries- Total% to
1996-2000 200 25 50 25
2001-2005 200 25 50 25
2006-2010 200 25 50 25
2011 onwards 200 25 50 25
Total 800 100 200 100
Source: Field survey.
Table 1 shows the distribution of the beneficiaries and non-beneficiaries. The study has been conducted by taking 200 beneficiary members and 50 non-beneficiary members from each period of association, which is grouped in periods of 5 years. The total sample comprises 800 members and 200 non-members and the total sample members and non-members are 1000. Members and non-members are distributed equally.
Religion
Table 2 presents the religion-wise distribution of respondents in the study area.
Table 2: Religion-Wise Distribution of Sample Respondents
Religion Beneficiaries - % to total Non-Beneficiaries - % to total
Hindu 657 82.125 169 84.5
Muslim 76 9.5 14 7
Christian 58 7.25 14 7
Others 9 1.125 3 1.5
Total 800 100 200 100
Table 2 shows that, out of 800 beneficiaries, 657 respondents (82.125 per cent) were Hindus, 76 (9.5 per cent) were Muslims whereas 58 (7.25 per cent) were Christians while 9 (1.125 per cent) belonged to different religions. Non-beneficiaries were distributed with 169 (84.5 per cent) being Hindus, 14 (7 per cent) Muslims while 14 (7 per cent) Christians whereas a small number 3 (1.5 per cent) belonged to different religions.
Community
Community plays an important role in India with special statuses to scheduled castes and other reserved categories. In order to uplift the community, government has packages and allocated further rights to these which will enable them to come up in life, both economically and socially.
Table 3: Community-wise Classification of Respondents
Caste Beneficiaries - % to Total Non-beneficiaries % to Total
-SC 101 12.625 20 10
ST 213 26.625 53 26.5
OBC 370 46.25 94 47
GM 53 6.625 23 11.5
Others 63 7.875 10 5
Total 800 100 200 100
Source: Field survey.
It is observed from the Table 3 that out of 800 beneficiaries 101 (12.625 per cent) were SC caste, 213 (26.625 per cent) were ST, 370 (46.25 per cent) were OBC, 53 (6.625 per cent) were GM and 63 (7.875 per cent) were from other caste. Out of 200 non-beneficiaries, 20 (10 per cent) were SC, 53 (26.5 per cent) were ST, 94 (47 per cent) were OBC, 23 (11.5 per cent) were GM and 10 (5 per cent) were from other caste.
Age of the Respondents
Age is an important factor to make any programme success. Here also, the age factor plays an important role in participating income-generating activities. The total respondents are classified into four age groups and the details are presented in Table 4.
Table 4: Age-wise Categorization of Respondents
Age
Group Beneficiaries - Total% to Non-beneficiaries - Total% to
Below 25 20 2.5 3 1.5
26-35 184 23 33 16.5
36-45 376 47 96 48
46 & above 220 27.5 68 34
Total 800 100 200 100
Source: Field survey.
Evidently, a majority of the beneficiaries (47 per cent) and non-beneficiaries (48 per cent) were found in the age group of 36-45 years. It may be inferred that majority of respondents were clustered in the productive years.
Educational Background
Details of the respondents, according to their educational levels are presented in Table 5.
Table 5: Level of Education-wise Segregation of Respondents
Education
-al Level Beneficiaries - Total% to Non-beneficiaries- Total% to
Illiterates 284 35.5 50 25
Primary 236 29.5 92 46
Middle
School 127 15.9 34 17
Pre-University 88 11.0 15 7.5
Degree &
above 65 8.1 9 4.5
Total 800 100 200 100
Source: Field survey.
It is noticed from the Table 5 that the illiterates are found more in numbers in case of beneficiaries rather than non-beneficiaries as the percentage is 35.5 per cent. It is concluded from the Table 5 that the illiterates were attracted much towards microfinance to improve their standard of living instead of literates whose percentage is very less as noticed from the data incorporated in the Table.
Marital Status
constituting 93 per cent among the beneficiaries and 94.5 per cent among non-beneficiaries.
Table 6: Marital Status of Respondents
Marital
Status Beneficiaries - Total% to Non-beneficiaries - Total% to
Married 744 93 189 94.5
Un-married 25 3.125 6 3
Divorcee 10 1.25 0 0
Widow 21 2.625 5 2.5
Total 800 100 200 100
Source: Field survey.
The Un-married and divorced women are negligible percentage among the respondents. It may be concluded that more than 93 per cent of the sample respondents were married both among beneficiaries and non-beneficiaries.
Size of Family
The number of persons living in respondent’s house in the Malenadu region is presented in Table 7.
Table 7: Family Size of the Respondents
Family
Size Beneficiaries- % to Total Non-beneficiaries- % to Total
1-4 426 53.25 25 12.5
5-7 128 16 115 57.5
8-10 188 23.5 44 22
11 & above 58 7.25 16 8
Total 800 100 200 100
Source: Field survey.
The table 7 reveals that 53.25 per cent of the house-holds are in the size of 1- 4 members, followed by 16 per cent in the size of 5 – 7 and 23.5 per cent in the size of 8-10. The family size of 11 members and above constituted just 7.25 per cent. Evidently, the beneficiaries have strictly followed the family planning methods confining their family size to 1 to 4 members only, because of greater awareness among the beneficiaries. But in the case of non-beneficiaries only 12.5 per cent of families are in the size of 1-4 members. It is clear that those who joined microfinance programme are more conscious about the family planning than the non-beneficiaries.
Occupational Pattern
Occupational distribution of the respondents is presented in Table 8.
Table 8: Occupational Pattern among Respondents
Occupation Beneficiaries- Total% to Non-beneficiaries- Total% to
Agriculture/
Cultivators 377 47.125 30 15
Agricultural
Labourers 175 21.875 58 29
Non-Agriculture/
Others
248 31 112 56
Total 800 100 200 100
Source: Field survey.
The occupational pattern shows that agriculture is the main occupation of the beneficiary respondents. Agriculture is the predominant sector for microfinance beneficiaries of the Malenadu region, which employs nearly 47.125 per cent of the total respondents. The rest of the labour force is engaged in other sectors. But where is in the case of non-beneficiaries only 15 per cent of the respondents were depending on the agricultural activities and more number of respondents i.e. 47.125 per cent depends on the agricultural labourer activities. So income generation of the non-beneficiaries is purely depends on number of working days available in the Malenadu region.
With the analysis of independent variables in the previous section it is now to see how the dependent variables are distributed and their status, which will then be cross tabulated with the independent variables which will answer few important questions by giving further insights into the study and a better understanding. The objective is to understand the economic conditions of women SHGs members and how micro-finance has impacted (whether positively or negatively) their status.
It is a good place now to mention the hypothesis, which forms base for the data analysis.
Comparative Analysis of Income Level of Beneficiaries and Non-Beneficiaries
of microfinance in the various periods, the total beneficiaries and non-beneficiaries were broadly classified into four groups viz., (1) 1996-2000 (2) 2001-2005 (3) 2006-2010 and (4) 2011 onwards.
Table 9: Income Level
Income Level Beneficiaries Non-Beneficiaries
2000-11999 3 136
12000-21999 38 64
22000-31999 225 —
32000-41999 224 —
42000-51999 93 —
52000-61999 114 —
62000-71999 49 —
72000-81999 20 —
82000-91999 23 —
92000-101999 11 —
Grand Total 800 200
Source: Field Survey.
Table 9 reveals the income level of beneficiaries and non-beneficiaries during pre and post period of microfinance in Malenadu region.
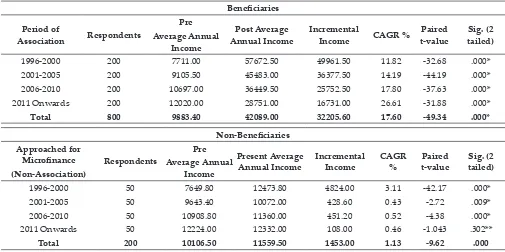
The calculated t values of pre and post microfinance period of the respondent beneficiaries of all the period of association are significant at 5 per cent level, but it is insignificant in case of non-beneficiaries who approached for microfinance after 2011. It is clear from the table 10 that the average annual income generation among the various period of association and approached (non-association) during the pre-period constituted
` 9883.40 and ` 10106.50 in case of beneficiaries and non-beneficiaries respectively which rose to `
42089.00 and ` 11559.50 in post period which clearly indicates that there is remarkable improvement in the income generation of microfinance beneficiaries. It is evident from the table 10 that the difference in income level during pre-microfinance period in case of beneficiaries and non-beneficiaries is very negligible comparatively with post- microfinance period where the percentage increase in the average annual income of the beneficiaries during post microfinance is 17.60 per cent. But it is just 1.13 per cent with regard to non-beneficiaries. It is also noticed that the clients who joined the microfinance scheme during 1996-2000 had very low income compared to other time period of association i.e. only ` 7711.00. But after availing microfinance, beneficiaries who joined the scheme during
1996-Table 10: Average Annual Income of the Respondents
Beneficiaries
Period of
Association Respondents
Pre Average Annual
Income
Post Average
Annual Income Incremental Income CAGR % Paired t-value tailed)Sig. (2
1996-2000 200 7711.00 57672.50 49961.50 11.82 -32.68 .000*
2001-2005 200 9105.50 45483.00 36377.50 14.19 -44.19 .000*
2006-2010 200 10697.00 36449.50 25752.50 17.80 -37.63 .000*
2011 Onwards 200 12020.00 28751.00 16731.00 26.61 -31.88 .000*
Total 800 9883.40 42089.00 32205.60 17.60 -49.34 .000*
Non-Beneficiaries Approached for
Microfinance (Non-Association)
Respondents
Pre Average Annual
Income
Present Average
Annual Income Incremental Income CAGR % t-valuePaired tailed)Sig. (2
1996-2000 50 7649.80 12473.80 4824.00 3.11 -42.17 .000*
2001-2005 50 9643.40 10072.00 428.60 0.43 -2.72 .009*
2006-2010 50 10908.80 11360.00 451.20 0.52 -4.38 .000*
2011 Onwards 50 12224.00 12332.00 108.00 0.46 -1.043 .302**
Total 200 10106.50 11559.50 1453.00 1.13 -9.62 .000
2000 were out performed compared to other groups. Taking the period of association and the approached (non-association) wise income of the respondents into consideration, 1996-2000 groups benefited more which constituted 11.82 per cent increase in CAGR and had highest income in the post microfinance period i.e. ` 49961.50, which is more in worth than any other period of association. As compared to the beneficiaries, the non-beneficiaries could not achieve significant increase in the average annual income in the Malenadu region.
Thus, it is evident that the beneficiaries of microfinance have recorded a satisfactory increase in their incremental annual income as compared to the non-beneficiaries who were outside the fold of microfinance.
Comparative Analysis of Saving Level of Beneficiaries and Non-Beneficiaries
To find out the difference in savings of the beneficiaries with the non-beneficiaries of microfinance in the various periods, the total beneficiaries and non-beneficiaries were broadly classified into four groups viz., (1) 1996-2000 (2) 2001-2005 (3) 2006-2010 and (4) 2011 onwards.
Table 11: Savings Level
Savings/
Investments Beneficiaries Non-Beneficiaries
600-1599 1 3
1600-2599 1 43
2600-3599 1 62
4600-5599 2 76
5600-6599 2 7
6600-7599 3 9
7600-8599 11 —
8600-9599 26 —
9600-10599 87 —
10600-11599 73 —
11600-12599 72 —
12600-13599 102 —
13600-14599 60 —
14600-15599 70 —
15600-16599 66 —
16600-17599 36 —
17600-18599 25 —
18600-19599 28 —
19600-20599 38 —
20600-21599 24 —
21600-22599 61 —
22600-23599 6 —
23600-24599 4 —
24600-25599 1 —
Grand Total 800 800
Source: Field Survey.
Table 12: Saving Level of Beneficiaries and Non-Beneficiaries
Beneficiaries Period of
Association Respondents
Pre Average Annual
Savings
Post Average
Annual Savings Incremental Savings CAGR % t-valuePaired tailed)Sig. (2
1996-2000 200 2684.40 23569.00 20884.60 12.98 -34.15 .000*
2001-2005 200 3442.20 18393.20 14951.00 14.92 -45.40 .000*
2006-2010 200 3778.80 14879.80 11101.00 20.30 -40.55 .000*
2011 Onwards 200 4308.00 12000.40 7692.40 32.35 -36.65 .000*
Total 800 3553.35 17210.60 13657.25 20.11 -52.57 .000*
Non-Beneficiaries Approached for
Microfinance (Non-Association)
Respondents
Pre Average Annual
Savings
Present Average
Annual Savings Incremental Savings CAGR % t-valuePaired tailed)Sig. (2
1996-2000 50 3009.90 4919.50 1909.60 3.14 -41.73 .000*
2001-2005 50 2793.00 2821.60 28.58 0.14 -0.605 .548**
2006-2010 50 3072.64 3208.00 135.40 0.55 -4.38 .000*
2011 Onwards 50 3567.20 3599.60 32.40 0.47 -1.043 .302**
Total 200 3110.70 3637.20 526.50 1.08 -8.778 .000*
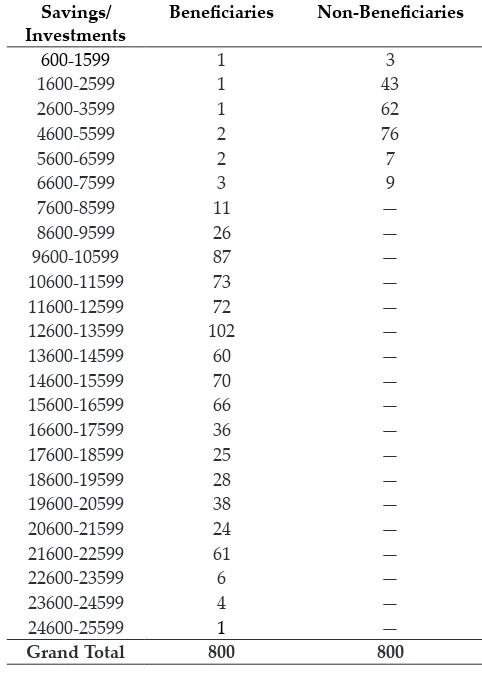
Table 11 reveals the saving level of beneficiaries and non-beneficiaries during pre and post period in Malenadu region.
The t values have been calculated to know the level of significance in generation of savings during post-microfinance period. The values are significant at 5 per cent level in case of beneficiaries in all period of association and it is insignificant at 5 per cent in case of non-beneficiaries for the period 2001-2005 and 2011 onwards. It is observed from the Table 12 that the incremental savings of the non-beneficiaries is comparatively less than the beneficiaries. It is noticed from the table that the savings generated with the help of microfinance is very high constituting 20.11 per cent increase as compared with the non-beneficiaries whose savings are only 1.08 per cent.
The period of association analysis during the post period shows that, beneficiaries who availed microfinance during 1996-2000 recorded the highest saving of ` 23569.00, but it is just ` 4919.50 for the non-beneficiaries. Negligible improvement can be found in case of non-beneficiaries in which only 0.14 per cent growth in their savings is recorded during the period of 2001-2005.
Overall, it is evident that the beneficiaries of microfinance have recorded a satisfactory increase
in their incremental savings as compared to the non-beneficiaries who were outside the fold of microfinance.
Comparative Analysis of Food Expenditure of Beneficiaries and Non-Beneficiaries
To find out the difference in food expenditure of the beneficiaries with the non-beneficiaries of microfinance in the various periods, the total beneficiaries and non-beneficiaries were broadly classified into four groups viz., (1) 1996-2000 (2) 2001-2005 (3) 2006-2010 and (4) 2011 onwards.
Table 13: Food Expenditure No. of
Respondents Beneficiaries Non-Beneficiaries
<2000 3 18
2000-4000 7 156
4000-6000 94 26
6000-8000 208 —
8000-10000 162 —
10000-12000 79 —
12000-14000 122 —
14000-16000 45 —
16000-18000 34 —
18000-20000 12 —
>20000 34 —
Grand Total 800 200
Source: Field Survey.
Table 14: Food Expenditure of Beneficiaries and Non-Beneficiaries
Beneficiaries Period of
Association Respondents
Pre-Average Annual Food
Expenditure
Post Average Annual
Food Expenditure Expenditure CAGR %Incremental t-valuePaired Sig. (2 tailed)
1996-2000 200 1727.75 13918.10 12190.40 11.82 -31.90 .000*
2001-2005 200 2476.40 11170.90 8694.50 13.12 -42.25 .000*
2006-2010 200 3174.25 8812.60 5638.40 14.43 -32.95 .000*
2011 Onwards 200 3080.00 6687.80 3607.80 23.30 -27.50 .000*
Total 800 2614.60 10147.25 7532.70 15.67 -45.19 .000*
Non-Beneficiaries Approached for
Microfinance (Non-Association)
Respondents Annual Food Pre-Average Expenditure
Present Average Annual Food
Expenditure
Incremental
Expenditure CAGR % t-valuePaired Sig. (2 tailed)
1996-2000 50 1962.50 3188.50 1226.00 3.07 -42.87 .000*
2001-2005 50 2510.90 2718.00 207.10 0.73 -5.26 .000*
2006-2010 50 2927.30 3040.00 112.70 0.48 -4.38 .000*
2011 Onwards 50 3106.00 3133.00 27.00 0.44 -1.04 .302**
Total 200 2626.70 3019.90 393.20 1.18 -10.47 .000*
Table 13 reveals the food expenditure of beneficiaries and non-beneficiaries pre and post period in Malenadu region.
It is observed from the Table 14 that the food expenditure incurred by the beneficiaries is high as compared to that of the non-beneficiaries. It is 15.67 per cent in beneficiaries and 1.18 per cent in non-beneficiaries in the post period. To know how the microfinance programme influences the spending pattern of the beneficiaries ‘t’ tests are conducted and noted that its values are significant at 5 per cent level in case of beneficiaries in all periods of association and it is insignificant in case of non-beneficiaries in the period 2011 onwards.
Period of association and approached (non-association) analysis shows that the food expenditure incurred by all period is more or less same during pre and post period in the case of non-beneficiaries, but a remarkable change is found in case of beneficiaries. Period of association analysis shows that, beneficiaries who availed microfinance during 1996-2000 recorded the highest spending of ` 13918.10, but it is just ` 3188.50 during the post period for the non-beneficiaries. Negligible improvement can be found in case of non-beneficiaries in which the non-client from 2011 onwards period recorded only 0.44 per cent growth in their spending.
Overall, it is evident that the beneficiaries of microfinance have recorded a satisfactory increase in their incremental food expenditure as compared to the non-beneficiaries. This shows affordability of beneficiaries is much higher than non-beneficiaries.
Comparative Analysis of Personal Expenditure of Beneficiaries and Non-Beneficiaries
To find out the difference in personal expenditure of the beneficiaries with the non-beneficiaries of microfinance in the various periods, the total beneficiaries and non-beneficiaries were broadly classified into four groups viz., (1) 1996-2000 (2) 2001-2005 (3) 2006-2010 and (4) 2011 onwards.
Table 15: Personal Expenditure
Scales Beneficiaries Non-Beneficiaries
200-1200 38 52
1200-2200 449 72
2200-3200 183 66
>3200 130 10
Grand
Total 800 200
Source: Field Survey.
Table 15 reveals the personal expenditure of beneficiaries and non-beneficiaries pre and post period in Malenadu region.
Table 16: Personal Expenditure of Beneficiaries and Non-Beneficiaries
Beneficiaries Period of
Association Respondents
Pre-Average Annual Personal
expenditure
Post Average Annual Personal
expenditure
Incremental Personal
expenditure CAGR %
Paired
t-value tailed)Sig. (2
1996-2000 200 785.55 3133.60 2348.10 7.83 -30.72 .000*
2001-2005 200 505.30 2374.30 1869.00 13.50 -45.41 .000*
2006-2010 200 434.85 1922.70 1487.90 22.36 -43.48 .000*
2011 Onwards 200 1101.00 1537.60 436.60 9.09 -16.64 .000*
Total 800 706.70 2242.00 1535.30 13.19 -44.23 .000*
Non-Beneficiaries Approached for
Microfinance (Non-Association)
Respondents Annual Personal Pre-Average expenditure
Present Average Annual Personal
expenditure
Incremental Personal
expenditure CAGR %
Paired
t-value tailed)Sig. (2
1996-2000 50 337.50 568.70 231.20 3.41 -40.42 .000*
2001-2005 50 2028.70 2114.40 85.70 0.40 -2.72 .009*
2006-2010 50 2081.80 2172.00 90.20 0.54 -4.38 .000*
2011 Onwards 50 2494.80 2516.40 21.60 0.44 -1.04 0.302**
Total 200 1735.70 1842.90 107.20 1.20 -8.90 .000*
To know how the microfinance programme influences the spending pattern of the beneficiaries ‘t’ tests are conducted and noted that its values are significant at 5 per cent level in case of beneficiaries in all periods of association and it is insignificant in case of non-beneficiaries in the period 2011 onwards. It is observed from the Table 16 that the personal expenditure incurred by the beneficiaries is comparatively high with the non-beneficiaries. It is 13.19 per cent in beneficiaries and 1.20 per cent in non-beneficiaries in the post period.
The period of association and approached (non-association) analysis shows that the personal expenditure incurred by all period is more or less same during pre and post period in the case of non-beneficiaries, but a remarkable change is found in case of beneficiaries. Period of association analysis shows that, beneficiaries who availed microfinance during 1996-2000 recorded the highest spending of `
3133.60, but it is just ` 568.70 during the post period for the non-beneficiaries. Negligible improvement can be found in case of non-beneficiaries in which the non-client from 2001-2005 periods recorded only 0.40 per cent growth in their spending.
It is evident that the beneficiaries of microfinance have recorded a satisfactory increase in their incremental personal expenditure as compared to the non-beneficiaries. This shows degree of freedom
for spending and affordability of beneficiaries is much higher than non-beneficiaries.
Comparative Analysis of Expenditure on Purchase of Home Appliances by the Beneficiaries and Non-Beneficiaries
To find out the difference in expenditure on Purchase of Home Appliances by the beneficiaries with the non-beneficiaries of microfinance in the various periods, the total beneficiaries and non-beneficiaries were broadly classified into four groups viz., (1) 1996-2000 (2) 2001-2005 (3) 2006-2010 and (4) 2011 onwards.
Table 17: Home Appliances
Scales Beneficiaries Non-Beneficiaries
<1250 2 113
1250-2250 4 76
2250-3250 63 11
3250-4250 130 —
4250-5250 180 —
5250-6250 118 —
6250-7250 67 —
7250-8250 77 —
8250-9250 58 —
9250-10250 27 —
>10250 74 —
Grand Total 800 200
Source: Field Survey.
Table 18: Purchase of Home Appliances by the Beneficiaries and Non-Beneficiaries
Beneficiaries Period of
Association Respondents
Pre-Average Annual Expenditure on Home Appliances
Post Average Annual Expenditure on Home Appliances
Incremental Expenditure on Home Appliances
CAGR
% t-valuePaired Sig. (2 tailed)
1996-2000 200 1056.70 8950.90 7894.20 12.74 -34.43 .000*
2001-2005 200 1315.80 6422.60 5106.80 14.01 -41.36 .000*
2006-2010 200 1554.60 5397.70 3843.10 18.13 -37.44 .000*
2011 Onwards 200 1703.00 4012.70 2309.70 26.25 -29.34 .000*
Total 800 1407.50 6195.90 4788.40 17.78 -46.69 .000*
Non-Beneficiaries Approached for
Microfinance (Non-Association)
RespondentsPre-Average Annual Expenditure on Home Appliances
Present Average Annual Expenditure on Home Appliances
Incremental Expenditure on Home Appliances
CAGR
% t-valuePaired Sig. (2 tailed)
1996-2000 50 1097.50 1771.10 673.60 3.07 -39.26 .000*
2001-2005 50 764.00 807.00 43.00 0.57 -4.20 .000*
2006-2010 50 890.90 936.00 45.10 .63 -4.38 .000*
2011 Onwards 50 1272.40 1283.20 10.80 0.43 -1.043 .302**
Total 200 1006.30 1199.40 193.10 1.18 -9.26 .000*
Table 17 reveals the expenditure on Purchase of Home Appliances by the beneficiaries and non-beneficiaries pre and post period in Malenadu region.
It is observed from the Table 18 that the expenditure incurred by the beneficiaries is comparatively high with the non-beneficiaries. It is 17.78 per cent in beneficiaries and 1.18 per cent in non-beneficiaries in the post period. To know how the microfinance programme influences the spending pattern of the beneficiaries t tests are conducted and noted that its values are significant at 5 per cent level in case of beneficiaries in all periods of association and it is insignificant in case of non-beneficiaries in the period 2011 onwards.
The period of association and approached (non-association) analysis shows that the expenditure incurred by all period is more or less same during pre and post period in the case of non-beneficiaries, but a remarkable change is found in case of beneficiaries. Period of association analysis shows that, beneficiaries who availed microfinance during 1996-2000 recorded the highest spending of `
8950.90, but it is just ` 1771.10 during the post period for the non-beneficiaries. Negligible improvement can be found in case of non-beneficiaries in which the non-client from 2011 periods onwards recorded only 0.43 per cent growth in their spending. On the whole, it is evident that the beneficiaries of
microfinance have recorded a satisfactory increase in their incremental expenditure on home appliances as compared to the non-beneficiaries. This shows affordability of beneficiaries is much higher than the non-beneficiaries.
Comparative Analysis of Investment on Fixed Assets and Livestock by the Beneficiaries and Non-Beneficiaries
To find out the difference in Investment on Fixed Assets and Livestock by the beneficiaries with the non-beneficiaries of microfinance in the various periods, the total beneficiaries and non-beneficiaries were broadly classified into four groups viz., (1) 1996-2000 (2) 2001-2005 (3) 2006-2010 and (4) 2011 onwards.
Table 19: Fixed and Livestock
Scales Before Microfinance After Microfinance
190-1189 359 3
1190-2189 431 9
2190-3189 9 91
3190-4189 — 205
4190-5189 — 174
5190-6189 — 95
6190-7189 — 104
7190-8189 1 50
>8190 — 69
Grand Total 800 800
Source: Field Survey.
Table 20: Investment on Fixed Assets and Livestock by the Beneficiaries and Non-Beneficiaries Beneficiaries
Period of
Association Respondents
Pre-Average Annual Investment on
Assets
Post Average Annual Investment
on Assets
Incremental Investment on
Assets
CAGR
% t-valuePaired tailed)Sig. (2
1996-2000 200 1125.30 6620.70 5495.40 9.25 -29.96 .000*
2001-2005 200 1042.70 5858.00 4815.30 15.39 -48.74 .000*
2006-2010 200 1383.60 4443.90 3060.30 16.80 -37.26 .000*
2011 Onwards 200 1542.40 3750.10 2207.70 27.01 -35.06 .000*
Total 800 1273.50 5168.20 3894.70 17.11 -52.30 .000*
Non-Beneficiaries Approached for
Microfinance (Non-Association)
Respondents Pre-Average Annual Investment on Assets
Present Average Annual Investment
on Assets
Incremental Investment on
Assets CAGR % Paired t-value
Sig. (2 tailed)
1996-2000 50 968.00 1596.90 628.90 3.16 -45.81 .000*
2001-2005 50 875.10 905.00 29.90 0.31 -2.71 .009*
2006-2010 50 963.70 995.20 31.50 0.41 -4.37 .000*
2011 Onwards 50 905.70 913.20 7.50 0.42 -1.04 .302**
Total 200 928.10 1102.60 174.50 1.08 -9.04 .000*
Table 19 reveals the Investment on fixed assets and livestock by the beneficiaries and non-beneficiaries pre and post period in Malenadu region.
The calculated ‘t’ values shows that the asset creation in beneficiaries are significant ion all periods of association, but it is insignificant in non- beneficiaries in period 2011 onwards. It is evident from Table 20 that comparatively the asset creation in case of beneficiaries is the highest of 17.11 per cent, as against the non-beneficiaries whose percentage is just 1.08 per cent only. The period of association and approached (non-association) analysis shows that the Investment on fixed assets and livestock by all period is more or less same during pre and post period in the case of non-beneficiaries, but a remarkable change is found in case of beneficiaries. Period of association analysis shows that, beneficiaries who availed microfinance during 1996-2000 recorded the highest Investment on fixed assets and livestock of ` 5495.40, but it is just ` 628.90 during the post period for the non-beneficiaries. Negligible improvement can be found in case of non-beneficiaries in which the non-client from 2001-2005 periods recorded only 0.31 per cent growth in their investment.
Acquisition of assets is an indication of capital formation and also improvement in the living standards of clients. Availability of credit played an important role in the acquisition of assets. The
proportion of sample client acquiring assets with microfinance support is increased by 17.11 per cent.
Comparative Analysis of Educational Expenditure of Beneficiaries and Non-Beneficiaries
To find out the difference in Educational Expenditure ofthe beneficiaries with the non-beneficiaries of microfinance in the various periods, the total beneficiaries and non-beneficiaries were broadly classified into four groups viz., (1) 1996-2000 (2) 2001-2005 (3) 2006-2010 and (4) 2011 onwards.
Table 21: Educational Expenditure
Scales Beneficiaries Non-Beneficiaries
<190 7 —
190-690 121 89
690-1190 382 90
1190-1690 181 21
1690-2190 75 —
2190-2690 33 —
2690-3190 1 —
Grand Total 800 200
Source: Field Survey.
Table 21 reveals the Educational expenditure of beneficiaries and non-beneficiaries pre and post period in Malenadu region.
Table 22: Educational Expenditure of Beneficiaries and Non-Beneficiaries Beneficiaries
Period of
Association Respondents
Pre-Average Annual Educational
Expenditure
Post Average Annual Educational
Expenditure
Incremental Educational
Expenditure CAGR % Paired t-value
Sig. (2 tailed)
1996-2000 200 331.30 1480.20 1148.90 5.37 -25.05 .000*
2001-2005 200 323.20 1264.60 941.40 11.71 -38.13 .000*
2006-2010 200 370.90 993.70 622.80 13.87 -30.34 .000*
2011 Onwards 200 285.60 762.60 477.00 31.27 -30.30 .000*
Total 800 327.75 1125.20 797.40 15.56 -46.24 .000*
Non-Beneficiaries Approached for
Microfinance (Non-Association)
Respondents Annual Educational Pre-Average Expenditure
Present Average Annual Educational
Expenditure
Incremental Educational
Expenditure CAGR % Paired t-value
Sig. (2 tailed)
1996-2000 50 274.50 429.20 154.70 2.77 -45.09 .000*
2001-2005 50 671.50 705.80 34.30 0.51 -2.72 .009*
2006-2010 50 972.70 1008.80 36.10 0.46 -4.38 .000*
2011 Onwards 50 877.90 886.60 8.70 0.54 -1.04 .302**
Total 200 699.10 757.60 58.50 1.07 -9.88 .000*
To know how the microfinance programme influences the spending pattern of the beneficiaries ‘t’ tests are conducted and noted that its values are significant at 5 per cent level in case of beneficiaries in all periods of association and it is insignificant in case of non-beneficiaries in the period 2011 onwards. It is observed from the Table 22 that the Educational expenditure incurred by the beneficiaries is comparatively high with the non-beneficiaries. It is 15.56 per cent in beneficiaries and 1.07 per cent in non-beneficiaries in the post period. The period of association and approached (non-association) analysis shows that the Educational expenditure incurred by all period is more or less same during pre and post period in the case of non-beneficiaries, but a remarkable change is found in case of beneficiaries. Period of association analysis shows that, beneficiaries who availed microfinance during 1996-2000 recorded the highest spending of `
1480.20, but it is just ` 429.20 during the post period for the non-beneficiaries. Negligible improvement can be found in case of non-beneficiaries in which the non-client from 2006-2010 periods recorded only 0.46 per cent growth in their spending.
On the whole, it is evident that the beneficiaries of microfinance have recorded a satisfactory increase in their incremental Educational expenditure as compared to the non-beneficiaries. This shows affordability of beneficiaries is much higher than non-beneficiaries.
CONCLUSION
The SHG can contribute to changes in economic conditions, social status, decision making and increases women in outdoor activities. SHG not only changes the outer form of a community or a society, but also the social institutions as well as ideas of the people living in the society.
RECOMMENDATIONS
Based on the finding made during the course of study, the following suggestions are made for further improvement in the performance of SHGs and for the upliftment of women socially and economically.
(a) Government can take necessary steps to sell the SHG products through civil supplies, for example, good products may be sold in ration shops and agricultural depots.
(b) Banks have to conduct the SHGs training at every Panchayat level, which will be convenient to attend by the members of SHGs at their local place.
(c) Women’s were underpaid for equal work; women were locked in low-paid jobs; stereotypes determine the appropriate roles for women in the economy; women lack access to markets for inputs and outputs if their mobility is constrained due to social norms. Government should come with a special policy to create a separate cell for solving problems of Women SHG.
(d) Agriculture is the predominant sector for microfinance beneficiaries of the Malenadu region, which employs nearly 47.125 per cent of the total respondents. Thus, from a risk point of view, we need to recognize that there is a subtle difference between microfinance for agriculture and microfinance for the agricultural operations of poor households with diversified sources of income.
(e) The banks need not insist on the members to submit ‘No Dues’ certificate in order to get new loans. Instead, they may go by taking into account the nature of activity and the progress of the group.
(f) Self-Help Group should not only concentrate on the growth of the group, but should also show active involvement on the social issues and other essential issues like health, sanitation etc. to develop the entire village. (g) Block and bank officials should make surprise
and frequent visit to the respondents to ensure the proper utilization of bank loan on various economic activities.
(i) There is a serious need to introduce micro insurance products and bring together various players in the insurance sector for supporting pilots for development of composite insurance products, which cater for life, health, crops, assets and accidents. (j) Banks who thoroughly track those who
choose to leave the program are most likely to identify and address problems clients have with the Banks services. They may conduct regular surveys of clients’ satisfaction.
REFERENCES
Angel. A Anila, 2012. A Study On Socio-Economic Condition Of Self Help Group Members In Tirunelveli District, Tamil Nadu ZENITH International Journal of Business Economics & Management Research,2(2): 216-224.
Asad Kamran Ghalib, 2009. Impact Assessment Research Centre (IARC), University Of Manchester, IARC Working Papers Series No. 24/2009.
Morduch, J. and Haley, B. 2001. Analysis of the Effects of Microfinance on Poverty Reduction, CIDA, Ottawa.
Mula G. and Sarker, S.C. 2013. Impact of microfinance on women empowerment: An economic analysis from Eastern India, African Journal of Agricultural Research, 8(45): 5673-5684.
Nasim Shah Shirazi, 2012. Targeting and Socio-Economic Impact of Microfinance: A Case Study of Pakistan, Islamic Economic Studies,20(2): 1-28.
Rao, Mamta 2008. Law relating to women and children (3rd ed.). Lucknow: Eastern Book Co. ISBN9788170121329. women and the protection provided under various criminal, personal and labour laws in India.
Reji, E.M. 2009. Socio-Economic Impact of Microfinance: A Study of Neighbourhood Groups (NHGs) in Nilambur Block of Malappuram District, Kerala, Indian Journal of Agricultural Economics, 64(2): 246 – 258.
Sivachithappa, K. 2013. Impact of Micro Finance on Income Generation and Livelihood of Members of Self Help Groups – A Case Study of Mandya District, India, Procedia- Social and Behavioral Sciences, 91: 228 – 240.