WHAT’S KNOWN ON THIS SUBJECT: Short sleep may be an adolescent obesity risk factor, but most evidence is from cross-sectional studies. Three longitudinal studies have investigated the association between sleep duration and adolescent obesity,
finding mixed results.
WHAT THIS STUDY ADDS: Shorter sleep was associated with increases in BMI from age 14 to 18, especially at the upper tail of the BMI distribution. Increasing daily sleep to 10 hours per day could help to prevent adolescent obesity.
abstract
OBJECTIVES: Short sleep has been associated with adolescent obe-sity. Most studies used a cross-sectional design and modeled BMI categories. We sought to determine if sleep duration was associated with BMI distribution changes from age 14 to 18.
METHODS:Adolescents were recruited from suburban high schools in Philadelphia when entering ninth grade (n= 1390) and were followed-up every 6 months through 12th grade. Height and weight were self-reported, and BMIs were calculated (kg/m2). Hours of sleep were self-reported. Quantile regression was used to model the 10th, 25th, 50th, 75th, and 90th BMI percentiles as dependent variables; study wave and sleep were the main predictors.
RESULTS:BMI increased from age 14 to 18, with the largest increase observed at the 90th BMI percentile. Each additional hour of sleep was associated with decreases in BMI at the 10th (–0.04; 95% confidence interval [CI]: –0.11, 0.03), 25th (–0.12; 95% CI: –0.20, –0.04), 50th (–0.15; 95% CI: –0.24, –0.06), 75th (–0.25; 95% CI: –0.38, –0.12), and 90th (–0.27; 95% CI: -0.45, -0.09) BMI percentiles. The strength of the association was stronger at the upper tail of the BMI distribution. Increasing sleep from 7.5 to 10.0 hours per day at age 18 predicted a reduction in the proportion of adolescents.25 kg/m2 by 4%.
CONCLUSIONS:More sleep was associated with nonuniform changes in BMI distribution from age 14 to 18. Increasing sleep among adoles-cents, especially those in the upper half of the BMI distribution, may help prevent overweight and obesity.Pediatrics2013;131:e1428–e1434
AUTHORS:Jonathan A. Mitchell, PhD,aDaniel Rodriguez, PhD,bKathryn H. Schmitz, PhD,aand Janet Audrain-McGovern, PhDb
Departments ofaBiostatistics and Epidemiology, andbPsychiatry, University of Pennsylvania, Philadelphia, Pennsylvania
KEY WORDS
adolescence, longitudinal study, obesity, sleep
ABBREVIATIONS
CI—confidence interval
MVPA—moderate-to-vigorous physical activity
Dr Mitchell conceived and designed the study, analyzed the data, drafted the manuscript, and approved thefinal manuscript as submitted; Dr Rodriguez manages and maintains the data set that was used in the current study, revised the manuscript, interpreted the data, and approved thefinal manuscript as submitted; Dr Schmitz reviewed and revised the manuscript, interpreted the data, and approved thefinal manuscript as submitted; and Dr Audrain-McGovern acquired the data, reviewed and revised the manuscript, interpreted the data, and approved thefinal submitted manuscript.
The content is solely the responsibility of the authors and does not necessarily represent the official views of the National Cancer Institute or the National Institutes of Health.
www.pediatrics.org/cgi/doi/10.1542/peds.2012-2368
doi:10.1542/peds.2012-2368
Accepted for publication Jan 3, 2013
Address correspondence to Jonathan A. Mitchell, PhD, Department of Biostatistics and Epidemiology, University of Pennsylvania, 423 Guardian Dr, 222 Blockley Hall, Philadelphia, PA 19104; E-mail: [email protected]
PEDIATRICS (ISSN Numbers: Print, 0031-4005; Online, 1098-4275).
Copyright © 2013 by the American Academy of Pediatrics
FINANCIAL DISCLOSURE:The authors have indicated they have nofinancial relationships relevant to this article to disclose.
The untoward psychosocial and phys-ical consequences of adolescent obe-sity have been well documented.1,2
Unfortunately, the prevalence of ado-lescent obesity has more than tripled over the past 4 decades (5.2% to 18.4%).3,4The rise in obesity has been
paralleled by decreases in the amount of time that adolescents have spent sleeping,5 leading to the hypothesis
that short sleep duration has con-tributed to the rise in adolescent obesity.
Cross-sectional studies support an as-sociation between less sleep and ado-lescent obesity,6–8 but longitudinal
studies are needed to establish tem-poral precedence. Three longitudinal studies have investigated the relation-ship between sleep duration and ado-lescent BMI.9–11 Two of those studies
found evidence that less sleep led to an increased likelihood of being classified as obese at follow-up,10,11 whereas 1
study found no association.9 These
studies only measured BMI at 2 time points and categorized participants into nonobese and obese groups based on BMI. Such categorization of a con-tinuous variable reduces statistical power and considers those in close proximity to a category cutoff, but on opposite sides, as being very different, as opposed to being very similar.12
Longitudinal studies that incorporate
.2 study waves and consider changes in the entire BMI distribution will fur-ther our understanding of the re-lationship between sleep duration and the development of adolescent over-weight and obesity. We used quantile regression because it allows for the investigation of predictors (eg, sleep) across the distribution of an outcome variable (eg, BMI).13The
purpose of our study was to de-termine if sleep duration was asso-ciated with changes across the BMI distribution, over 8 study waves, from age 14 to 18.
METHODS
Participants
The participants were recruited from 4 suburban high schools in Philadelphia, when they were entering ninth grade. We identified 1517 adolescents, but 30 were ineligible to participate due to having a special classroom placement or not being a native English speaker. The 1487 eligible adolescents were in-vited to participate, and of those, 1478 (99%) provided parental consent and were enrolled into the study. The base-line survey was completed by 1429 (97%) of the participants enrolled; reasons for not completing the survey included being absent from school (n= 30) and withdrawing from the study (n= 19). The University of Pennsylvania Institutional Review Board granted ethical approval for the study.
BMI
The participants self-reported their height and weight, from which BMI was calculated (kg/m2). The height and weight data were screened for high and low values and were compared with Center for Disease Control and Prevention growth chart data.14There
is high correlation between adolescent BMI calculated from self-report and measured height and weight.15–17Also,
similar measures of association were observed between obesity risk factors and BMI when calculated from self-reported and measured height and weight.18
Sleep
Typical duration of sleep on a school night (Sunday to Thursday) and on a weekend night (Fri and Sat) were self-reported by the participants, to the nearest 15 minutes. Past studies have shown that adolescents are able to recall their typical duration of sleep.19
The sleep times reported were screened for low and high values, and
if a participant reported sleep times that were 3 standard deviations above or below the age and gender-specific mean hours of sleep, then their sleep data were coded as missing. The av-erage time spent sleeping per day was calculated for each participant [(school night35) + (weekend night
32)/7].8
Covariates
It has been shown in previous studies that BMI and sleep duration differ by gender,3,20 race,3,20 and
socioecono-mic status.20,21 Therefore, these
de-mographic variables were included in the current study as covariates. Ma-ternal education was used as a marker of socioeconomic status. Physical ac-tivity has been associated with lower BMI in adolescents,22and it has been
suggested that more physical activity is associated with more sleep.23 For
these reasons, self-reported time spent in moderate-to-vigorous physical activ-ity (MVPA) was included as a covariate. It has been observed that more time spent watching television and playing video games is associated with higher BMI in adolescents,24and data suggest
that more screen time is associated with less sleep.23 For these reasons,
self-reported screen time (television/ video and video games) was included as a covariate.
Statistical Analysis
The means and standard deviations are presented for the continuous variables, and the frequencies and percentages are provided for the categorical vari-ables. Longitudinal quantile regression was used to address the aim of our study.25Quantile regression is related
to ordinary least squares regression but can model any point in the dis-tribution of a continuous outcome variable, not just the mean.13,25
Fur-thermore, the dependent variable is modeled as a continuous variable, and
fi
are interpreted in the exact same way as those from ordinary least squares regression. In the current study, the coefficients represent the change in BMI for every unit change in the in-dependent variable; study wave and sleep were modeled as the main in-dependent variables. Study wave was coded 0, 1, 2, 3, 4, 5, 6, and 7 to repre-sent each 6-month follow-up, and sleep was modeled as a continuous variable (hours per day). The coefficients at the 10th, 25th, 50th, 75th, and 90th BMI percentiles are presented. Model 1 included study wave and gender to describe the change in the BMI distri-bution from age 14 to 18. In model 2, sleep was added as an independent variable to determine if sleep was as-sociated with changes in the BMI dis-tribution from age 14 to 18. Race and maternal education were then added as independent variables (model 3), self-reported MVPA was then added as an independent variable (model 4), and
finally screen time was added as an independent variable (model 5). The purpose of models 3, 4, and 5 was to determine if any association between sleep and change in BMI remained af-ter their inclusion in the model. The data were arranged in the long for-mat; to account for the repeated mea-sures on the participants, afirst-order autoregressive correlation structure was modeled, and 95% confidence intervals (CIs) were estimated from 500 bootstrap samples.25All analyses
were conducted by using Stata 12.1 (StataCorp LP, College Station, TX).
RESULTS
Of those enrolled 1336 provided valid BMI data at baseline (93%), and 1089 (82%) provided BMI data at the eighth study wave (Table 1). Our sample had equal proportions of male and female participants, most of the sample was
a high school education or greater (.70%; Table 1). The average hours of sleep was ∼8 hours per day for both male and female participants at base-line, and this decreased to an average of 7.5 hours per day at the eighth study wave (Table 1).
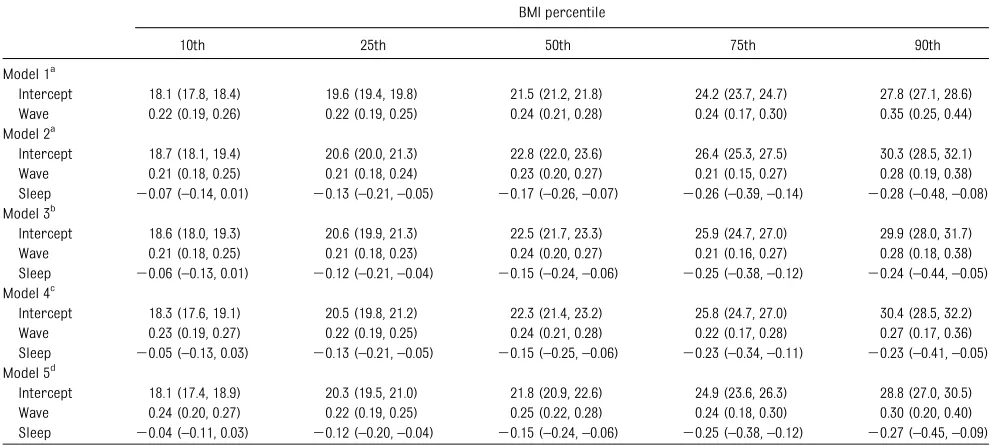
The average BMI at baseline was 22.2 kg/m2for the boys and 21.7 kg/m2for the girls (Table 1). BMI increased on average to 24.1 kg/m2for the boys and 23.0 kg/m2 for the girls at the eighth study wave (Table 1). Changes across the BMI distribution are described in Table 2 (model 1). At the 50th BMI per-centile, BMI increased at a rate of 0.24 kg/m2every 6 months. In comparison, increases in BMI were lower at the 10th BMI percentile (0.22 kg/m2 every 6 months) and greater at the 90th BMI percentile (0.35 kg/m2every 6 months).
Each additional hour of sleep was as-sociated with a reduction in BMI, at all BMI percentiles (Table 2, model 2). The strength of the association was weaker at the lower tail of the BMI distribution, compared with the upper tail of the BMI distribution (Table 2, model 2). For ex-ample, each additional hour of sleep was associated with a 0.07 kg/m2 re-duction in BMI at the 10th BMI percen-tile, compared with a 0.17 kg/m2 reduction in BMI at the 50th BMI per-centile, and a 0.28 kg/m2reduction in BMI at the 90th BMI percentile (Table 2, model 2). The associations at all BMI percentiles remained similar after adjusting for race and maternal edu-cation (Table 2, model 3), self-reported MVPA (Table 2, model 4), and screen time (Table 2, model 5).
To aid the interpretation of the
coef-ficients presented in Table 2, BMI dis-tributions at wave 0 and wave 7 are illustrated in Fig 1. The dashed line represents the predicted BMI distri-bution if all adolescents accumulated 8.1 hours of sleep at age 14 and 7.5
tion if all adolescents accumulated 10.0 hours of sleep per day at each age. The stronger negative association between sleep duration and BMI at the upper tail of the distribution can be observed, which translates to a leftward shift at the upper tail of the BMI distribution with more sleep (Fig 1).
DISCUSSION
The current study was designed to in-vestigate the effect of sleep duration on changes in BMI from mid to late ado-lescence. Importantly, we observed a large sample of adolescents over 8 study waves and considered the entire BMI distribution. We found that less sleep was associated with greater increases in BMI from age 14 to 18, but the association was not uniform across the BMI distribution. Less sleep was more strongly associated with increa-ses in BMI at the upper tail, compared with the lower tail, of the distribution. This provides strong evidence that sleep duration is an important ado-lescent obesity risk factor and that it is especially important to ensure that adolescents in the upper half of the BMI distribution at age 14 accumulate
suf-ficient hours of sleep and also maintain sufficient hours of sleep throughout adolescence. It is recommended that adolescents sleep for 8.5 to 10.5 hours per day.5 On the basis of our results,
sleeping for 10 hours per day versus
,8 hours per day could reduce the proportion of adolescents with a BMI
$25 by 3% at age 14 and by 4% to 6% at age 18. The prevalence of adolescent obesity increased by 7.5% from 1991 to 20083,4; at the population level, a 4%
reduction in the proportion of adoles-cents with a BMI $25 translates to
∼500 000 fewer 14- to 18-year-olds who are overweight.26Therefore, increasing
adolescence could have a significant impact on obesity prevention.
Two smaller longitudinal studies re-ported associations between less sleep at baseline and an increased likelihood
of being classified as obese at follow-up.10,11 Seegers et al observed 1916
preadolescents from age 10 to 13 and found that those in the low sleep tra-jectory group were 3 times more likely
to be obese, compared with those in the high sleep trajectory group.10
Sim-ilarly, Silva et al recruited 304 children (aged 6–12) who were followed-up 5 years later (aged 10 to 18), and
TABLE 1 Demographics, Sleep Duration, and Anthropometric Data by Study Wave
Wave 1 Wave 2 Wave 3 Wave 4 Wave 5 Wave 6 Wave 7 Wave 8
Sample size 1336 1261 1067 1076 1019 1045 971 1089
Age, mean (SD), y 14.3 (0.56) 14.8 (0.59) 15.3 (0.53) 15.7 (0.55) 16.3 (0.55) 16.8 (0.55) 17.3 (0.54) 17.7 (0.56) Gender,n(%)
Female 666 (50.0) 631 (50.1) 544 (51.1) 542 (50.4) 520 (51.1) 531 (50.9) 446 (46.0) 562 (51.7) Male 667 (50.0) 629 (49.9) 521 (48.9) 533 (49.6) 498 (48.9) 513 (49.1) 523 (54.0) 525 (48.3) Race,n(%)
Black 187 (14.0) 169 (13.4) 138 (12.9) 138 (12.8) 123 (12.1) 131 (12.5) 128 (13.2) 135 (12.4) White 996 (74.6) 958 (76.0) 805 (75.5) 812 (75.5) 765 (75.1) 789 (75.5) 737 (75.9) 823 (75.6) Other 153 (11.5) 134 (10.6) 124 (11.6) 126 (11.7) 131 (12.9) 125 (12.0) 106 (10.9) 131 (12.0) Maternal education,n(%)
High school education or greater 936 (70.8) 880 (70.6) 765 (72.6) 765 (72.0) 719 (71.2) 730 (70.6) 686 (71.5) 764 (70.9) Less than high school education 387 (29.3) 367 (29.4) 289 (27.4) 298 (28.0) 288 (28.6) 304 (29.4) 273 (28.5) 314 (29.1) Sleep, mean (SD), hr/d
Male 8.13 (1.69) 8.01 (1.75) 7.93 (1.75) 7.94 (1.62) 7.93 (1.70) 7.82 (1.58) 7.72 (1.51) 7.54 (1.61) Female 8.16 (1.68) 7.98 (1.75) 7.95 (1.65) 7.82 (1.64) 7.69 (1.64) 7.67 (1.59) 7.65 (1.55) 7.52 (1.59) Height, mean (SD), m
Male 1.69 (0.09) 1.72 (0.08) 1.73 (0.08) 1.74 (0.08) 1.75 (0.08) 1.76 (0.08) 1.76 (0.08) 1.76 (0.08) Female 1.61 (0.07) 1.62 (0.07) 1.62 (0.07) 1.63 (0.07) 1.63 (0.08) 1.63 (0.07) 1.64 (0.07) 1.63 (0.07) Wt, mean (SD), kg
Male 63.9 (13.9) 67.0 (14.3) 68.7 (13.7) 69.9 (13.8) 71.9 (14.5) 73.4 (14.5) 74.7 (14.6) 75.3 (14.5) Female 56.6 (10.4) 58.2 (10.9) 58.2 (10.2) 58.8 (10.3) 60.0 (11.1) 60.8 (10.9) 64.4 (10.6) 61.4 (11.0) BMI, mean (SD)
Male 22.2 (4.04) 22.6 (4.11) 22.9 (4.02) 23.0 (4.08) 23.3 (4.22) 23.6 (4.20) 24.0 (4.39) 24.1 (4.28) Female 21.7 (3.67) 22.1 (3.85) 22.0 (3.44) 22.1 (3.47) 22.5 (3.66) 22.8 (3.70) 23.9 (3.87) 23.0 (3.73)
TABLE 2 Changes in the BMI Distribution From Age 14 to 18 and the Influence of Sleep BMI percentile
10th 25th 50th 75th 90th
Model 1a
Intercept 18.1 (17.8, 18.4) 19.6 (19.4, 19.8) 21.5 (21.2, 21.8) 24.2 (23.7, 24.7) 27.8 (27.1, 28.6) Wave 0.22 (0.19, 0.26) 0.22 (0.19, 0.25) 0.24 (0.21, 0.28) 0.24 (0.17, 0.30) 0.35 (0.25, 0.44) Model 2a
Intercept 18.7 (18.1, 19.4) 20.6 (20.0, 21.3) 22.8 (22.0, 23.6) 26.4 (25.3, 27.5) 30.3 (28.5, 32.1) Wave 0.21 (0.18, 0.25) 0.21 (0.18, 0.24) 0.23 (0.20, 0.27) 0.21 (0.15, 0.27) 0.28 (0.19, 0.38) Sleep 20.07 (–0.14, 0.01) 20.13 (–0.21,–0.05) 20.17 (–0.26,–0.07) 20.26 (–0.39,–0.14) 20.28 (–0.48,–0.08) Model 3b
Intercept 18.6 (18.0, 19.3) 20.6 (19.9, 21.3) 22.5 (21.7, 23.3) 25.9 (24.7, 27.0) 29.9 (28.0, 31.7) Wave 0.21 (0.18, 0.25) 0.21 (0.18, 0.23) 0.24 (0.20, 0.27) 0.21 (0.16, 0.27) 0.28 (0.18, 0.38) Sleep 20.06 (–0.13, 0.01) 20.12 (–0.21,–0.04) 20.15 (–0.24,–0.06) 20.25 (–0.38,–0.12) 20.24 (–0.44,–0.05) Model 4c
Intercept 18.3 (17.6, 19.1) 20.5 (19.8, 21.2) 22.3 (21.4, 23.2) 25.8 (24.7, 27.0) 30.4 (28.5, 32.2) Wave 0.23 (0.19, 0.27) 0.22 (0.19, 0.25) 0.24 (0.21, 0.28) 0.22 (0.17, 0.28) 0.27 (0.17, 0.36) Sleep 20.05 (–0.13, 0.03) 20.13 (–0.21,–0.05) 20.15 (–0.25,–0.06) 20.23 (–0.34,–0.11) 20.23 (–0.41,–0.05) Model 5d
Intercept 18.1 (17.4, 18.9) 20.3 (19.5, 21.0) 21.8 (20.9, 22.6) 24.9 (23.6, 26.3) 28.8 (27.0, 30.5) Wave 0.24 (0.20, 0.27) 0.22 (0.19, 0.25) 0.25 (0.22, 0.28) 0.24 (0.18, 0.30) 0.30 (0.20, 0.40) Sleep 20.04 (–0.11, 0.03) 20.12 (–0.20,–0.04) 20.15 (–0.24,–0.06) 20.25 (–0.38,–0.12) 20.27 (–0.45,–0.09)
Data presented are coefficients and 95% CIs in parentheses. Wave is coded 0, 1, 2, 3, 4, 5, 6, and 7 to represent each 6-month follow-up, and thus the wave coefficients are interpreted as change in BMI per 6 months. Sleep is modeled in hours per day, and thus the sleep coefficients are interpreted as the change in BMI for each additional hour spent sleeping.
aAdjusted for gender.
bAdjusted for gender, race, and maternal education. cAdjusted for gender, race, maternal education, and MVPA.
dAdjusted for gender, race, maternal education, MVPA, and screen time.
observed that sleeping for,7.5 hours per day at baseline, compared with
$9.0 hours per day at baseline, was associated with a threefold increased likelihood of being obese at follow-up.11
Ourfindings are consistent with these
findings and extend the research by following adolescents over a longer time period and studying the entire BMI distribution. However, 1 study reported a null association between sleep duration and BMI defined obe-sity at 2-year follow-up in a sample of 13 568 adolescents.9 It would be of
interest to study the BMI distribution in that sample of adolescents to de-termine if the association between sleep duration and changes in BMI
were uniform across the BMI distri-bution.
It is important to note that the associ-ations we observed between sleep du-ration and BMI remained after adjusting for screen time and physical activity. This implies that more sleep could contribute to the prevention of ado-lescent obesity, even if the screen time and physical activity guidelines are met.27,28It is a limitation that we were
not able to include any measure of di-etary intake in our study, and we can-not exclude the possibility that our
findings are explained, in part, by increases in caloric intake with less sleep.29 However, the association
be-tween less sleep and adolescent obesity
reported by Silva et al was adjusted for caloric intake,11 which implies that
more sleep could contribute to the prevention of adolescent obesity, even for those who consume an excess of calories. It has been proposed that less sleep increases adolescent BMI by de-creasing physical activity, as a conse-quence of fatigue and changes in hormones that regulate energy ex-penditure,30,31 and increasing energy
intake, as a consequence of more eat-ing opportunities and changes in hor-mones that regulate energy intake.30,31
It is therefore surprising that adjusting for the energy balance variables did not attenuate the associations ob-served between sleep duration and
changes in adolescent BMI. Future studies could adjust for objectively measured sleep duration, physical activity, and sedentary behavior, as well as for ca-loric intake, to investigate this mecha-nism in more detail.
Alternatively, the association we ob-served could be explained by short sleep disrupting circadian rhythms.32,33
Adolescents with short sleep may be more likely to be awake at night and be exposed to light during the dark cycle. This could affect the central clock, which in turn could affect the periph-eral clock in adipose tissue, leading to abnormal timing of adipocyte differ-entiation and the release of adipo-kines.32,33In support, a cross-sectional
study observed that adolescents going to bed late tended to have higher BMIs, independent of sleep duration, com-pared with adolescents who go to bed early.34To test if this circadian rhythm
hypothesis explains the relationship between sleep duration and adolescent weight, future studies could specifi -cally control for evening electronic screen exposure, and evening food in-take; and investigate if variants in clock genes (eg, CLOCK and BAML1) modify the association between sleep duration and adolescent BMI.
Educating adolescents on the benefits of sleep and informing adolescents of
sleep hygiene practices has shown little impact on adolescent sleep duration. A review of school-based sleep education programs found no evidence that such education led to increases in sleep duration among adolescents.35
Alter-natively, schools could help to increase adolescent sleep duration by delaying the start to the school day. Owen et al reported a 45-minute per day increase in sleep by delaying the start of the school day from 8:00 to 8:30.36Outside
of school, observational data suggest that modifying the bedroom environ-ment, such as removing electronic media from the bedroom, could be im-portant for increasing adolescent sleep duration,37although no studies appear
to have experimentally tested whether these changes lead to increases in sleep among adolescents. This is an area of research that needs to be further de-veloped to help determine the best approaches for increasing sleep dura-tion among adolescents.
Our longitudinal study has several strengths. We followed adolescents over 8 study waves, whereas previous longitudinal studies included only 2 study waves.9–11Our analytical method
allowed for the investigation of sleep duration at the tails of the BMI distri-bution, and we were able to determine how sleep duration affected the shape
of the BMI distribution. Our study also has limitations. Sleep duration was self-reported, and we were not able to measure sleep quality. Our partic-ipants self-reported their height and weight, and replication of ourfindings using BMI calculated from objectively measured height and weight is needed. If these self-report data can be cor-roborated with objective monitoring data, this would help to establish sleep duration as an important adolescent obesity risk factor. We adjusted for key covariates, but residual confounding may remain due to missing covariates, such as caloric intake. Our participants were sampled from a single region in the United States, and attempts to replicate our findings in other pop-ulations of adolescents are needed.
In summary, we conducted a longitudi-nal quantile regression alongitudi-nalysis to as-sess the association between sleep duration and BMI. Using this novel method, we found that less sleep was associated with greater increases in adolescent BMI from age 14 to 18, with the association strongest at the upper tail of the BMI distribution. This is an important finding and suggests that increasing sleep duration, especially for those in the upper half of the BMI distribution, could help to reduce the prevalence of adolescent obesity.
REFERENCES
1. Daniels SR. Complications of obesity in children and adolescents.Int J Obes (Lond). 2009;33(suppl 1):S60–S65
2. Bjørge T, Engeland A, Tverdal A, Smith GD. Body mass index in adolescence in relation to cause-specific mortality: a follow-up of 230,000 Norwegian adolescents.Am J Epi-demiol. 2008;168(1):30–37
3. Ogden CL, Carroll MD, Kit BK, Flegal KM. Prevalence of obesity and trends in body mass index among US children and adoles-cents, 1999–2010.JAMA. 2012;307(5):483–490
4. Troiano RP, Flegal KM, Kuczmarski RJ, Campbell SM, Johnson CL. Overweight
prevalence and trends for children and adolescents. The National Health and Nu-trition Examination Surveys, 1963 to 1991.
Arch Pediatr Adolesc Med. 1995;149(10): 1085–1091
5. Matricciani LA, Olds TS, Blunden S, Rigney G, Williams MT. Never enough sleep: a brief history of sleep recommendations for children.Pediatrics. 2012;129(3):548–556
6. Chen X, Beydoun MA, Wang Y. Is sleep du-ration associated with childhood obesity? A systematic review and meta-analysis.
Obesity (Silver Spring). 2008;16(2):265– 274
7. Knutson KL, Lauderdale DS. Sleep duration and overweight in adolescents: self-reported sleep hours versus time diaries.Pediatrics. 2007;119(5):e1056–e1062
8. Garaulet M, Ortega FB, Ruiz JR, et al. Short sleep duration is associated with increased obesity markers in European adolescents: effect of physical activity and dietary habits. The HELENA study.Int J Obes (Lond). 2011;35 (10):1308–1317
9. Calamaro CJ, Park S, Mason TB, et al. Shortened sleep duration does not predict obesity in adolescents.J Sleep Res. 2010;19 (4):559–566
a prospective longitudinal study in pre-adolescence. Am J Epidemiol. 2011;173 (6):621–629
11. Silva GE, Goodwin JL, Parthasarathy S, et al. Longitudinal association between short sleep, body weight, and emotional and learning problems in Hispanic and Cauca-sian children.Sleep. 2011;34(9):1197–1205
12. Altman DG, Royston P. The cost of dichoto-mising continuous variables.BMJ. 2006;332 (7549):1080
13. Hao L, Naimen DQ. Quantile Regression. Thousand Oaks, CA: Sage; 2007
14. Kuczmarski RJ, Ogden CL, Guo SS, et al. 2000 CDC Growth Charts for the United States: methods and development. Vital Health Stat 11. 2002; (246):1–190
15. Elgar FJ, Roberts C, Tudor-Smith C, Moore L. Validity of self-reported height and weight and predictors of bias in adolescents. J Adolesc Health. 2005;37(5):371–375
16. Tokmakidis SP, Christodoulos AD, Mtzouranis NI. Validity of self-reported an-thropometric values used to assess body mass index and estimate obesity in Greek school children. J Adolesc Health. 2007;40 (4):305–310
17. Goodman E, Hinden BR, Khandelwal S. Ac-curacy of teen and parental reports of obesity and body mass index. Pediatrics. 2000;106(1 pt 1):52–58
18. McAdams MA, Van Dam RM, Hu FB. Com-parison of self-reported and measured BMI as correlates of disease markers in US adults.
Obesity (Silver Spring). 2007;15(1):188–196
19. Wolfson AR, Carskadon MA, Acebo C, et al. Evidence for the validity of a sleep habits
20. Blair PS, Humphreys JS, Gringras P, et al. Childhood sleep duration and associated demographic characteristics in an English cohort.Sleep. 2012;35(3):353–360
21. Stamatakis E, Wardie J, Cole TJ. Childhood obesity and overweight prevalence trends in England: evidence for growing socio-economic disparities. Int J Obes. 2010;34 (1):41–47
22. Kimm SY, Glynn NW, Obarzanek E, et al. Relation between the changes in physical activity and body-mass index during ado-lescence: a multicentre longitudinal study.
Lancet. 2005;366(9482):301–307
23. Foti KE, Eaton DK, Lowry R, McKnight-Ely LR. Sufficient sleep, physical activity, and sed-entary behaviors.Am J Prev Med. 2011;41 (6):596–602
24. Chinapaw MJ, Proper KI, Brug J, van Mechelen W, Singh AS. Relationship be-tween young peoples’sedentary behaviour and biomedical health indicators: a sys-tematic review of prospective studies.Obes Rev. 2011;12(7):e621–e632
25. Wei Y, Pere A, Koenker R, He X. Quantile regression methods for reference growth charts.Stat Med. 2006;25(8):1369–1382
26. Howden LM, Meyer JA. Age and sex compo-sition: 2010. May 2011. Available at: www. census.gov/prod/cen2010/briefs/c2010br-03. pdf. Accessed July 31, 2012
27. American Academy of Pediatrics, Commit-tee on Public Education. American Academy of Pediatrics: Children, adolescents, and television.Pediatrics. 2001;107(2):423–426
28. Physical Activity Guidelines Advisory Com-mittee.Physical Activity Guidelines Advisory
2008
29. Weiss A, Xu F, Storfer-Isser A, Thomas A, Ievers-Landis CE, Redline S. The association of sleep duration with adolescents’fat and carbohydrate consumption. Sleep. 2010;33 (9):1201–1209
30. Taheri S. The link between short sleep du-ration and obesity: we should recommend more sleep to prevent obesity. Arch Dis Child. 2006;91(11):881–884
31. Knutson KL, Van Cauter E. Associations be-tween sleep loss and increased risk of obesity and diabetes. Ann N Y Acad Sci. 2008;1129:287–304
32. Bass J, Takahashi JS. Circadian integration of metabolism and energetics. Science. 2010;330(6009):1349–1354
33. Johnston JD, Frost G, Otway DT. Adipose tissue, adipocytes and the circadian timing system.Obes Rev. 2009;10(suppl 2):52–60
34. Olds TS, Maher CA, Matricciani L. Sleep duration or bedtime? Exploring the re-lationship between sleep habits and weight status and activity patterns.Sleep. 2011;34 (10):1299–1307
35. Blunden SL, Chapman J, Rigney GA. Are sleep education programs successful? The case for improved and consistent research efforts.Sleep Med Rev. 2011;16(4):355–370
36. Owens JA, Belon K, Moss P. Impact of delaying school start time on adolescent sleep, mood, and behavior. Arch Pediatr Adolesc Med. 2010;164(7):608–614
DOI: 10.1542/peds.2012-2368 originally published online April 8, 2013;
2013;131;e1428
Pediatrics
Audrain-McGovern
Jonathan A. Mitchell, Daniel Rodriguez, Kathryn H. Schmitz and Janet
Sleep Duration and Adolescent Obesity
Services
Updated Information &
http://pediatrics.aappublications.org/content/131/5/e1428 including high resolution figures, can be found at:
References
http://pediatrics.aappublications.org/content/131/5/e1428#BIBL This article cites 34 articles, 7 of which you can access for free at:
Subspecialty Collections
http://www.aappublications.org/cgi/collection/obesity_new_sub Obesity
dicine_sub
http://www.aappublications.org/cgi/collection/adolescent_health:me Adolescent Health/Medicine
following collection(s):
This article, along with others on similar topics, appears in the
Permissions & Licensing
http://www.aappublications.org/site/misc/Permissions.xhtml in its entirety can be found online at:
Information about reproducing this article in parts (figures, tables) or
Reprints
DOI: 10.1542/peds.2012-2368 originally published online April 8, 2013;
2013;131;e1428
Pediatrics
Audrain-McGovern
http://pediatrics.aappublications.org/content/131/5/e1428
located on the World Wide Web at:
The online version of this article, along with updated information and services, is
by the American Academy of Pediatrics. All rights reserved. Print ISSN: 1073-0397.