University of Pennsylvania
ScholarlyCommons
Publicly Accessible Penn Dissertations
1985
Profile Structures of Thin Multilayer Films by X-ray
Diffraction Using Direct and Refinement Methods
of Analysis
Victor Skita
University of Pennsylvania
Follow this and additional works at:
https://repository.upenn.edu/edissertations
Recommended Citation
Skita, Victor, "Profile Structures of Thin Multilayer Films by X-ray Diffraction Using Direct and Refinement Methods of Analysis" (1985).Publicly Accessible Penn Dissertations. 3213.
Profile Structures of Thin Multilayer Films by X-ray Diffraction Using
Direct and Refinement Methods of Analysis
Abstract
Meridional x-ray diffraction data from Langmuir-Blodgett multilayers containing two to ten molecular monolayers of arachidic acid were analyzed by two independent methods. A Patterson function deconvolution technique uniquely provided the electron density profile (8A resolution) of the average, symmetric bilayer repeated in the multilayer. This average bilayer appeared to disorder as the number of bilayers in the multilayer decreased. A refinement technique, which does not assume a centrosymmetric structure or the existence of a unit cell, uniquely provided the profile structure of the multilayer itself. In particular it could distinguish the individual monolayers in the multilayer. Meridional x-ray scattering data from Langmuir-Blodgett multilayers composed of arachidic acid and either 'myristic acid or polymerized 10,12 pentacosadiynoic acid were also analyzed by the refinement technique. It found that only the last monolayer in the depostion sequence (ie. the surface monolayer) was disordered and that ordering of the surface monolayer can be induced by the deposition of an additional monolayer. In addition, an application of Langmuir-Blodgett multilayer thin films and their characterization by x-ray scattering is discussed with regards to the structural study of membrane-membrane interactions and the triggering of cellular components of the immune system.
Degree Type
Dissertation
Degree Name
Doctor of Philosophy (PhD)
First Advisor
•
inPROFILE STRUCTURES OF TlllN MULTILAYER FILMS BY X-RAY
DIFFRACTION USING DIRECT AND REFINEMENT
METHODS OF ANALYSIS
VICTOR SKITA
A DISSERTATION
BIOPHYSICS
Presented to the faculties of the University of Pennsylvania in
Partial Fulfillment of the Requirements for the Degree of Doctor of Philosophy
1985
This work is dedicated to my family whose unconditional
ACKNOWLEDGMENTS
Foremost, I would like to thank my advisor Dr. J. Kent Blasie.
This dissertation would not have been possible without his guidance
and insight. I am indebted to Dr. Anthony Garito for the use of his
Lauda film balance and the resources in his laboratory. As my thesis
committee chairman, Tony advice was invaluable. I like to thank Dr.
Sol Gruner for his wise counsel throughout my graduate school
career. Sol has had a profound influence on my outlook toward
science. During the last five years I have had countless interactions
with fellow graduate student, Robert Fischetti. It is not surprising
that Bob knows my work better than any other person. We have
spent hundreds of hours not only working together in developing
and maintaining equipment and software, we have also analyzed,
criticized, and reanalyzed each others data more times than I would
like to count. Through this process I have learned a tremendous
amount from Bob; what more can I say but thanks. I would like to
thank Dr. Donatella Pascolini for her consistently helpful advice. For
her struggles with fabricating Langmuir-Blodgett films of myristic
acid, Wendy Richardson deserves a great deal of thanks. Finally, I
must thank Francisco Asturias for his almost limitless source of
ABSTRACT
PROFILE STRUCTURES OF THIN MULTILAYER FILMS BY X-RAY
DIFFRACTION USING DIRECT AND REFINEMENT METHODS OF ANALYSIS
Victor Skita
J. Kent Blasie
TABLE OF CONTENTS
DEDICATION...
iiACKNOWLEDGMENTS. ••••••••••••••••••••••••••••••••••••••
iii
ABSTRACT. • • • • • • • • • • • • • • • • • • • • • • • • • • • • • • • • • • • • • • • • • • • • • iv
TABLE OF CONTENTS...
vFIGURE
StKfARy...
ixPREFACE. • • • • • • • • • • • • • • • • • • • • • • • • • • • • • • • • • • • • • • • • • • • • • • xi
CHAPTER ONE
Introduction...
1
References for Chapter One...
4
CHAPTER TWO
General Theory
I. Introduction •••••••••••••••••••••••••••• 6
7
Part
Part
II. Scattering Theory •••••••••••••••••••••••
Part III. Diffraction from Infinite Systems...
24
Part
IV. Diffraction from Finite Systems •••••••••
32
References for Chapter Two...
36
CHAPTER THREE
Sample Preparation and X-Ray Methods
Part
II. X-Ray Diffraction Methods...
44
References for Chapter Three...
54
CHAPTER FOUR
Results
Part
I. Arachidic Acid Multilayers...
55
Part
II. Arachidic Acid, Myristic Acid, and
10,12
Pentacosadiynoic Acid Mixed
Multilayers... 60
CHAPTER
FIVE
Analysis
Part
I. Arachidic Acid Multi1ayers...
70
Part
II. Arachidic Acid. Myristic Acid, and
10,12
Pentacosadiynoic Acid Mixed
Multilayers ; .. ;... 91
References for Chapter Five...
100
CHAPTER SIX
Discussion
Part
I. Arachidic Acid Mu1ti1ayers:
Box Refinement...
101
Part
II. Arachidic Acid Mu1ti1ayers:
Model Calculations...
111
Part III. Arachidic Acid, Myristic Acid, and
10,12
Pentacosadiynoic Acid Mixed
CHAPTER SEVEN
Conclusion...
122
References
for Chapter Seven...
126
CHAPTER EIGHT
The Study of Thin Multilayer
Films -- A Discussion
of a Biophysical
Application...
127
References
for Chapter Eight...
131
APPENDIX I
Fourier Transform of an Infinite Periodic Array of
De1ta FunctiODS. • • • • • • • • • • • • • • • • • • • • • • • • • • • • • • • • • • • • • • 132
APPENDIX II
Shifting of Diffraction
Maxima
for Multilayers
of
Finite Extent...
134
APPENDIX III
Reconstruction
of the Unit Cell Patterson by the
Method of Linear Equations...
135APPENDIX
IV
Direct Deconvolution
Method...
138APPENDIX V
APPENDIX VI
Box Refinement Technique...
144
APPENDIX VII
Symmetric and Antisymmetric Contributions of the
Electron Density Profile to the Intensity Function....
148
B IBLlOORAPIIY • • • • • • • • • • • • • • • • • • • • • • • • • • • • • • • • • • • • • • • • • • 149
FIGURE SUMMARY
Figure
1. Ewald's Sphere of Reflection...
31
Figure
2. Isotherms, Arachidic Acid and
10.12Pentacosadiynoic Acid...
43
Figure
3A. Rocking Curve. Arachidic Acid N=5...
50
Figure
3B. Rocking Curve. Arachidic Acid N=l...
51
Figure
4. OTS Scattering...
53
Figure
5. Corrected Intensity Functions,
Arachidic Acid N=1.2,3.5...
57
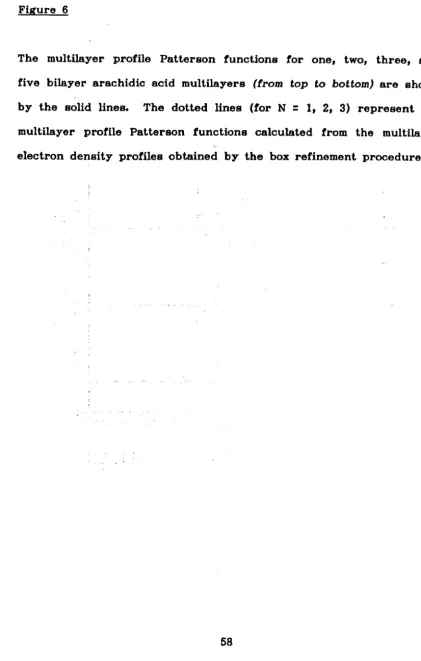
Figure
6. Multilayer Patterson Functions.
Arachidic Acid N=l,2.3,5...
59
Figure
7. Corrected Intensity Functions for
AAMM, AAAM. and AAAA multilayers...
63
Figure
8. Multilayer Patterson Functions for
AAMM. AAAM, and AAAA multilayers...
65
Figure
9. Corrected Intensity Functions for
DDDA and DDD multilayers...
67
Figure
10. Multilayer Patterson Functions for
DDDA and DDD multilayers...
69
Figure
11. Unit Cell Patterson Functions,
Arachidic Acid N=2.3,5...
78
Figure
12. Unit Cell Deconvolution,
Arachidic Acid N=2,3.5...
80
Figure
13. Fourier Synthesis,
Arachidic Acid N=2~3.5...
82
Figure
14. Unit Cell Electron Density Profile for
DPPC,
35·0
and
49·C...
84
Figure
15. Model Electron Density Profiles...
86
Figure
17. Box Refinement Multilayer Profiles.
Arachidic Acid N=1.2.3...
90
Figure l8A. Corefinement Multilayer Profiles.
AAAM versus AAAA. • • • • • • •• • • • • • • • • • • • • • • • • • 95
Figure 188. Corefinement Multilayer Profiles.
A.Ap.f.f versus AAAA. • • • • • • • • • • • • • • • • • • • • • • • • • 96
Figure IBC. Corefinement Multilayer Profiles.
~ versus AAAM. • • • • • • • • • • • • • • • • • • • • • • • • • 97
Figure
19. Corefinement Multilayer Profiles,
DDDA versus DDD. • • • • • • • • • • • • • • • • • • • • • • • • • • 99
Figure
20. Step-Function Equivalent Models.
Arachidic Acid N=1.2.3...
106
Figure
21. Calculated Intensity Functions,
Arachidic Acid N=2...
108
Figure
22. Calculated Patterson Functions,
Arachidic Acid N=2...
110
Figure
23. Calculated Intensity Function.
Arachidic Acid N=2 showing Asymmetric
Except for some asymmetric substances, in principle there is nothing
which prevents a direct determination
ot
the structureot
anyarbitrary substance from the intensity data alone. It is only a
question of precision
ot
measurement and, consequently, how large isnumber of solutions.
-fr06l HosSIIHUJand RBI/chi
CHAPTER ONE: INTRODUCTION
X-ray diffraction from oriented fatty acid (CHs-[CH3]n-COOH)
multilayers was observed and first interpreted by Muller [1-1] and
Muller and Shearer [1-2] in 1923. They concluded that a "complete
[structural] solution" was not plausible at that time, and settled for
calculating the average methyl (-CH,)
to
carboxyl (-COOH) spacingfrom their powder patterns.
Fatty acid monolayers were first deposited onto solid glass
subtrates by, Katherine Blodgett [1-3, 1-4] and later by Blodgett and
Langmuir [1-5]. X-ray diffraction studies of these Langmuir-Blodgett
films deposited onto metal [1-6] and glass [1-7] substrates soon
followed. Holley and Bernstein [1-8] speculated Langmuir-Blodgett
films could be used to study the correlation between the number of
cooperating Langmuir-Blodgett monolayers with the experimental line
widths observed in the diffraction patterns.
In a series of papers Irving Langmuir and Vincent Schafer
discuss the fabrication of· Langmuir-Blodgett films that either
incorporate proteins during the film deposition process [1-9, 1-10] or
by conditioning the surface of an Langmuir-Blodgett. film· so as to
adsorb proteins from solution [1-10, 1-11, 1-12]. They used optical
methods
to
measure the thickness of their protein (urease, pepsin,albumin, or cholesterol) layers. More recently, McLean [1-13] outlined
the procedure for the fabrication (via the Lanifmuir-Blodgett
Kopp et al. [1-14] have pointed out that membrane proteins
should ideally be studied at an interface between between high
dielectric (water) and low dielectric (membrane) phases.
Investigations on the functional interactions between biological cells
[1-15], and on antibody-antigen interactions [1-16, 1-17] use
Langmuir-Blodgett films as a model system. The study of
transmembrane potentials [1-18], for instance, which depend critically
on the orientation of the membrane proteins could be enhanced by
fabricating appropriate Langmuir-Blodgett protein films. The detailed
structural study and analysis of simple Langmuir-Blodgett systems
composed of only a few molecular monolayers is critical if one wishes
to
study the structural-functional relationship of membrane proteinsin Langmuir-Blodgett films.
X-ray diffraction can in principle be used
to
investigate thestructure of these simple, very thin multilayer films containing only a
few molecular monolayers deposited on solid substrates by the
Langmuir-Blodgett technique. One would like
to
ascertain whetherthe structures of the individual monolayers differ from one another
and particularly whether the substrate perturbs certain individual
monolayers in the multilayer film. Previous analyses of the
meridional x-ray diffraction from such multilayer films have employed
either a non-unique modeling of the multilayer electron density
profile
to
fit the observed diffraction data [1-19] or direct methods(multilayer profile Patterson function deconvolution [1-20] and
electron density profile of the average, symmetric bilayers or bilayer
pairs repeated in the multilayer. Most methods of unambiguous
structural analysis employing x-ray scattering are limited in that
they require (or assume) the repetition of some average structural
unit (unit cell) in a periodic array of effectively infinite extent.
This study is composed of two parts. In part one meridional
x-ray diffraction data from multilayers containing one, two, three and
five bilayers of arachidic acid deposited on alkylated glass substrates
was collected. Data from these multilayers were analyzed by two
independent methods for comparative purposes. A Patterson function
deconvolution technique [1-20] provided uniquely the electron density
profiles (SA resolution) of the average, symmetric bilayer as a
function of the number of times N (N
=
2, 3, 5) it was repeated inthe multilayer. A box-refinement technique [1-22, 1-23] for the
homologous series of multilayer structures N
=
1, 2, 3 uniquelyprovided the electron density profile (SA resolution) of the multilayer
itself, namely of each individual monolayer as a function of its
position in the three multilayers.
The second part consists of studying Langmuir-Blodgett
multilayers composed of monolayers of different amphiphilic
macromolecular species each have different chain lengths. Direct
methods assuming a repeating unit cell could thus not be employed;
rather a variant of the box refinement technique was used
to
studyImFEImNCRS roR CHAPTER ONE
[1-1]
Muller, A.
The X-ray Investigation
of Fatty-Acids.
J. Chem
Society.
123:2043-2047
(1923)
[1-2]
MUller, A., Shearer, G. Further X-Ray Measurements
of
Long-chain Compounds and a Note on their Interpretation.
J.
CheJIISociety.
123:3156-3164
(1923)
[1-3]
Blodgett, K.
Monomolecular
Films of Fatty Acids on Glass.
JACS.
56:495 (1934)
[1-4]
Blodgett, K.
Successive Monomolecular
Layers on a Solid
Surface.
JACS.
57:1007-1022
(1935)
[1-5]
Blodgett, K., Langmuir, I. Built-up Films of Barium Stearate
and thier Optical Properties.
Physicsl Review. 51:964-982
(1937)
[1-6]
Clark,
G.,
Sterrett, R., Leppla, P. X-ray Diffraction
Studies
of Built-up Films of Long-Chain COBlPounds.
JACS.
56:495-496
(1934)
[1-7]
Clark,
G.,
Leppla, P. X-ray Diffraction
Studies of Built-up
Films.
JACS.
68:2199-2201
(1936)
[1-8]
Holley,
C.,
Bernstein, S. X-ray Diffraction
by a Film of
Counted Molecular
Layers.
Phys. Rev.
49:403 (1936)
[1-9]
Langmuir,!.,
Schaefer. V., Wrinch, D. Built-up Films of
Proteins and their Properties.
Science
85:76-80 (1937)
[1-10] Langmuir, I., Schaefer, V. Activities of Urease and Pepsin
Monolayers.
JACS
60:135[1-1357
(1938)
[1-11] Langmuir, I., Schaefer,- V. Optical Measurements
of the
Thickness of a Film Adsorbed From a Solution.
JACS59:1406
(1937)
[1-12] Langmuir, I., Schaefer, V. Improved Methods of Conditioning
Surfaces for Adsorption.
JACS59:1762-1763
(1937)
[1-14] Kopp, F., Cuendet, Po, Muhlethaler,
Ko, Zuber, Ho
Hydro-phobic Membrane
Protein from Chromatophores
of
~odospirilli.
RUbrumo
structural
and Spectroscopic
Studies
of Mono 1ayers and Multilayers.
BBA
553:438-449
(1979)
[1-15] Tscharner,
V., McConnell,
Ho Physical Properties
of Lipid
Mono 1ayers on Alkylated
Planar Glass Surfaces.
Biophy.5. J.
36:421-427
(1981)
[1-16] Hafeman, Do, Tscharner,
V., McConnell,
H. Specific
Antibody-Dependent
Interactions
between Macrophages
and Lipid Haptens
in Planar Lipid Monolayers.
PNAS78:4552-4556
(1981)
[1-17] Uzigiris,
E., Kornberg,
R. Two-dimensional
Crystallization
Technique
for Imaging Macromolecules,
with Application
to
Antigen-Antibody-Complement
Complexes.
Nature 301:125-129
(1983)
[1-18] Packham, No, Dutton, P.L., Mueller,
P. Photoelectric
Currents
Across Planar Bilayer Membranes
Containing
Bacterial Reaction
Centers.
Biophy.5. J.
37:465-473
(1982)
[1-19] Pomerantz,
M., Segmuller,
A. High Resolution
X-ray Diffraction
From Small Numbers of Langmuir-Blodgett
Layers of Manganese
Stearate.
Tobin Solid Films
68:33-45
(1980)
[1-20] Less lauer , W., Blasie, 3.K. Direct determination
of the
Structure of Barium Stearate Multilayers
by X-ray
Diffraction.
Biophys~
J.
12:175-190
(1972)
[1-21] McIntosh,
T., Waldbi1lig,
R., Robertson,
D. Lipid Bilayer
Ultrastructure
Electron Density Profiles and Chain Tilt
Angles as Determined by X-ray Diffraction.
BBA
448: 15-33
(1976)
[1-22] Stroud, R., Agard, D. Structure Determination
of Asymmetric
Membrane Profiles Using an Iterative Fourier Method.
Biophy.5.
J.
25:495-512
(1979)
[1-23] Makowski,
L. The Use of Continuous
Diffraction
Data as a Phase
Constraint.
I. One-Dimensional
Theory.
J. Appl.
Cr.y.st.14:
CllAPTER TWO: GENERAL THEORY
Part I. Introduction
The general theory presented herein attempts to concisely review
scattering theory. and then extend the basic concepts to diffraction
from both infinite and finite one-dimensional systems. The quantum
mechanical derivation of scattering is well known; the formalism used
in based largely on Eugen Merzbacher's approach [2-1] and somewhat
on that of Gordon Baym [2-2]. The extension of general scattering
theory to x-radiation comes from Boseman and Bagchi [2-3] and John
Coley [2-4]. The discussion of diffraction from an infinite system is
based on Ashcroft and Mermin [2-5] and Coley [2-4]. Diffraction from
a finite system is discussed in detail by Hoseman and Bagchi [2-3].
Part II. Scattering Theory
Scattering involves the bombardment of atoms in a target with a
beam of particles. These particles are scattered by the target atoms
and are detected as an intensity. This intensity varies with
scattering angle. Quantum mechanically, we wish to derive the
eigenfunctions of the scattered beam; this being directly related to
the observed intensities, or likelihood of finding a particle at a
certain place.
Certain assumptions are made. 1) The effect of the scattering
center on the particles can be represented by a potential VCr) which
falls to zero within a finite region of the scattering center. This
would exclude a pure Coulombic field. a) The scattering is elastic
(ie. without energy loss or gain by the projectile) 3) The incident
particles do not interact with each other.
The Hamiltonian is given by:
.x
=
.xo
+VCr)
(II-I)
The incident particles can be represented by a wave packet of
the form:
(11-2)
where +(k) is the momentum distribution. It is assumed that +(k) is
If +(r,O) can be expanded in terms of its eigenfunctions +n(r}:
+(r,O) =
L
cn+n(r)n
then +(r,t) is given by:
(II-3)
n
Equation (II-3) describes the eigenfunctions of the HamiltonianJI.
and not JL The eigenfunctions for .... are the solution of a free
particle with eigenvalues En. However, if we can find a solution
+k(r) that satisfies Schrodinger's equation:
(II-4)
equation (11-2) after substituting +k for the free particle solution,
exp[ik·r), would yield:
(II-5)
From equation (II-3) we would then obtain:
+(r,t)
=
I
+(k) exp[-ik·r.-i~t] +k{r) d'k (11-6)where
*'~
=
The problem then reduces to finding an appropriate wave
function +k(r) that satisfies equation (II-4).
(V2 + k2 )1k
=
U(r)1k~E
"a
(11-7)
where
and U(r)
Equation (II-7) is solved by solving the homogenous equation:
(va +
k
2 )1k=
0
(II-B)
and then finding the particular solution. The solution to (II-B) is
just. the wave function for a free particle:
(11-9)
To find the particular solution, let us consider t.he family of
functions defined by:
(va + k2 ) G(r,r')
=
-4w6(r-r')where G(r,r') is known as Green's function.
By inspection, the solution to the inhomogenous equation (II-7)
is:
?k(r)
=
-1/4wJ
U(r') G(r-r') ?k(r') d'r'(II-IO)
U(r)tk
=
-1/4w
J
(Va +k
a )U(r')
xG(r-r') tk(r')
d3r'
U(r)tk
=
J
6(r-r') U(r') tk(r') d
3r'
QED
We must now find an appropriate Green's function. G(r,r') can
be defined in terms of the Fourier transform of g(k').
G(r-r')
=
J
g(k') exp[ik'·(r-r')]
d
3k'
(11-11)Multiplying the left and right side of (II-ll) by (va
+
ka) andusing the definition of Green's function yields:
-4w6(r-r')
=
J
g(k')
va
exp[ik'·(r-r')]
d
3k'
+
kl
J
g(k') exp[ik'·(r-r')]
d3k' (11-12)
Substituting the Dirac delta function:
6(r)
=
(1/2w)3
J
exp[ik'·r]
d3k~
into
(II-12)
and letting r'=
0 (tor convenience) yields:-4w(1/2w)3
J
exp[ik'·r]
d3k'=
I
g(k')
[k
J-k·
2]exp[ik'·r]
d
3k'
Thus
and
Integrating over the angles yields:
G(r)
=
+.
J
eXP[ik'rJ
dk'k·2 - k2.
-.
The above integral has singularities at k'
=
*k. By choosing anappropriate contour and using the residue theorem we can solve for
Green's function:
G(r)
=
exp[ikrJ
r
For r' ~
0
we have
amore generalized result:
G(r,r')
=
exp[iklr-r'I]
Ir-r' I
(II-13)Substituting (11-13) into (11-10) yields the particular
solution:
~
=
-1/4w
I
U(r') exp[iklr-r'IJ ~k(r') d
3r'
rk,pt
lr-r'l
r
The sum of the homogeneous solution (11-9) and the particular
1/4w
I
U(r') exp[iklr-r'l] 1k(r') d
3r'
lr-r'l
It we assume that we observe the scattering far from the target
(ie. the Fraunhofer condition, namely r: e-c r ) the following
approximation can be made.
klr-r'l
=
kr - k~·r'
+
klr-r'l ~ kr - k~·r'
+ •••
Let
k'
=
k~
then
klr-r'l ~ kr - k'·r'
Substituting into the general solution yields the well-known
asymptotic solution:
1/4w
I
U(r') exp[!krl
IIexp[-ik'·r'l] 1k(r') d
3r'
where
(9_'"
J
fk(k')
= - ~
exp[-ik'or'] U(r')tk(r') d
3r'
(11-14)
Substituting (II-14) into equation (II-6) yields:
t(r,t)
=
J
+(k)exp[-ikor.-i~t]
xSince
CJ=
=
2: [ko
+(k - k.)]
fa
=
2p [2k.ok - k
08 +(k - k.)2]
If we assume (k -
k.)2
-+ 0 (ia. the wave packet does notspread appreciably- when it is displaced by the macroscopic distance
r0)' we obtain from the above expansion of ~:
CJ -
-
2p
"
[2k ok -
k 2]0 0
then-i[kor.
- ~t]
=
-ikor. -
i2: [2k.
ok - k
o8]t
=
-ikor
- i(!k ·kt)
+i_!k at
where
Vo=
and
~ =
..l!V2o
2\
0Equation
(11-15) can now be rewritten:
1(r.t)
=
J
+(k) exp[-iko(ro+vot)
+ iWot] •
[ 1
[ik]
+
eXP[!kr] fle(k') ]
)I(271')'
exp
or
d'k
1(r.t)
=
J [
+(k) exp[-iko(r.+v.t)
+ i~ot] •
(2!)'
J [
+(k) exp[iwot]
•
exp[i(kr-k·(ro+vot)]
~ flc(k')] d
3k
(11-16)With the help of equation (II-G) for r .... r - v.t we
Since we assumed +(k) differs from zero only for k • k. then:
kr
=
k •k
rand kr - k·(r.
+
v.t) - k • k.r - k·(r.+
v.t)- k •(k.r - r. + v.t)
Substituting kr from above in (II-16) and comparing the result
to
equation (II-2) yields:
(II-17)
Equation (II-17) applies itself
to
an eaay physical interpretationof the scattering problem. The first term, aaide from a phase factor
(exp[i~ot]) ia just the initial wave packet displaced without change in
H
i1
shape; the second term is a radially expanding replica of the initial
wave packet as aeen by the acatterer, reduced in amplitude by a
factor fk(k' )/r. fk(k') is known aa the scattering amplitude.
Equation (11-14) can be rewritten in terms of V(r'):
i.
i
I
I
where
VCr')
This not an explicit expression for fk(k") aince ?k is in the
(II-IS)
to
yield:fk(k') -
;Wi2
J
exp[-ik"r']
VCr') exp[ik'r'] d'r'
(II-19)
In the first Born approximation the scattering amplitude is
proportional
to
the matrix element of the s&attering potential betweenan incoming and an outgoing plane waves. Scattering can thus be
looked upon as a perturbation of the incident particle by some
potential distribution. This approximation is valid for weak potentials
and high incident energies.
Equation (II-19) can be rewritten
to
yield:let
2wq
=
-(k' - k)
then
(II-20)
Equation (II-20) is a general solution
to
scattering of a particlewave by a potential. It is valid for neutrons, electrons, and x-rays.
For x-rays we can substitute for the reduced mass p (equation
II-21)
to
yield (II-22)."
h
p = cA
(II-21)
fk(q)
- - _!_
f
VCr') exp[2niq·r']
d'r'
CAt-
(II-22)
Since the scattering potential is proportional to the electron
density distribution, -per'), for x-ray scattering we obtain:
F(q)
•
f
per') exp[2niq·r·]
d'r'
where F(q) is called the structure factor or structure amplitude and
is equal to fk(q). Substituting r for
r:
for simplicity yields:F(q)
•
f
per) exp[2niq·r]
d'r
(II-23)
Equation
(11-23)
states that the structure factor is proportionalto the Fourier transform of the electron density distribution.
Inversely the Fourier transform of the structure factor is
proportional to the electron density distribution (II-24).
per)
•
f
F(q)exp[-2niq·r]
d'q
(II-24)From an experimental point of view, it is the differential cross
section (which represents the number of scattering particles in a
given area de per solid angle ao) which is most interesting. The
differential cross section is proportional to what is measured in a
The ratio of the observed intensity I(q) to the total incident
beam intensity lo(q) (ia.
ff*)
is equal to the differential crosssection; therefore, the observed intensity is proportional to the
structure factor multiplied by its complex conjugate.
I(q)
•
r(q) • F*(q)
(11-26)Substituting equation (II-25) with the understanding that I(q)
represents a relative intensity (thus eliminating the proportional
symbol) yields:
I(q)
=
Ip(r')
exp[2wiq'r'] d
3r'
xIp(r)exp(-2wiq'r]
d
3r
If we choose
r:
=
r+
u and integrate over d3u, he aboveexpression becomes:
I(q)
=
Ip(r+u)
exp[2wiq'(r+u)]d3u
xIp(r)
exp[-2wiq'r]d
3r
Rearranging yields:
=
I
exp[-2wiq· u] [
I p(r)p(
r+U)d3~]
•
d
3u
(11-27)
If
we
let:=
(II-28)where P(u) is called the Patterson function. The tt
* "
in equation(11-28) denotes the convolution operator. The Patterson function is
thus the autocorrelation of the electron density function.
Substituting P(u) into (11-27) and letting u ... r (for
consistency) yields:
l(q)
=
J
Per) exp[2wiq·rJ
d'r
(II-29)Equation (II-29) states that the intensity function is proportional
to the Fourier transform of the Patterson function. Inversely, the
Fourier transform of the intensity function is proportional to the
Patterson' function (equation 30).
Per)
=J
l(q) exp[-2wiq·rJ
dSq
(II-30)The projection of a three dimension electron density distribution
onto a two-dimensional electron density distribution is given by
equation (II-31). The electron density distribution is said to be
projected onto the y-z plane. '
p(y,z)
=
J
per)
dxSubstituting equation (II-25) into (II-31) yields:
(II-31)
p(y,z)
=
J [ J
F(q)exp[-2
ni(q
xx+qyy+q
zz)
d'q ]
dxp(y,z)
=
J F(q)exp[-2
ni(qyy+qzz)]
x[ Jexp[-2
niq
xx]
dx ]dqxdqydqz
and using the definition of the delta function
we obtain:
p(y,z)
=
J [ J F(q)exp[-2
wi(qyy+qzz)]6(qx)
dqx] x
dqydqz
Evaluating the integral over x yields equation (11-32).
p(y,Z)
=
J F(O,qy;qz)exp[-2
ni(qyy+qzz)]
dqydqz
(11-32)
Thus, the Fourier transform
ot
the structure factor in the qy-qzplane is just the projection
ot
the electron density distribution ontothe y-z plane. From (II-32) we can directly write the inverse
Fourier transform.
(II-33)
The Fourier transform of the electron density distribution projected
onto the y-z plane is the structure factor in the qx-qy plane.
The above procedure is applied a second time to calculate the
The two dimensional electron density distribution is
resulting one dimensional electron density distribution is called the
electron density profile p(z).
p(z)
=
J p(y,z) dy(II-34)
Substituting equation (II-32) yields:
p(z)
=
J [ J F(O,qy,qz)exp[-2ni(qyy+qzz) xdqydqz] dy
Rearranging the equation and substituting for the delta function.
p(z)
=
J F(O,qy,qz)exp[-2niqzZ] •
[ Jexp[-2niqyy] dy] dqydqz
Integrating over y yields:
p(z)
(II-3S)
Thus, the electron density profile is the Fourier transform of the
structure factor along qz. Consequently, the inverse Fourier
transform yields:
F(O,O,qz) is commonly also referred as F(O,O,') or F(O,O,q..L.).For
simplicity let us replace F(O,O,qz) with F(qz) with the understanding
that F(qz) is not analogous to p(z) (in as much as p(z) is a
projection of a three-dimensional distribution onto the z-axis), but
merely represent.s the structure factor along the qz-axis.
Rewriting equations (II-~5), (II-36) and extending the above
formalism to equations (II-29), (II-30), (II-26), (11-28) result in the
basic equations of one-dimensional scattering theory (II-37), (II-38),
(II-39), (II-40), (II-41), (II-42).
F(qz)
=
J
p(z)exp[2wiqz
z] dzJ
F(qz) exp[-2wiqz
z]dqz
f
P(z) exp[2wiqz
Z]
dz
(II-37)
p(z) =
(II-38)
=
(11-39)
P(z)
=
f
I(qz) exp[-2wiqz
Z]
dqz
F(qz) F*(qz)
(II-40)
(II-41)
(II-42)
I(qz)
=
P(z)
=
p(z)*
p(-z)Since
2wq
•
k - k'
(II-43)
and the magnitude of the incoming (incident) wave vector is the same
as that of the outgoing (scattered) wave vector (ie. elastic
k
=
k'we can derive an expression for the magnitude of q where
29
is theangle between the incident and scattered waves.
2'11'Q
=
2ksin9
(II-44)Given:
k
•
1
1t
=
~A
then Iq I (in units of reciprocal length) is given by:
q
=
-
28in9
Part 111. Diffraction
fro. Infinite Systeas
Scattering from an electron density distribution (in the case of
x-rays) which is composed of a repeating subunit (or unit cell) is
known as diffraction. Diffraction maximaresult from the constructive
interference of particle waves scattered from the individual
scattering centers. For a Bravais lattice with lattice vectors given
by:
R (11-46)
where ai, a2, as are the primitive vectors of the Bravais lattice, and
(k - k~) • R
=
2nm(11-47)
nil nar ns are integers, the· condition for constructive interference
requires:
where m is an integer. This condition can be written in a more
conventional form:
exp[i(k - k~) • R]
=
1
The above expression is the von Laue formulation of diffraction by a
crystal.
The reciprocal lattice vector is defined as:
Q (11-48)
lattice and k.,k:"ks are integers. The primitive vectors of the
and bub.,bs are the primitive vectors of the reciprocal Bravais
al ,a2,as as follows:
=
aa x alal
·
(a2 x as)al x a,
al
·
(a2•
as)a, x al
al
·
(a2 x as)(II-49)
=
(II-50)
=
(II-51)
In addition:
at • bJ = 6tJ
where 6t J is the Kronecker delta:
6t J
=
0 i~J I'6tj
=
1 i=J(II-52)
Diffraction "can be easily visualized by a geometric construction
known as Ewald's sphere of reflection (see figure 1). Let us define
the origin in reciprocal space to be the point 0 and the reciprocal
coordinate axes to be defined by the unit vectors
;x,By,;z'
Constructa sphere of radius II). whose surface intersects the reciprocal origin
and whose center is point c. This is Ewald's sphere. Let
rt
represents the incident wave given by k/271'. Our reciprocal lattice
has coordinate axes defined by unit vectors
q.,qy,qz ;
its origin mustcoincide with point
o.
k/271' (the scattered vector) is represented bythe vector
rt
where s must be a point on the surface of the Ewald'ssphere if the scattering is elastic. q therefore is represented by the
(equation II-47) is fulfilled since (with II-43, II-48, II-52):
(k - k') • R
=
2w
Q •R
=
2W(D1k
181·b
l + Dak
a8a·b
a+
D,k,8s·bs)
=
2711Dm must be an integer since nuna,n, and kukuk, are integers. In
other words, constructive interference from the lattice planes (in real
space) perpendicular to the reciprocal lattice vector Q requires the
surface of Ewald's sphere to intersect the reciprocal lattice point
defined by the reciprocal lattice vector Q. These lattice planes are
indexed by kl ,ka,k, as is the reflection produced by the constructive
interference.
Generally the reciprocal, lattice points do not intersect the
surface of Ewald's sphere! for any q, and the condition for
constructive interference is· not met. For monochromatic light
sources there are three options to overcome this problem. One can !;",
reciprocal lattice (ie. rotate the crystal), or rotate both the light
rotate Ewald's sphere (ie. rotate the light source), rotate the
source and the crystal. In practice, the second option is the most
practical. •i
Consider the following electron density distribution for a one
+-p(qz) = L6(Z-'d)
--
(II-53)
Using equation (II-37) to yield (see appendix I):
-F(qz) = L6(qz-
a )
-.
(II-54)
From the above expression, F(qz) ~ 0 if and only it qz='/d.
If we use equation (II-45), we have F(qz) ~ 0 it and only if:
2sin9,
=
x
Thus we have a reciprocal lattice of periodicity lid. The above
2dsin9,
=
'"
(II-55)
expression can be rearranged to give· Bragg's law in its usual form:
In terms of Ewald's sphere of reflection (figure 1) we need only
consider the Sx-Sz plane it we choose the incident beam in the Sx
direction. l1t thus lies along the Sx axis. We define the angle
between ;x and qx to be tJ. By rotating the crystal around the qy
axis we are able to intersect the reciprocal lattice points (located at
lId) with Ewald's sphere at point
s,
This is a function of both (OCSand tJ. (OCS by definition is equal to 29 (equation II-43). Since we
are rotating only about the CIy axis, the angle between
Bz
and qz isalso tJ. Simple geometry leads us to conclude that "'=9; '" and 29 are
reciprocal lattice point to intersect the surface of Ewald's sphere is
the origin ('=0); thus 28=0-. The reciprocal lattice will intersect the
surface of Ewald's sphere at the origin and at qz='/d if we rotate
the crystal around the qy axis until
G1=G1,i
this corresponds to (ocs =reflections. Let us begin by defining our Bravais lattice vector
We can instead use von Laue's formulation for diffraction from an
infinite crystal to solve the problem of the one dimensional crystal
aligned along the
z
axis. We start by constructing a simple threedimensional crystal and consider the reciprocal lattice vectors for
kl=k3=0 and ks='. Thus we choose to observe only the (00')
(equation II-46):
R
=
nlal + Daa2+ Dsaswhere al
=
xa2
=
Y..
as
=
zand Ds
=
dthus
A
..
AR
=
DIX+ DaY+ dz"
For constructive interference to occur (le. q = Q) we have from
Equations (11-48) through (II-51) let us define our reciprocal
lattice vector.
Q
=
27r R • Q
=
21rJ11 (m=integer)Substituting for Q and R, we conclude that , must be an integer.
With the help of equations (II-43) and (II-45) we again obtain
Bragg's law:
The reflection observed for:
~, =
9,=
sin-1 [ ~~ ]corresponding to
[ 2nd]
29,=
2sin-1arises from the constructive interference from the family of real
space planes perpendicular to Q. Thus, constructive interference
between the (00') lattice planes, where the distance between the
Figure 1
The intersection of Ewald's sphere of reflection with the
sx-sz
isshown. A one-dimensional reciprocal lattice along the
qz
is rotatedby an angle" with respect
to
the ~z axis, causing the 1=10reciprocallattice point
to
intersect the surface of the Ewald sphere. The vonLaue conditions for constructive interference are thus satisfied tor
figure 1
o.~s~
: .: 0
: ... sx
Part IV. Diffraction fro. Finite Systa.s
The meridional intensity function for a multilayer composed of N
repeated unit cells containing a bilayer with a unit cell translation
vector along the z direction of magnitude d is given by the following
equation:
(II-56)
where
+.
= [
cJ [ qz --a ]
*
I B ( qz) I 2•=-.
(II-57) .and
Fuc(qz)
=
unit cell profile structure factorILn(qz)12
=
the reciprocal lattice or interferance function forthe multilayer profile
=
Fourier transform of the multilayer profile boxfunction
=
incident beam-shape functionThe Fourier transform of· equations (II-56) and (II-57) (using
equation II-38) yields the multilayer profile Patterson function
(equation II-58) (i.e. the multilayer profile autocorrelation function)
and the multilayer profile lattice autocorrelation function respectively
(equation II-59).
Pml(Z)
=
[[Puc(z)*
Puc(-z)]*
i
n2(z) ] • w(z)(II-58)
=
+.
~(z-nd) •
b
2(z)n=-·
(II-59)
where
Puc(z)
=
average unit cell electron density profileb(z)
=
multilayer profile box functionw(z)
=
Fourier transform of the beam-shape functionand ln2(z) and
b
2(z) represent the autocorrelation of In(z) andb(z) respectively.
For our multilayer composed of N repeated unit cells with its unit
cell translation vector along the z direction of magnitude d:
Puc(z) = 0 for Izl > d/2-·
and
b(z)
=
1for -Nd/2 < z ~ Nd/2=
0 otherwiseSubstituting equation (11-42) into (II-58) yields:
(11-60)
From the above definition of b(z) we can calculate IB(qz)12 to
obtain:
+Nd/2
IB(qz)12
= [
J
exp[2wiqzz] dz ]2=
(Nd)2 [ sin nNdqz ]2 nNdqzThe multilayer reciprocal lattice function ILn(qz)I2 (equation
II-57) is therefore just the superposition of sincl (7fNdqz) placed at
multiples of the reciprocal lattice vector lid. has
principal maxima at qz
=
'/d.
Between adjacent principal maximaILn(qz)12 has N-I local minima located at multilples of lINd, and N-2
local (auxiliary or secondary) maxima located approximately half way
between the local minima.
As the number of bilayers increases to large N, the Fourier
transform of the multilayer profile box function [B(qz)] approaches a
Dirac delta function. 'The reciprocal lattice or interference function
in turn approaches an infinite series of delta functions spaced at lid
along the qz-axis. The intensity function (equation II-56) is then
simply the modulus squared of the unit cell structure" factor
"sampled" at lid along qz, convoluted with the beam-shape function.
This is simply the Bragg diffraction limit.
For reasonably finite N the intensity function is composed of
diffraction maxima centered near the Bragg limit; the diffraction
maxima may be shifted since the unit cell structure factor modulus
squared is sampled by a superpostion of sincl(7fNdqz) (appendix II).
The intensity function may also contain distinct secondary maxima
depending on Nand W(qz)' The diffraction maxima broaden as N
As the number of bilayers decreases to N
=
1, there is acorresponding broadening and shifting of the diffraction maxima, at
which point I(qz) is no longer sampled [ILn(Qz) I2 --+ constant] and
the observed intensity represents the modulus squared of the unit
cell or bilayer structure factor convoluted with the beam-shape
function.
From the equation (II-60) it can be seen that Pml (z) is
pseudoperiodic in d, and decays to zero at Iz I
=
Nd. This is notsurprising since the multilayer autocorrelation function for a finite
multilayer must of course also be finite. The finite size or extent of
the multilayer is mathematically incorporated into the above. formalism
through b(z). The Fourier transform of
SI
(z) gives rise to the sinc2in the multilayer interference function which broadens the principal
maximaand is responsible for the appearance of secondary maxima in
the intensity function. Sampling of the unit cell profile structure
factor modulus squared by·· the sinc2 also shifts the diffraction
RRFERKNCES FOR CBAPTBR 1'1«)
[2-1J Merzbacher, E., QuantUlDMechanics, John Wiley and Sons, 1970.
[2-2] Baym, G., Lectures on QuantUlDMechanics, Benjamin/Cummings
Publishing Company, 1978.
[2-3J Hoseman, R., Bagchf , S.N., Direct Analysis of Diffraction by
Matter, North-Holland Publishing Company, 1962.
[2-4] Coley, J .M., Diffraction Physics, North-Holland Publishing
Company, 1981.
[2-5J Ashcroft, N.W., Mermin, N.D., Solid State Physics, Holt,
CHAPTER TBIlKE: SAMPLE PREPARATION AND X-RAY METHODS
Part I. Multilayer Preparation
MuItilayers samples were prepared by depositing successive
monolayers of various carboxylic acids using the Langmuir-Blodgett
technique [1-4] onto a flat glass substrate which was made
hydrophobic by covalently binding an octadecyltrichlorosilane (OTS)
monolayer to its surface [3-1]. The arachidic and myristic acids
(Aldrich) had been zone refined with 50 zone passes at a rate of 1
cm/hr and the purity ( >99.995%)of the center fraction confirmed by
Dsa measurements (Dupont 990). Triple distilled water was used in
all stages
ot
the preparation, including distillation over KMn04 toremove organic contaminants.
The Lauda (Messgeriite-Werk, FRG) Langmuir system used for the
deposition process consists of a trough having dimensions of 700 mm
x 150 mm • 6 mm (l,'W,d), a movable barrier perpendicular to the
long-axis of the trough, a stationary barrier parallel to the movable
barrier, a film balance, and electronics to drive the movable barrier,
measure the surface pressure, and
to
monitor the temperature of thesystem. The stationary barrier separates the reference surface from
the surface on which the monolayer of interest is spread (film
surface). The monolayer is contained within the area defined by the
two long axes of the trough and the stationary and movable barriers,
with the maximumsurface area of the film surface being ... 560 cm2•
exerted on the stationary barrier by the reference and film surfaces.
As a monolayer is compressed by the movable barrier, the differential
pressure· measured by the film balance increases. A feedback
mechanism adjusts the position of the movable barrier
to
maintain aconstant surface pressure during the deposition process.
Prior
to
deposition, the trough is clean with chloroform. Aftertwenty minutes (ample time· for all the chloroform to evaporate) the
trough is filled with triple distilled water. The water surface
between the barriers is first aspirated to remove any surface
impurities, and then "compressed"; surface impurities result in a
non-zero differential surface pressure measured between the
reference surface and the film surface. Impurities resulting in
pressures of < 1.0 dyne/em for a film surface of "'15 cm2 are
acceptable.
The carboxylic acids used in this study are solubilised in
chloroform [lmg/ml). A monolayer (2.025 x 10¹⁷ molecules) is spread
upon the clean (see above) water surface between the stationary and
movable barriers, and stabilized for three minutes
to
allow for thechloroform
to
evaporate. Routinely a pressureversus
surface areaisotherm of the carboxylic acid is measured to ascertain the purity of
the carboxylic acid. The shape and collapse pressure of the isotherm
are very reliable indicators .as
to
the quality of the film. After themonolayer film collapses, the water surface is cleaned by aspiration
and a second film is spread. After the film is stabilized and
for twenty minutes. Figure ·..2 [CHs-(CH2)la-COOH] shows the (bottom) isotherms (top). for arachidic pentacosadiynoic These isotherms acid acid and 10,12 are
characteristic of the two compounds, with 10,12 pentacosadiynoic acid
[3-2] exhibiting a broad sigmoidal-like isotherm with a collapse
pressure of 57 dyne/em and the arachidic acid exhibiting a sharper
curve with a collapse pressure of 61 dyne/em.
The multilayers used in the first part of this study consist of a
homologous series of arachidic acid multilayers. The arachidic acid
monolayer was kept at a constant surface pressure of 20 dyne/em
and a temperature of 11.5·0 during the deposition; the subphase was
a ImM OdCI:asolution of pH
<
6.0. The substrate was dipped throughthe monolayer at a rate of 3.0 mm/min.
Since the OTS covered substrate is hydrophobic (due to· the
covalently attached alkane chains), a monolayer of arachidic acid is
deposited onto the substrate surface as the substrate is lowered
through the· arachidic acid monolayer into the sub-phase. As the
specimen (its surface now hydrophilic from the fatty acid carboxyl
groups) is raised from f.he sub-phase through the arachidic acid
monolayer, a second monolayer of fatty acid is deposited onto the
substrate, leaving a hydrophobic surface. This process may be
repeated several times to create a variable number N of arachidic
---Two sets> of multilayers were used in the second study. They
were 1) finite sequences of arachidic acid (A) and myristic acid
[CHs-(CH2) sa-COOH] (M) monolayers and 2) finite sequences of arachidic
acid and 10,12 pentacosadiynoic acid (D) monolayers. The carboxylic
acid monolayers were deposited at a temperature of 17.5·0 at a
constant surface pressure of 15 dyne/cm for the myristic acid and 20
dyne/cm for the arachidic acid and the 10,12 pentacosadiynoic acid;
the subphase was a 1 mMOdOl2solution of pH < 6.0.
The first set of multilayers consist of two arachidic acid
monolayers deposited onto the glass-OTS substrate followed by the
deposition of either a) two arachidic acid monolayers to yield two
arachidic acid bilayers (AAAA), b) one arachidic acid monolayer
followed by a myristic acid inonolayer
to
yield three arachidic acidmonolayers and one myristic acid monolayer (AAAM),or c) two
myristic acid monolayers
to
yield an arachidic acid bilayer followedby a myristic acid bilayer (AAMM).
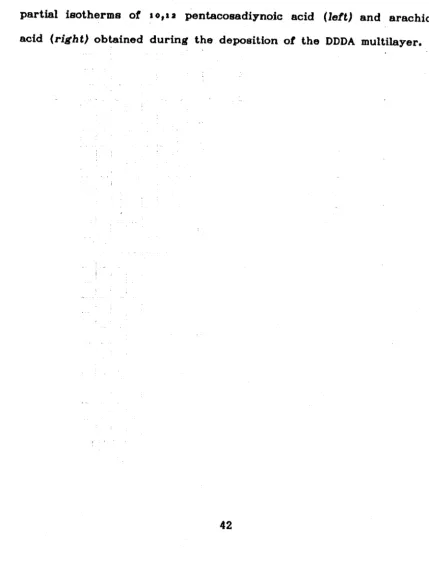
The second set consists of a DDDAmultilayer. The insert (upper
right) in figure 2 shows partial isotherms for 10,12 pentacosadiynoic
acid (left) and arachidic acid (right) for this deposition. After three
monolayers of 10,12 pentacosadiynoic acid were deposited onto the
glass-OTS substrate, the film surface was aspirated and cleaned,
while the multilayer (glaas-OTS subtrate plua three monolayers of
10,12 pentacosadiynoic acid) were below the film surface. A
monolayer of arachidic acid was then spread onto the water surface
surface e- the final arachidic acid monolayer was deposited onto the
multilayer.
Following deposition the 10,12 pentacosadiynoic acid monolayers
in the DDDA multilayer were polymerized with
uv
light to formdiacetylene polymer (the polyene polymer chains being perpendicular
to the monomer hydrocarbon chains) [3-2, 3-3].
After data was collected on the DDDAmultilayer it was washed
for three minutes in 10 mMNaOHto remove the surface arachidic acid
Figure 2
Isotherms for arachidic acid [CH,-(CHa) .. -COOH] (top) and 10,12
pentacosadiynoic acid [CH,-(CHa)lI-C.C-C.C-(CHa).-COOH] (bottom) are
shown. The pressure where each film collapsed in indicated by the
diagonal arrows at the top of each isotherm. The insert shows
partial isotherms of 10,12 pentacosadiynoic acid (left) and arachidic
Part II. X-Ray Diffraction Methods
Meridional x-ray diffraction was observed as a function of qz
[IqzI • (2sin9)/"] (II-45) corresponding
to
elastic momentumtransfersparallel
to
the z-axis perpendicular to the substrate plane," Theincident x-ray beam defines an angle omega (tJ) with the substrate
plane (x-y).
The multilayers were positioned on the tJ axis of a two-axis
diffractometer with a low impedance, position-sensitive linear detector
(PSD) [3-4, 3-5] mounted on the 28 axis. The linear detector was
aligned along the qz direction. An Elliott GX-6 rotating anode x-ray
generator was used to produce OuK x-rays at a target loading of ...
2.5 KW/mmt. Nickel filters were used
to
select the OuKcxline ("=1.54A) which was Une focused parallel
to
the multilayer plane withFrank's optics [3-6, 3-7]. X-ray beam width and the PSD system
resolution result in a 4qz resolution of .... 003A-I. The tull beam
line height (3 mm) was accepted by the PSD over the entire qz range
tor the multilayer specimens investigated due to their small mosaic
spread (see below).
Specimens were kept at room temperature (23-25-0) and at a
relative humidity of
<
0.1% in a sealed canister. Helium paths withthin aluminum toil windows were used to reduce air scattering along
the incident and scattered beam paths.
Omega scans (4Co1
=
.02-) consisting of two minute exposures peromega value were done on each specimen over an omega range from ...
was controlled by a Digital Equipment Corporation PDP11/24 computer.
The sum
ot
these exposures form a composite pattern whichrepresents the meridional intensity function I(O,O,qz)' As the value
of omega is decreased below ... 0.8-, specular scattering due
to
theglass-OTS surface predominates and begins
to
saturate the detector.Scattering in this region of momentum transfer space arises only
from the substrate and the interference between arachidic acid
bilayers and the substrate. Due
to
this intense specular scatteringfrom the substrate, the intensity functions were truncat.ed for qz <
... O.OlA-I. Thus the electron density profiles derived represent
relative and not absolute electron densities.
A plot of the integrated intensity of a diffraction maximumat qz
... lId, where I is an integer and d is the average periodicity in
Angstroms
ot
the multilayer projected onto the z-axis, versus omegagives a "rocking curve" for diffraction maximumI whose FWHMis a
measure of the mosaic spread of the multilayer. Rocking curves for
I = 1, 2, 3 for N=5 and I = 2, 3 for N=l are shown in figure 3,
where N refers to the number of arachidic acid bilayers in the
multilayer. The rocking curve for the first maximumtor N=l could
not be' measured as accurately since the specular scattering
contributes considerable intensity in the region of momentum transfer
space qz ...lId for this multilayer.
Each rocking curve is a composite
ot
a strong, narrow feature atfeature in each rocking curve is "'0.13· and is "'1.50· for the broad
feature. The narrow features in the rocking curves are most likely
due to the well-oriented domains of the multilayers and the broad
features are probably a result of misoriented components. The
relative contribution of oriented versus misoriented domains in the
multilayers remain fairly constant for N=1 to 5. The measured mosaic
spread of the specular scattering from a OTS-glass substrate alone is
"'O.OS· since the beam is focused along qz at the face of the detector.
Hence, beam convergence at the specimen contributes to the measured
mosaic spread of the multilayers.
As mentioned above, specular scattering due to the OTS-glass
substrate predominates the meridional intensity function at qz ~ '"
0.02A-l. It is possible to fit the intensity function derived from an
OTS-glass sample with two exponentials over the range of qz utilized
in these studies. A quickly decaying exponential can be fit to the
very low angle OTS-glass specular scattering, while a slowly decaying
exponential function can be fit to the higher angle part of the
intensity function to correct for substrate background scattering
(figure·4). Similar exponentials were used to correct the meridional
intensity functions of the one, two, three and five bilayer multilayer
specimens. ,The first observable dittract.ion maxima of the intensity
function for the one. bilayer specimen appears as a shoulder at
qz"'0.02A-l on the more intense specular scattering at smaller qzo
This shoulder. can be resolved by subtracting the quickly decaying
the one bilayer sample. The intensity functions for the two, three
and five bilayer samples exhibit a much better resolved first order
diffraction maximum. This occurs since the contribution
to
theintensity function from the multilayer increases quadratically with the
number of bilayers, while· the contribution from the specular
scattering stays nearly the same. This background scattering
correction causes unavoidable errors in determining the relative
magnitude and shape of the first diffraction maximumespecially for
the one bilayer specimen. Data from one bilayer samples collected
with a SIT two-dimensional detector [3-8, 3-9] using synchrotron
radiation aided in the background scattering correction for the one
bilayer data due to the very different two-dimensional shapes of the
diffraction maxima observed from the specimen and the specular
scattering from the substrate.
A Lorentz correction of q z was applied
to
the intensity functionto
correct for the oscillation of the multilayer in the CJ-scan [2-3].Since the specimens have a thickness ranging between ... 50A and
300A, no absorption correction is required for the'" range used. The
qz Lorentz correction fixes the origin in momentum transfer space,
errors in which will change the relative magnitudes of the diffraction
maxima in the corrected intensity function, Io(qz). For the two,
three and five bilayer data sets, a plot of the diffraction order
number versus the center of mass of the meridional diffraction
Figure 3A and 3B
The rocking curves for the five bilayer multilayer are shown in
figure 3A with the solid line the rocking curve for '=1 (attenuated
by a factor of 10), the dotted line the rocking curve for '=2, and the
dashed line the rocking curve for '=3. The rocking curves for the
one bilayer multilayer are shown in figure 3B with the dotted line
the rocking curve for '=2 and the dashed line the rocking curve for
F"igure 3A
},
.,
.,
.,
.,
"
.,
.,
•
•
"
II II..
II III I I
i
I .., ' I I
: i
,
I : ' I I,\ I I
::
"
"
I,
I',
-
...
I ; ..' ..
~~~.#,
~-1",. -." ... .::- ... _ .. _ ... _
o.~
1.e~ 2.8~ 3.e~RELATIVE
OMEGA
ROCKING
CURVE N=5
I-I (*0.10); 1=2; 1-3
F'igure JB
.
~ >.J
~8
(I). z IJJ I-:~
z I~-
• I~~ I I I
....
I <I: ~ U IJJ...
~~c:~---r---r---~---r----~~----~
0.00 1.00 2.00 3.00 4.00 ~.OO 6.00
RELATIVE
OMEGA
ROCKING
CURVE N=l
Figure 4
The solid line shows the OTS-scattering observed as a function
or relative CJ, fitted with two exponential functions (dotted line). For
CJ < ... 0.2- scattering from the OTS-glass substrate exceeds 10· cps.
The detector is count rate limited and begins saturate at a count
~
-~--~-~---ngure 4
)-....
~~
lIJ-...
Z