348 | P a g e
A STEP TOWARDS OPTIMISING THE PROCESS
PARAMETERS IN DRILLING HEMP FIBRE BASED
COMPOSITE USING REGRESSION SUPPORT
SCATTER SEARCH ALGORITHM APPROACH
Dr.D.Ramalingam
1Dr.M.Saravanan
2, R.Rinu Kaarthikeyen
3V.Moorthi
41
Associate Professor, Nehru Institute of Technology, Coimbatore,(India)
2
Principal, SSM Institute of Engineering and Technology, Dindigul, (India)
3
Research Associate, Manager – Engineering, TCMPFL, Chennai, (India)
4
Research Associate, Analyst, D-Tek technology, Coimbatore,
(
India
)
ABSTRACT
Hemp fibre based produced composite is facing difficulty at time of machining especially during conventional
drilling operation. Though the conventional drilling operations are the most economical and efficient, the
damage of the fibres are caused for the quality outcome. This study investigates the impact and influence of the
input drilling parameters (speed and feed) on the resulted damage factor in drilling hemp fibre composite made
with three different fiber volume fractions (10%, 20% and 30%). Taguchi array of experimental plan followed
three levels of speed, four levels in feed. To optimise the values Scatter Search algorithm is employed in
MATLAB programming. Statistical Regression relationship has been framed and hybridization method is used.
The optimum input parameters are identified and revealed.
Keywords
-
Hemp fibre composite, Drilling, Regression, Scatter Search Algorithm, hybridization,
Optimisation, Minitab, MATLAB.
I. INTRODUCTION
349 | P a g e
machining parameters as well as combination. This, stepping towards the optimisation techniques application and locate the optimal combination of cutting parameters along with the identification of the level of influence on the output variables. This attempt reveals on the application of one such optimisation techniques application namely Scatter Search Algorithm to find out the condition for less fibre damage during drilling. Regression model has been initially framed with Minitab software and the degree of influences of the input cutting parameters is anlysed. Also hybridization of Scatter Search Algorithm is effected by feeding the regression values and relationship equation as the input condition in the MATLAB programme.II. LITERATURE REVIEW
Feng [1] has declared through the fractional factorial experimentation method that the machining speed, cutting tool feed rate, the tool geometry and the properties of the work material have a significant influence on the surface quality of the product. Nihat Tosun [2] has stated that the application of grey relational analysis to optimise the drilling process parameters for surface roughness and the burr height is introduced. That attempt particularly notified for grey relational analysis approach successful application to other operations in which presentation is resolute by several parameters at many quality requests. C.C.Tsao [3] has investigated and confirmed the usage of Grey - Taguchi method towards optimizing the machining parameters while conducting milling operations in aluminium alloy. They conclusion was that the grey-Taguchi method is appropriate for solving the surface finish quality and tool flank wear issues in milling process of A6061P-T651 aluminum alloy. Kaymakci et al [4] have investigated through one unique cutting mechanics model to access and forecast the cutting forces in milling, boring, turning and drilling operations towards ensuring the product end quality. That particular operation models join all the material properties, tool geometry, cutting mechanics, process kinematics and structural dynamics together and are applied to envisage force, torque, power in metal cutting operations. Manna and Bhattacharyya [5] have performed an investigation on the machinability of Al/SiC-MMC in turning process. The objective of the investigation reveals that the impact of machining parameters like cutting speed, feed and depth of cut on the cutting force and surface finish criteria were identified for the investigation. Palanisamy et al [6] have revealed through the study about the impact of cutting speed, feed and depth of cut on the cutting tool wear. Regression mathematical modeling and Artificial Neural Network (ANN) are the two modeling techniques they employed in their study towards predicting the tool wear. They have trained the Artificial Neural Network (ANN) with feed forward back propagation for prediction of the tool wear. Azlan Mohd Zain et al. [7] have conducted experiment through an attempt with the application of regression and ANN techniques to devise a model for machining performance estimation. Gaitonde and Karnik [8] have evolved a model for the estimation of the minimum burr size during machining operations with ANN and PSO optimization methods. In this investigation the analysis and forecasting on the optimized parametric combination is carried out through the designated Scatter Search Algorithm.
III. EXPERIMENT AND OBSERVED DATA
350 | P a g e
Table 3.1 Properties of Hemp fibre
Property Quantity
Density (g / cm3) 1.48
Modulus(GPa) 70
Tensile Strength 550-900 Elongation of Failure 1.6
The composite material specimen size is of 100×50×3 mm by hand layup technique. The composite matrix was G.P resin with hardener catalyst and cobalt as the accelerator and the curing was allowed at atmospheric condition for 24 hours.. Experiment conducted on the conventional drilling machine and using the drill diameter as 6 mm. The cutting input cutting variables are cutting speed, feed with the levels as mentioned in Table 3.2. L12 array was taken for the experiment conducted and the fibre damage factor was considered as outcome variables. The machining processes were carried out as dry machining process and subsequently the responses with reference to each observation were arranged in Table 3.3. Then arrived observed experimental data [9] are mentioned in the Table 3.3
Table 3.2 Input cutting parameters level selection
Turning parameters Units Level 1 Level 2 Level 3 Level 4
Cutting Speed (m / min) 40 60 80
Feed (mm /
min)
0.1 0.2 0.3 0.5
Table 3.3 Experimental observed data set
ExpNo
Cutting Speed (m / min)
Feed (mm / min)
Fibre Volume Fraction
10% 20% 30%
Damage factor (Df1) Damage factor(Df2) Damage factor(Df3)
1 40 0.1 1.004 1.008 1.009
2 40 0.2 1.008 1.012 1.018
3 40 0.3 1.020 1.024 1.028
4 40 0.5 1.029 1.032 1.038
5 60 0.1 1.003 1.005 1.006
6 60 0.2 1.005 1.010 1.012
7 60 0.3 1.018 1.020 1.022
8 60 0.5 1.024 1.030 1.032
9
80
0.1
1.001
1.002
1.002
10 80 0.2 1.005 1.008 1.010
11 80 0.3 1.015 1.018 1.020
12 80 0.5 1.021 1.028 1.029
351 | P a g e
IV. MATHEMATICAL MODELLING
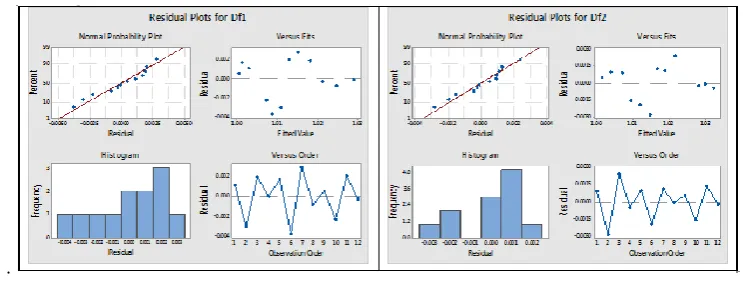
With the Minitab17 software, the influences of the input machining parameters (speed and feed) on the output parameter (fibre damage factor) are analysed by statistical regression relationship. The second order regression relationship between the variables shows higher level significance than the first order regression through the values of the R – sq for all the fibre volume fraction composites. Both the first and second order statistical values of R-sq can be viewed from the Table 4.1.
The second order regression equations through the Minitab17 for the material removal rate in terms of input parameter combination are
Regression Equation of Df1 = 0.9977 - 0.000139 *Cutting speed + 0.1107*feed + 0.000001* Cutting speed^2 –
0.0530* feed^2 - 0.000336 Cutting speed*feed
(4.1)
Regression Equation of Df2 = 1.0064 0.000224 *Cutting speed + 0.0877*feed + 0.000001* Cutting speed^2 0.0462*feed2 + 0.000086*Cutting speed*feed
(4.2)
Regression Equation of Df3 = 1.01472 0.000544*Cutting speed + 0.1249*feed + 0.000003*Cutting speed^2 0.0803*feed^2 - 0.000114*Cutting speed*feed (4.3)
The co efficient of the feed and speed in all equations revealed that the feed is the registering the higher side influence than the speed
.
Figure 4.1 Residual plots of Fibre damage factor DF1 and DF2
352 | P a g e
factor which contributes around 88.6 % whereas the speed exhibits very little amount of influence on the Fibre damage factor..V. PARAMETRIC OPTIMISATION
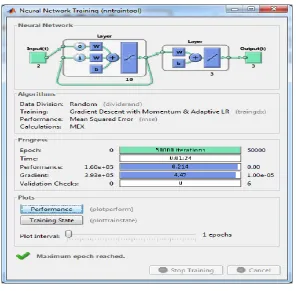
Process optimization is the order of adjusting a process so as to optimize a number of particular groups of parameters. The common goal taken in this analysis is to minimize the fibre damage factor. This is one of the main quantitative components in industrial decision making at time of processing. With the application of programming in the MATLAB R2017 software, an attempt is made in this paper for forecasting of the outcome variable referring to the input process variables with the optimization algorithm namely Scatter Search Algorithm. Forecasting of the optimized fibre damage factor in the drilling process on the Hemp fibre hand layup composite specimen was performed on the primary objective as minimizing the damage outcome. To analyze the influence of the cutting speed and the feed on the Df through MATLAB R2017 platform with the Elman Back Propagation approach is applied. The number of iterations initiated for this simulation is 50000 turns. The compatibility of the employed algorithms is assessed through the accuracy level in computation which is in the form mean squared error occurred rate as the indicator. Figure 5.1 shows the progress of the training data in MATLAB. The accuracy level of the computation is recorded as 0.001258 error value which demonstrates the confidence level on the simulation performed.
Figure 5.1 Data training progress of 50000 iterations
353 | P a g e
Figure 5.2 Block diagram of Regression Hybridization in Scatter Search Algorithm
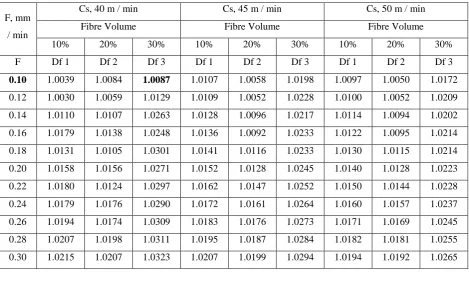
With the view of obtaining a smooth path curve with closer interval values of the process outcomes, the parameters selected was sub divided with the step values 5 mm / min in speed, 0.02 step values in feed. The computed results of the Df1, Df2 and Df3 through this Regression feed SSA GA approach for all combination of the parameter input given to the programme are listed in the Table 5.1 to Table 5.3.
Table 5.1 Simulated values Damage Factors for the Speed 40, 45 and 50 m / min.
F, mm / min
Cs, 40 m / min Cs, 45 m / min Cs, 50 m / min
Fibre Volume Fibre Volume Fibre Volume
10% 20% 30% 10% 20% 30% 10% 20% 30%
F Df 1 Df 2 Df 3 Df 1 Df 2 Df 3 Df 1 Df 2 Df 3
0.10 1.0039 1.0084 1.0087 1.0107 1.0058 1.0198 1.0097 1.0050 1.0172
0.12 1.0030 1.0059 1.0129 1.0109 1.0052 1.0228 1.0100 1.0052 1.0209 0.14 1.0110 1.0107 1.0263 1.0128 1.0096 1.0217 1.0114 1.0094 1.0202 0.16 1.0179 1.0138 1.0248 1.0136 1.0092 1.0233 1.0122 1.0095 1.0214 0.18 1.0131 1.0105 1.0301 1.0141 1.0116 1.0233 1.0130 1.0115 1.0214 0.20 1.0158 1.0156 1.0271 1.0152 1.0128 1.0245 1.0140 1.0128 1.0223 0.22 1.0180 1.0124 1.0297 1.0162 1.0147 1.0252 1.0150 1.0144 1.0228 0.24 1.0179 1.0176 1.0290 1.0172 1.0161 1.0264 1.0160 1.0157 1.0237 0.26 1.0194 1.0174 1.0309 1.0183 1.0176 1.0273 1.0171 1.0169 1.0245 0.28 1.0207 1.0198 1.0311 1.0195 1.0187 1.0284 1.0182 1.0181 1.0255 0.30 1.0215 1.0207 1.0323 1.0207 1.0199 1.0294 1.0194 1.0192 1.0265
Input parameters Cutting Speed, Feed,
Framing Regression equation, compiling output parameter
values
Hybridization of Regression equations in
the Programme
Feed Regression compiled values as
input
Diversification Generation method Start
Improvement Method
Objective Function Evaluation by NNW
Reference Update
Optimized results on Output parameters
354 | P a g e
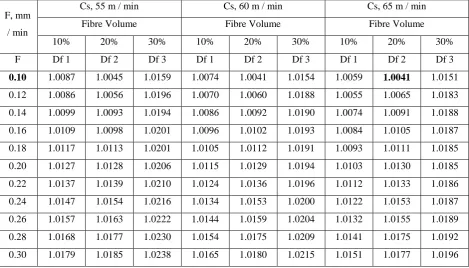
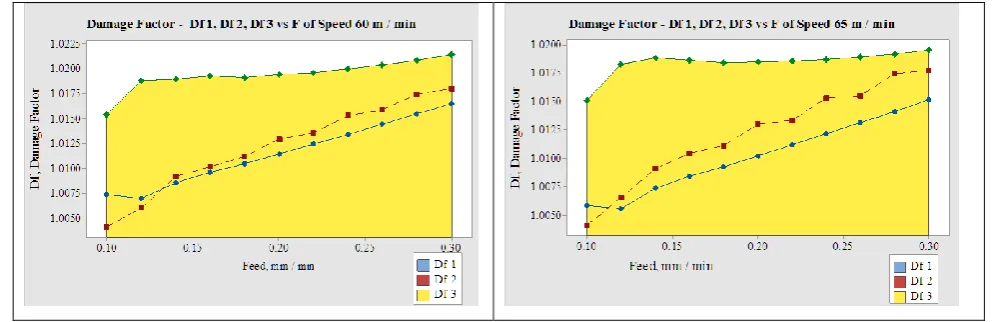
Table 5.2 Simulated values Damage Factors for the Speed 55, 60 and 65 m / min.
F, mm / min
Cs, 55 m / min Cs, 60 m / min Cs, 65 m / min
Fibre Volume Fibre Volume Fibre Volume
10% 20% 30% 10% 20% 30% 10% 20% 30%
F Df 1 Df 2 Df 3 Df 1 Df 2 Df 3 Df 1 Df 2 Df 3
0.10 1.0087 1.0045 1.0159 1.0074 1.0041 1.0154 1.0059 1.0041 1.0151
0.12 1.0086 1.0056 1.0196 1.0070 1.0060 1.0188 1.0055 1.0065 1.0183 0.14 1.0099 1.0093 1.0194 1.0086 1.0092 1.0190 1.0074 1.0091 1.0188 0.16 1.0109 1.0098 1.0201 1.0096 1.0102 1.0193 1.0084 1.0105 1.0187 0.18 1.0117 1.0113 1.0201 1.0105 1.0112 1.0191 1.0093 1.0111 1.0185 0.20 1.0127 1.0128 1.0206 1.0115 1.0129 1.0194 1.0103 1.0130 1.0185 0.22 1.0137 1.0139 1.0210 1.0124 1.0136 1.0196 1.0112 1.0133 1.0186 0.24 1.0147 1.0154 1.0216 1.0134 1.0153 1.0200 1.0122 1.0153 1.0187 0.26 1.0157 1.0163 1.0222 1.0144 1.0159 1.0204 1.0132 1.0155 1.0189 0.28 1.0168 1.0177 1.0230 1.0154 1.0175 1.0209 1.0141 1.0175 1.0192 0.30 1.0179 1.0185 1.0238 1.0165 1.0180 1.0215 1.0151 1.0177 1.0196
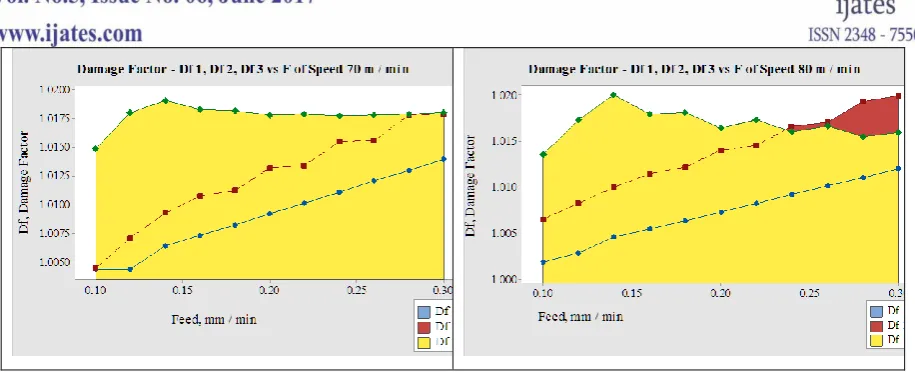
Table 5.3 Simulated values Damage Factors for the Speed 55, 60 and 65 m / min.
F, mm / min
Cs, 70m / min Cs, 75 m / min Cs, 80 m / min
Fibre Volume Fibre Volume Fibre Volume
10% 20% 30% 10% 20% 30% 10% 20% 30%
F Df 1 Df 2 Df 3 Df 1 Df 2 Df 3 Df 1 Df 2 Df 3
0.10 1.0044 1.0044 1.0148 1.0030 1.0052 1.0144 1.0019 1.0066 1.0136
0.12 1.0044 1.0071 1.0180 1.0035 1.0076 1.0178 1.0028 1.0083 1.0174 0.14 1.0064 1.0092 1.0190 1.0055 1.0095 1.0195 1.0046 1.0100 1.0200 0.16 1.0073 1.0107 1.0183 1.0064 1.0110 1.0181 1.0055 1.0115 1.0179 0.18 1.0082 1.0112 1.0181 1.0072 1.0116 1.0180 1.0064 1.0122 1.0181 0.20 1.0092 1.0132 1.0178 1.0082 1.0134 1.0172 1.0073 1.0140 1.0165 0.22 1.0101 1.0134 1.0179 1.0092 1.0138 1.0175 1.0083 1.0145 1.0173 0.24 1.0111 1.0155 1.0177 1.0101 1.0159 1.0169 1.0092 1.0166 1.0161 0.26 1.0120 1.0155 1.0178 1.0110 1.0160 1.0170 1.0102 1.0171 1.0166 0.28 1.0130 1.0178 1.0178 1.0120 1.0183 1.0166 1.0111 1.0193 1.0155 0.30 1.0139 1.0178 1.0180 1.0129 1.0185 1.0168 1.0120 1.0199 1.0160
355 | P a g e
Figure 5.3 Damage factor for the cutting speed 40, 45 m / min
Figure 5.4 Damage factor for the cutting speed 50, 55 m / min
356 | P a g e
Figure 5.6 Damage factor for the cutting speed 70, 80 m / min
VI. RESULTS AND CONCLUSIONS
The secondregression relationship between the input, output variables is significant statistically.
Feed is the major influencing factor which contributes around 88.6 % whereas the speed exhibits very little amount of influence on the Fibre damage factor..
The Scatter Search Algorithm converges with minimum mean squared error value towards optimising the parameters.
On replacing with the random process with regression relationship, feeding the regression computed values as input the accuracy level in computation is tuned to the finest level for the set of values.
The optimum values of Df1, Df2 and Df3 and the input cutting parameters combination through this attempt is shown in the Table 6.1.
Table 6.1Optimised value of damage factor with respect to the input parameters
Fibre Volume Cs F Damage Factor
10 % Volume 80 0.10 1.0019
20 % Volume 65 0.10 1.0041
30 % Volume 40 0.10 1.0087
Processing Engineers may make use of this method of optimisation technique for simulating the outcome values and keeping as reference while doing drilling process in Hemp fibre composites.
REFERENCES
[1] Feng. C.X. 2001, An experimental study of the impact of turning parameters on surface roughness. In: Proceedings of the Industrial Engineering Research Conference, Paper No. 2036. Dallas, TX.
357 | P a g e
[3] Tsao. C.C. 2009, Grey - Taguchi method to optimize the milling parameters of aluminum alloy, Int. J. Adv. Mfg. Tech, vol.40, pp.41- 48.
[4] Kaymakci M, Kilic ZM & Altintas Y, 2012, Unified cutting force model for turning, boring, drilling and milling operations, International Journal of Machine Tools and Manufacture, vol. 54-55, pp. 34-45.
[5] Manna A. & Bhattacharayya B, 2003, A study of machinability of Al-SiC Metal Matrix Composites, Journal of Materials Processing Technology, vol. 140, pp. 711-716.
[6] Palanisamy P, Rajendran I & Shanmugasundaram S, 2008, Prediction of tool wear using regression and ANN models in end-milling operation, International Journal of Advanced Manufacturing Technology, vol. 37, pp. 29-41.
[7] Azlan Mohd Zain, Habibollah Haron, Sultan Noman Qasem and Safian Sharif, 2012, Regression and ANN models for estimating minimum value of machining performance, Applied Mathematical Modelling, vol. 36, pp. 1477-1492.
[8] Gaitonde V.N and Karnik, S.R, 2012, Minimizing burr size in drilling using Artificial Neural Network (ANN) - Particle Swarm Optimization (PSO) approach, J Intell Manuf, vol. 23, pp. 1783-1793.