319 | P a g e
APPLYING SIX SIGMA TECHNIQUES TO REDUCE
THE NUMBER OF DEFECTS OF SOFTWARE
K Selvi
1, Rana Majumdar
21
CSE, ASET/ Amity University, India
2IT, ASET/Amity University, India
ABSTRACT
In the software industry most of the software’s are not meeting the customer’s expectation which leads to lots of
rework and sometimes loss in the business. These rework is due to lack of proper process in the software
development life cycle. In the current scenario most of the software companies adopt the six sigma process to
locate the weak spots in software development process. Six Sigma helps to find effective way out for the located
problems and improve the development processes in order to achieve company’s business goals. The proper
implementation of Six Sigma makes the customer to involve in each and every activity of the development
process. As the result of the customer’s active participation the software quality increases and also fulfills the
needs of the customer. In this paper a project is selected in order to prove that implementation of six sigma
improves the software quality by changing the existing process of the software development.
Keywords
: CTQ, DMAIC, DMADV, DFSS, Fishbone, Six Sigma
I. INTRODUCTION
In any software development, quality of the software is very important to meet the customer satisfaction. The
good quality of the software increases the company’s businesses and also to retain the customers.[4] Software
quality can be increased by performing a proper testing of the software. But testing cannot assure 100% defect
free software. Testing is a phase where the software defects are identified which increases the software quality.
There are many international standards like Total Quality Management (TQM), Compatibility Maturity Model
Integration (CMMI)[2], International Standard Organization (ISO) etc. available for improving the software
quality[5]. Sometimes software can not be able to meet the customer requirements because of the poor output of
the process followed in the software development. Six Sigma is a method which helps in improving the process.
It helps to compare performance of different processes. Based on the Business Philosophy, companies uses the
Six Sigma methods to ensure that customer’s requirements are understood well and its key processes improve
over period of time [7].The goal of this paper is to look at the reduction of the defects of software by
implementing Six Sigma DMAIC process. Process maps of the software development were created, data was
collected and analyzed. Recommendations were drawn from the analyzed data and shown the amount of
reduction of the defects in the project after implementing the recommendations [6].This research paper is
320 | P a g e
methodology. In the subsequent section we presented a case study and through Pareto Chart we show significantimprovement in terms of product Quality.
II. OVERVIEW
In this section the emphasis is on the objective of using Six Sigma and its implementation on software product.
2.1 Six Sigma:
Six Sigma’s goal is to eliminate the deviation of the process from its ideal one. The main idea of Six Sigma is
systematically figure out how to remove the defects to get defects free product. Six Sigma is a highly disciplined
method that focuses on developing and releasing the just right products and services. It was stated that the
accuracy of Six Sigma is 99.99966% i.e. 3.4 Defects Per Million Opportunities (DPMO).
“Six Sigma is not an improvement program. It is instead a business philosophy that employs a step by step
approach to reducing variation, increasing quality, customer satisfaction, and in time, market share” [7] .
2.2 Need of Six Sigma
In this section we tried to identify the most commonly asked question by Quality personal , Why do we adopt
Six Sigma?
Decreases dependency on “Age old Knowledge”
Assessments based on facts and data instead of estimation
Aims high-hanging fruit
Removes chronic / recurring problems
Makes better customer satisfaction
Offers a correct approach to eliminate problem
Transforms the company ethics
Generates a competitive lead
2.3 Project Methodologies of Six Sigma:
In use of Six Sigma Project follow two methodologies, DMAIC and DMADV. Each method consists of five phases.
2.3.1 DMAIC
DMAIC (Define, Measure, Analyze, Improve, Control) process of Six Sigma. If the requirement of the
customer is not fulfilled by the existing software process then DMAIC process is suitable [3].
Define: There are 3 steps in this phase
Preparation of Charter which includes identification of Business Case, Problem and Goal statements, Scope of
321 | P a g e
collecting the voice of the customer, organizing customer’s data, defining the CTQ elements and validating withthe customer.[1]
Process mapping defines the process definition, benefits of Process mapping and the levels of Process.
Measure: Data collection plan is developed and implemented for the project and process sigma value is
calculated.
Analyze: Possible causes are identified first, and then narrowed down to identify root causes of the problem. Tools like Pareto chart, Fishbone diagram are used.
Improve: Based on the root causes identified in the analyze phase a test solution is identified. Then refine that solution and justify it.
Control: Implement the justified solution and also check the quality of the product over time.
2.3.2 DFSS/ DMADV
In Six Sigma terminology the termDFSS is defined as “Design For Six Sigma,” and is just another name for
DMADV [3].
Define: Preparation of Charter which includes identification of Business Case, Problem and Goal statements,
Scope of the project, Milestones and Roles of the team members.
Measure: Customers are identified. Needs of the customer is defined. CTQ’s are determined.
Analyze: Design concepts is developed. High-Level design is developed. High-Level design capability is
evaluated.
Design: Verification plan is prepared.
Verify: Results are analyzed after executing pilot.
III. CASE STUDY
NextGen is a technology framework being developed by OMX Technology to support the development of
advanced trading, clearing and transaction management systems for both large and small exchanges and clearing
houses. It is constructed using a building block concept, whereby a defined set of functionality is combined into
a building block.
NextGen is constructed using a building block concept, whereby a defined set of functionality is combined into
a building block that may have more than one instance operating for replicas and partitioning.
One of the biggest challenge that industry faces today that the number of defects have increased due to
complexity for test designing and test scripts. This has resulted re-work and an increase in turnaround time
which also led to customer dissatisfaction. Six Sigma methodology is implemented in order to reduce the
number of defects in test designing and test scripts.
In this case study we implemented DMAIC process because NextGen was already having its own process but it
322 | P a g e
We design our case study in the following phases they are namely,1. Define
2. Measure
3. Analyze
4. Improvement
5. Control
Define: In the define phase the following areas are decided:
Problem Statement: It has been observed that since last 6 months, the number of defects have increased for
Test Designing and Test Scripts by almost 15%.This has resulted in rework and an increase in Turn around
Time and this has led to Customer Dissatisfaction.
Goal Statement: Reduce the number of defects in test designing and test scripts from 15% to 5% within 3
months.
Project Scope Includes: Session Manager Building Block (BB), Reference Data Manager BB, Trade Handler
BB and Business Operations BB.
Project Scope Excludes: Configuration Management Issues.
Project Story Board
Figure 1 – Project Story Board
Measure:
During the measure phase sample data is collected from each building block for a particular period of time. The
data are collected from the defect log sheet with information like defect type, defect location, complexity, Cause
323 | P a g e
The following are the identified details for the data collection phase:Defects: Number of General Test Specification (GTS) & Test Case Defects (both internal & external)
Data Collection Period: 4 months
Sample Size Taken: GTS Cases: 60
Test Cases: 20
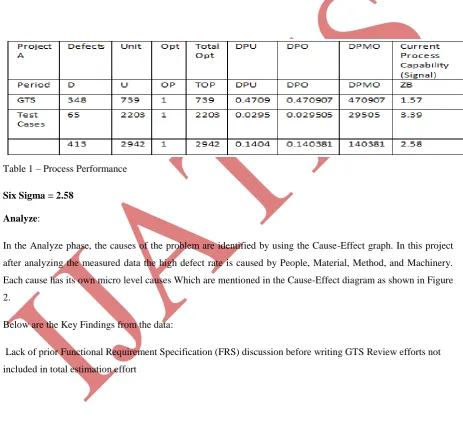
Then sigma value is calculated for the existing process of the NextGen project and sigma value is found to be
2.58 as shown in Table 1.
Table 1 – Process Performance
Six Sigma = 2.58
Analyze:
In the Analyze phase, the causes of the problem are identified by using the Cause-Effect graph. In this project
after analyzing the measured data the high defect rate is caused by People, Material, Method, and Machinery.
Each cause has its own micro level causes Which are mentioned in the Cause-Effect diagram as shown in Figure
2.
Below are the Key Findings from the data:
Lack of prior Functional Requirement Specification (FRS) discussion before writing GTS Review efforts not
included in total estimation effort
• Unavailability of Business Analyst
• Effort estimation and scope of work not base lined
• Review checklist for GTS and Test cases not executed properly
• Requirements not self explanatory
324 | P a g e
• GTS not frozen before starting Test Case implementation
• Offshore team not participating in Defect Review.
The pictorial representation of Cause-effect diagram identifies the possible causes of the problem
Figure 2 -Fishbone diagram
This work used fishbone Diagram that clearly depicts the cause and its effect at different aspect of Quality
Factors at different levels of development as shown in Figure 2. The major categories of the causes of the
problem, defect rate, are identified by asking the question Why? and they are Method, Machinery, People and
Material. The sub-causes of each specific category are identified as shown in the figure 2
Method – No estimation document, No proper technical training, No internal FRS discussion and testcase
review etc.
Material – Requirement not clear, test planning document not clear and no test data
People – Lack of domain knowledge and self-review, Business analyst unavailability, no proper support from
325 | P a g e
Machinery – No proper understanding of TestNGen framework, no proper documentation, virtual machine slowetc.
Improve:
The purpose of the Pareto chart is to highlight the most important among a (typically large) set of factors. In
quality control, it often represents the most common sources of defects, the highest occurring type of defect, or
the most frequent reasons for customer complaints
This research work used Pareto chart as a tool that exhibit quantitatively that 20% of the input factors controls
80% of total defect occurs.
After analysing the data the main categories of the causes are found to be Poor GTS self-review, poor GTS
internal review, poor testcase self review, business analyst unavailability, lack of domain knowledge, no internal
FRS discussion etc. which has the maximum frequency of occurances. To improve on the above mentioned
causes following are the key recommendation:
• FRS discussion between offshore and onsite leads before starting with GTS writing.
• GTS self review and internal review checklist to be executed before delivering the same to onsite. • Test Case self review and internal review checklist to be executed before delivering the same to onsite.
• Monthly cross trainings between BB’s team members for sharing key understanding and new leanings
• Include review time in effort estimation for each task • Business Analyst should be identified
Control
First four points of the key recommendations identified in the improve phase has been implemented and data
collection would be done for a period of 1 month – to verify the results of the recommendations implemented.
In the pilot phase i.e. for a period of one month, total Test cases Delivered are 200 and Total GTS delivered
are 40. Total Customer Reported Defects for testcases are 6 which give the 3% (6*100/200) of defect rate for
that period. Total Customer Reported Defects for GTS are 2 which lead to 5% (2*100/40) of the GTS defect
rate.
In the Improve phase data for a month is collected. Only 3 defects are reported for 138 test cases and 2 defects
326 | P a g e
Table 2 – Process PerformanceSix Sigma = 3.24
IV. CONCULSION
In this study, we share our knowledge about the gradual improvement in the quality of the NextGen software
after implementing Six Sigma method. We have applied DMAIC method in order to improve the existing
process of the testing process of the NextGen project and it is proven that it provides a structured and systematic
way of reducing the defects in the testing phase. The sigma value is also improved from 2.58 to 3.2 which are
calculated in the control phase. Thus six sigma projects to a real project prove its efficiency and effectiveness.
REFERENCES
Web Reference:
[1] Six Sigma en.wikipedia.org/wiki
[2]www.ieee.org.ar/downloads/card-2005-lean-cmmi.pdf
[3]repository.cmu.edu/cgi/viewcontent.cgi?article=1414&context=sei
Proceedings:
[4] Antonio Carlos Tonini,, Mauro de Mesquita SpInola, Fernando Jose Barbin Laurindo “Six Sigma and
Software Development Process: DMAIC Improvements “PICMET 2006 Proceedings, 9-13 July, Istanbul,
Turkey (c) 2006 PICMET
Books:
[5] Zhao Xiaosong, He Zhen, ZhangMin, Wang Jing, Yu Dainuan “Process Integration of Six Sigma and CMMI
Conference:
[6] Zhedan Pan, Hyuncheol Park, Jongmoon Baik,Hojin Choi “A Six Sigma Framework for Software Process
Improvements and its Implementation ” 14th Asia-Pacific Software Engineering Conference.
[7]Mikel Harry “The Breakthrough Management Strategy Revolutionizing the World's Top Corporations”