Optimizing Network Routing by Deducing a
QoS Metric Using Rough Sets
Abstract
The routing within networks, must satisfy the QoS metrics. In traditional data networks, routing is concerned on connectivity or cost. Routing protocols usually characterize the network with one or more metric(s). However, in order to support a wide range of QoS requirements, routing protocols need to have a more complex model. The network is characterized with multiple metrics such as bandwidth, delay, jitters, loss rate, authentication, security,…etc. This complex model necessitates a long time to proceed. The Rough Set Theory (RST) is applied to
reduce these metrics successfully and decide the most effective ones. In this paper, RST is applied to reduce the on-line metrics that are reported by Routing Information Protocols (RIP). The paper represents information about network elements (links, or nodes) to obtain the Quality of Service (QoS) core [1]. ROSETTA software is applied to deduce a QoS metric as a substitution for all routing metrics. This metric is used to select the optimal routes. The results confirm that the proposed metric is adequately suit for selecting the proper routes.
Keywords: RST, ROSETTA, QoSMR, RQoSR.
1. Introduction
Data networks support the basic services such as file transfer or e-mail. Organizing services necessitates intelligent algorithms to attain the optimal issues. Intelligent routing based on knowledge about the states of the network elements support a rich variety of services at a higher level of quality. The different services imply particular quality requirements that need to be fulfilled to attain users' satisfaction and to guarantee a certain level of performance. The term QoS is used to describe network parameters that explores the network performance. QoS Metric for Routing (QoSMR) concludes bit rate, delay, jitter, packet loss rate, authentication, security , bit error rate, packet length, and network capacity.
New applications, such as video conferencing, IP telephony, VPN, SSH, and e-commerce are taken in consideration. Current routing protocols provision, lack to support some services. Traffic between two endpoints is typically forwarded on the same path, even if there are other alternative paths with better instantaneous properties[2]. The shortest path is selected, regarding a single metric or mixed metrics (e.g. EIGRP) that may not reflect the availability of resources [2]. Almes, et al.[2,3,4] use single metric; while Wang and Crowcroft [5] used both delay and bandwidth to design a two-dimensional metric. Congestion may occur on the shortest path[6], this degrades traffic performance, despite the low utilization of network resources on the alternative paths.
The need for QoS
The paper proposes a general purpose metric QoSMR, that evaluate the network performance. This metric sorts the
best paths regarding the on-line information about network elements. The QoSMR concludes many parameters, the RST is applied to reduce number of parameters and calculate a core metric. Usually, the link is classified by many parameters such as link propagation delay, available bandwidth, jitters, possibility of connection, effective load, queue length, and hop-counts[7]. Concluding these metrics consumes a long time to decide the best route. So, the Reduced QoS for Routing (RQoSR) is a significant one. The decision system that produces a reduced performance
attributes, is very important for data analysis and knowledge discovery. ROSETTA software is used to calculate the reduct . This is important for speeding up the processes of learning, evaluation and deciding the route with the proper quality. The work presented here is based on deciding the link-rank by a series of the link-state attributions. In this paper, the QoSMR is evaluated under different QoS requirements based on actual traffic measurements. RST attributes' reduct is a subset of attributes that are sufficiently joint and individually express a particular property of the information table. This paper concludes metrics reduced to reach a QoS metric (RQoSR) which represents the
most effective performance metrics. The rest of the paper is organized as follows: Section 2, describes the related knowledge about QoS routing metric. Section 3, summarizes the basic concepts of rough sets. Section 4, presents an Ali.A.Sakr , PhD.
Computer Eng. Dep. Faculty of Engineering,
KFS University ,Egypt [email protected]
A.M.Kozae , PhD. Pure Mathematics Dep.,
Faculty of Science, Tanta University ,Egypt
M.Elshafae , PhD. Pure Mathematics Dep.
Faculty of Science, Mansoura University ,Egypt
overview of ROSETTA. Section 5, presents test conditions and analysis of the results concerning routing performance. Section 6, presents the main conclusions and issues to be addressed in the future works .
2. Related QoS routing Metrics
In this section, we present some problems to find a proper route, subject to performance constraints, and then discuss metric selection based on review analysis.The problem in using QoSMR [6] is much more complicated, since the resource requirements are often application-dependent. The computation complexity is primarily determined by the rules of the metrics. Routing metrics identify the network routes. They have major implications not only on the
complexity of path computation, but also on the requirements that can be supported. Metrics are used by the routing
protocol to calculate the best path to a given destination. Network operating system (NOS) learns multiple paths to the same destination. One of them is the optimal under the current situations, the others may be selected as alternative or risky routes, in the case that a problem may occur at the optimal route. Each routing protocol uses a metric or more different metrics to select the optimal route.
2.1 Properties of the Entire QoS Metric
Metrics can be categories regarding a set of constraints [8].
a. Link properties: Link delays are aggregated to attain the entire metric for a path. The minimum bandwidth of a
link controls the entire bandwidth for the path.
b. Dynamic vs. Static: A metric is dynamic, if the value of the metric changes over time. This is the case for most
metrics. Static metrics are rarely applied, they suit the uniform traffic within stable networks.
c. Symmetric vs. Asymmetric: Let dij be the metric value of the link from node i to node j and dji the metric value of
link in the opposite direction. A metric is symmetric if dij = dji holds for all links during all time.
d. Single-Dimensional vs. Multi-dimensional metrics: Multi-dimensional metrics are vectors of metrics. Wang and
Crowcroft [5] used delay and bandwidth for the design of a two-dimensional metric. Iannone et al. [9] used the PLR (packet loss ratio), interference level and data rate for the design of a three-dimensional metric. The multi-dimensional metrics are (multiple metrics) can be decomposed into set of single- metrics. Wang and Crowcroft [5] proved that finding a shortest path in a network with multiple metrics can be decomposed into set of single metrics. Such metrics are compost by multiplicative and additive rules[8].
2.2. Metric composition rules
The computation complexity is primarily determined by the composition rules of the metrics. There are three basic composition rules:
a. Additive rule; where
m(path)=
n ( )i
i
link
m
For example, suppose that a path has two segments ab and bc . If metric m(p) is delay, the aggregated rule is : m( ab, bc) = m( ab )+ m( bc)
b. Multiplicative rule; where
m(path) = ( )
link
i ni
m
For example, suppose that a path has two segments ab and bc . If metric m(p) is reliability, the entire rule is : m( ab,bc) = m( ab )* m ( bc)
c. Concave rule; where
m(path)= min m(
link
)i i, i=1, 2, 3… n
For example, suppose that a path has two segments ab and bc . If metric m(p) is bandwidth, the entire rule is : m(ab,bc ) = min [ f(ab) , f(bc)].
2.3. Path computation
Source routing and hop-by-hop routing are the two basic routing approaches for data networks. Hop-by-hop
routing is the common form of general-purpose routing in current networks while source routing is mainly used for
the source routing (end-to-end) is defined it the source. The source routing suit the stable network, while the hop-by-hop routing is more suitable for the dynamic networks. During this paper, we use the source routing. We imply
the path metrics for computing QoS routing. Complexity of routing metrics is based on the range of QoS requirements. Next factors are taken in consideration:
a. For any selected metric, efficient algorithms must exist for path computation. The complexity of the route
algorithms should be compared to that of the current routing algorithms. Any algorithm should be able to work in any environment .
b. The metrics must reflect the basic characteristics of a network. The information they contain should make it
possible to support QoS requirements. These requirements are mapped onto the constraints and expressed in terms of the metrics. Thus the metrics, determine the types of QoS that the network can support. If cost and bandwidth are the metrics, all QoS requirements have to be mapped onto cost and bandwidth. Some requirements such as reliability obviously can not be supported by such metrics.
c. Metrics should be orthogonal to each other so that, there should no redundant information among the metrics.
Redundant information can reflect the dependency among the metrics which makes it impossible to evaluate each metric independently. Recursive evaluation among metrics can complicate path computation. Network characteristic are compared regarding single, mixed or multiple metrics.
Single ,Mixed and Multiple Metrics
Path computation algorithms for a single metric, such as delay or hop-count, are widely used in current networks. Thus, a single metric can partially support the QoS requirements.
Our paper concerns on generating a single metric that composes multiple parameters. The idea is to mix various pieces of information into a single metric and use it as a basis for routing decisions. For example, a mixed metric m
may be produced with bandwidth B , delay D and loss rate L with a formula
) ( ) ( ) ( ) ( p L p D p B p m .
A path is likely to be a better choice in terms of bandwidth, delay and loss rate. Single mixed metric, can be used as an indicator, it does not contain sufficient information to assess whether QoS requirements can be met or not. Suppose that a path has two segments ab and bc , then the entire metric for path is neither additive nor multiplicative [8]. ) ( * ) ( )) ( ) ( ( ) ( ), ( min( ) ( bc L ab L bc D ab D bc B ab B ac m
The mixed metric approach is a heuristic but it can be used as an indicator in path selection. Multiple metrics can certainly model a network more accurately. These metrics concern in finding a path subject to multiple constraints [8]. A simple problem with two constraints called "shortest weight-constrained path" was listed in [11] .
2.4 Paper Considered Metrics
According to these aspects, the paper involves several metrics embedded on one metric, which perfectly identify the optimal route. This metric includes:
a. Delay
Delay, includes the latency and transmission time. The delay metric [7] measures the time to send and receive a unicast packet from one node to another. The principal approach used is an on-line probe. Delay is divided into six phases. The queuing delays: sending delay QS and receiving delay QR, processing delays: PS and PR, transmission delay T and propagation delay P. Given a bandwidth BW, the transmission delay for a packet of b bits equals b/BW. Thus, the overall delay D follows the equation
D = PS + PR + QS + QR + Bw b + P
The entire delay is measured for the path by adding the sequenced delays for each link separately. The propagation delay may be little and neglectable. When a multi-path routing algorithm is used, multiple probes on different paths will report different delays. There is a number of attributes are recorded such as: minimal delay, maximal delay, average jitter, etc.
b. Delay Variation
the term jitter. The variance Var(X) is defined as the expected value for the squares of sum of errors = E((X − μ)2) where μ is the mean value and X is the measured value. The term jitter, is:
Jitter= Maximum Latency-Minimum Latency.
Where Latency is the delay that an application can tolerate in delivering a packet of data. This quantity is used as a measure of the change in link delay. A path with a smaller jitter is more stable and typically preferable. The delay variation metric is subject to real time restrictions as video teleconferencing. The delay variation depends on the size of the buffers. The delay variation is measured for the entire path. We can calculate the metric for a path, by means of the mean and variance on each link. The entire variation = the sum of variations within the individual links. This is fulfilled for uncorrelated values. For the correlated jitters, the covariance metric must be taken in consideration.
c. Bandwidth (BW)
BW, capacity, flow capacity, net bit rate are all metrics related to BW[7]. BW is the data which can be sent over a link within a time unit or data which can be processed within a node within a time unit. The terms: flow, capacity, bottleneck bandwidth are in the same sense[12]. The BW metric is a concave function, i.e. when the links of a path are concatenated; the minimal bandwidth determines the objective of the whole path
) ( min )
( Bw link i
i path
Bw
When a multi-path routing protocol is used, the BW of two parallel links is the sum of BW's in both links.
d. Connection possibility
Correction possibility, admissibility, access control, sustainability, authorization, and authentication, are related
metrics. Sometimes a traffic may be not allowed to be transit over a specific element. Apache [13] discussed the distinct ways that deal with the traffic and may result in blocking the resource. Authentication is the process by
which the networks verify that user is whom activate the service. This usually involves a username, a password , Access Control List (ACL), or any other method for demonstrating the identity such as a smart card, retina scan, voice recognition, or fingerprints. Authorization routines decide if the person, is allowed to proceed the service.
This is usually determined by finding out the ACL. This list may be dynamic regarding if that person has paid for admission, or has a particular level of security. Access control is also a way of controlling access to a web resource.
Access can be granted or denied according to a wide variety of criteria, such as the network address of the client, the time of access, or the browser which the visitor is using. Access control is a key that de-encrypt the locked resources. These techniques are so closely related. So, we consider them as a single metric may be called Connection possibility (CP). CP metric is a concave function, i.e. when the links of a path are concatenated, the
minimal CP determines the possibility of the whole path.
) ( min )
( CP link i
i path
CP
e. Bit error ratio
Bit Error Rate (BER), Block error rate, Packet loss ratio are all related metrics for BER. BER is the number of
faulty received bits divided by the total number of transferred bits. The faulty bits may be those that have been altered due to noise (random fluctuation in an electrical signal), interference and distortion (alteration of the original shape), during a time interval[7]. BER is a measure, expressed as a ratio number. The packet error rate (PER) or block error rate, is the number of incorrectly transferred packets divided by number of the transferred packets. A packet is assumed to be incorrect if at least one bit is incorrect. The expectation value of the PER is expressed as:
PER = Pe /N
assuming that Pe is the erroneous packets and N is number of packets. BER metric is multiplicative, i.e. when the links of a path are concatenated, the total bit error ratio of the whole path.
i link i BER path
BER( ) ( )
3. Rough Sets and Applications
RST is a way for representing and reasoning imprecise and uncertain information regarding the concept of indiscernibility [13]. RST deals with the approximation of sets constructed from empirical data. RST is helpful when trying to discover the decision rules, and minimize the conditional attributes. There are four important concepts to discuss when talking about RST: decision tables, indiscernibility, reduction of attributes, and dependency. Decision Tables (DT) have the form T = (U, C,D), where U is a universe made up of a non-empty
Table 1. A Network Example for Decision Table (DT)
Link
Num. Bandwidth Delay Loss rate Link rank
1 wide high moderate R
2 wide low moderate VR
3 wide high high R
4 narrow low low R
5 narrow low high NR
6 narrow high high NR
7 wide high high NR
Where R is the recommended rank, VR is strongly recommended and NR is a not recommended rank. Discerning
objects from each other, is a major goal in RST. This is conveyed by saying that for any subset B
A,INDT (B) = {( O , O` )
U2 a B, a(O) = a(O`)}where INDIS (B) is the B-indiscernibility relation [15]. Therefore, if (O, O`) INDT (B) object O and O` are indiscernible from each other by attribute set B. One of the important aspects in the analysis of DT extracted from
data, is the elimination of redundant attributes and identification of the most important attributes. Redundant attributes are attributes that could be eliminated without affecting the degree of dependency between the remaining attributes. The degree of dependency is a measure used to convey the ability to discern objects from each other. The minimum subset of attributes preserving the dependency degree is termed reduct. A reduct of knowledge is its
essential part, whichdefines all basic concepts occurring in the consideredknowledge. Formally, a subset B C is
a reduct of C if B is independent and IND(B) = IND(C). An attribute is considered independent if no loss of
discerning power is made from the removal of this attribute. Obviously C may have many reducts. A DT with fifty
conditional attributes may be sufficiently discerned using only three attributes. Thus, performing reducts on the data can significantly reduce the amount of information required in order to discern between decisions [1].
4. Overview of ROSETTA
The ROSETTA system has been developed by two groups: Knowledge Systems Group at NTNU, Norway, and Group of Logic, Warsaw University, Poland, under the guidance of Jan Komorowski and Andrzej Skowron respectively[15]. ROSETTA is a toolkit for analyzing a tabular data within the framework of RST[16]. ROSETTA is designed to support the data mining and knowledge discovery process starting from browsing and preprocessing of data, via computation of minimal attribute sets and ending with the generation of if-then rules or descriptive patterns. ROSETTA also validates and analyzes the induced rules or patterns. ROSETTA software gets good
results for reduced information tables, can discover the optimal results. The paper uses ROSETTA GUI version
1.4.41 rough sets toolkit for multiple reducts generation[15]. These reducts are the same obtained by Genetic Algorithm (GA) and John- son's Algorithm with the default option of full discernibility [15].
The intersection of all the possible reducts is called the core. The core contains the most important information of
the original data set. The experimental results in section 5 show that, data preprocessing on removing inconsistent
data is important for generating the reducts. The GA provided by ROSETTA can be used to generate multiple
reducts, all the reducts contain the core attributes. Some rules generated from Johnson's reduct contain the core attributes[15]. We are studied the effects of core attributes on improving the utility of rules in order to evaluate the importance of metric.
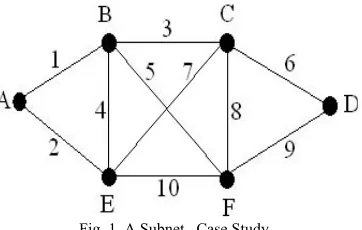
5. Analyzing Test Conditions Concerning Network Routes :
Fig. 1. A Subnet , Case Study
5.1 Building the Information System (IS)
Measured values of the attributes have been collected for the described subnet links. Information about available bandwidth, propagation delay, link jitter, bit error ratio and connection possibility have been gathered for each link. The application starts with an appropriate discrimination of the IS by translating the values to attributes {a1, a2, . . . , a5} and decision attribute {d}. Then, condition attributes and the decision attribute are coded. The
condition attributes and the decision attribute are coded into number of qualitative terms, such as: very low, low, high and very high. The qualitative terms of the condition attributes are then coded using natural numbers, whereas, the qualitative terms of the decision attribute is coded into ranks that can be described by I, II, ..., VI . The coded IS is given in Table2.
Table 2. Information System of Links
Link no.
Available BW (c1 )
Propagation delay
(c2 )
Link Jitter (c3 )
Bit error
ratio (c4)
Connection Possibility
(c5 )
Link rank {d }
1 4 4 1 5 3 IV
2 5 3 1 8 2 III
3 1 4 3 5 3 IV
4 1 4 3 5 1 VI
5 6 2 2 3 2 II
6 3 4 3 5 1 IV
7 5 1 1 3 1 V
8 3 1 0 3 3 I
9 7 5 4 1 3 III
10 8 1 1 2 3 I
The next relation is a proposed value for determining QoS for the route.
QoSMR = Max
j( Min (Bw
i) + Min (Cp
i) + (1/
D
i) + (1/
J
i) + (1/
BER
i))
For everylink iwithin the route j. This relation includes the main factors that affect the decision to identify the optimal route. This may necessitate many operations to compute the value of QoS, which must be computed for all routes between each source – destination pair. So we have to reduce these parameters to reduce the time to decide the optimal route.
5.2 Reduction of Information Table
The next step of the rough set analysis is to construct minimal subsets of independent attributes, ensuring the same quality of classification, as with the whole set. Y. Liu et al. [1] used RST in reducing IS using the discernibility
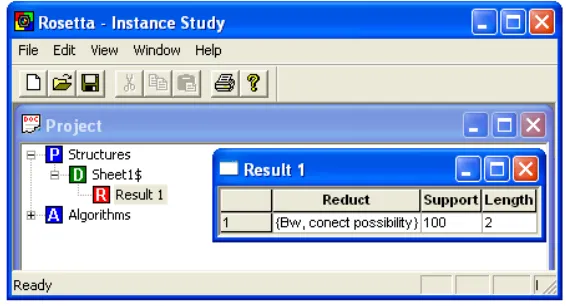
From preprocessing of the data, to reduct computation and rule synthesizing. Applying ROSETTA to the described
IS in table2, as shown in Fig. 2, these attributes are reduced as shown in ROSETTA case study in Fig. 3.
Fig. 2. The ROSETTA IS
Fig. 3. The Reduct Computed by ROSETTA
Thus, table 2 can be reduced to form table 3.
Table 3.The Reduced Information Table for Table 2.
Link Num.
Available bandwidth
(c1 )
Correction Possibility
(c5 )
Link rank
{d }
1 4 3 IV
2 5 2 III
3 1 3 IV
4 1 1 VI
5 6 2 II
6 3 1 IV
7 5 1 V
8 3 3 I
9 7 3 III
5.3 Analysis of Results
For every set of attributes BA, The equivalence class of Ind(B) is called elementary set in B. Each row in this table describes one elementary set, where the whole table describe the IS studied. The notation U/A means that we are considering elementary sets of the universe U in the space A, .i.e corresponding to the whole set of attributes {c1,c2, c3, c4,c5}. Let us group all objects based on the five characteristics considered as shown in Table 4.
Table 4. The Elementary Sets of U/A
U/A c1 c2 c3 c4 c5
{x1} 4 4 1 5 3
{x2} 5 3 1 8 2
{x3} 1 4 3 5 3
{x4} 1 4 3 5 1
{x5} 6 2 2 3 2
{x6} 3 4 3 5 1
{x7} 5 1 1 3 1
{x8} 3 1 0 3 3
{x9} 7 5 4 1 3
{x10} 8 1 1 2 3
The ROSETTA results shown in Fig.3, indicate that the most important attributes are c1 and c5 . Then the indiscernibility relation is limited to the subset B= {c1,c5}, the resulting elementary sets are shown in Table 5.
Table 5. The Elementary Sets of U/B
U/B c1 c5
{x1} 4 3
{x2} 5 2
{x3} 1 3
{x4} 1 1
{x5} 6 2
{x6} 3 1
{x7} 5 1
{x8} 3 3
{x9} 7 3
{x10} 8 3
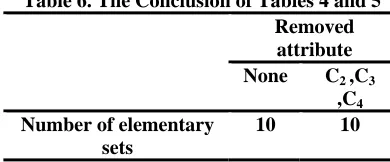
It is inherent that table 5, gives the same information of table 4 but with reduced attributes. This conclusion is shown in table 6, i.e removing attributes c2 , c3 and c4, we obtain the information system identical with that presented in
Table 4.
Table 6. The Conclusion of Tables 4 and 5 Removed
attribute None C2 ,C3
,C4
Number of elementary sets
10 10
Elimination of the superfluous attributes results in a simplified information set. This resultsin
Reduct (A) = { c1, c5},
link iwithin the route j. Accordingly, the two metrics, Bw and Connect possibility can supersede the QoS metrics presented by IS. Subsequently, the considered RQoSR metric can be employed as a fitness for routing. Accordingly,
we can candidate the maximum three routes that accomplish the maximum RQoSR values.
The route with maximum capacity of bandwidth and max. possibility of connection is chosen as the optimal route.
The route with the second RQoSR value is chosen as the Alternative route, and the route with the third value is
chosen as the Risky route .
The alternative route is selected and used, in case of instantaneous traffic problems with the optimal route. Risky route is selected in case traffic problems with optimal and alternative routes. Traffic problems may be: network
congestion, spatial fail, or spatial spam flood. Alternative path routing [18] has been well-explored in telecommunication networks as a mean of decreasing the blocking rate and increasing network utility. Table 7, indicates the computed values for QoSMR and the RQoSR for the eight routes available for the subnet of fig1.
Table 7. Values of QoSMR and RQoSR for Subnet, Fig. 1 Route
no.
route QoSMR RQoSR
1 ABCD 2.334 2
2 AEFD 7.3395 7
3 ABFD 6.294 6
4 AECD 4.3333 4
5 AEBCD 2.167 2
6 ABEFD 2.2021 2
7 AEBFD 2.1793 2
8 ABECD 2.203 2
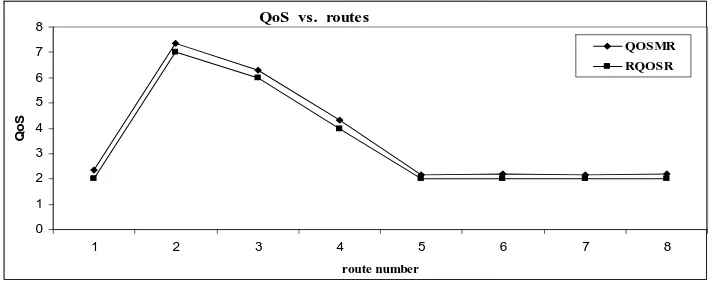
In this table, route no. 2 is the optimal route, no. 3 is the alternative route and no.4 is the risky route. It is apparent that the optimality states of both QoSMR and RQoSR are at the same routes, i.e. they select the same route.
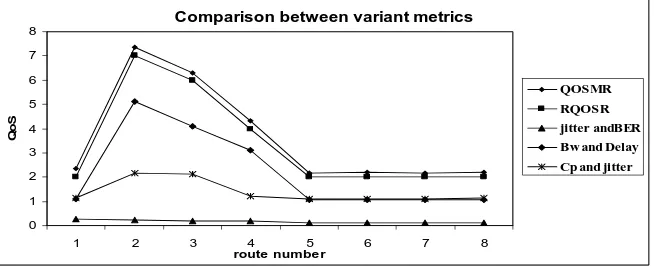
Network protocols which compensates packet loss, propagation delay, and jitters, keep the same network state, even after reducing these metrics. Thus, networks using the proposed protocol RQoSR can exhibit same state under the same level of load, with the difference in the computing time for route decision. Fig 4 , indicates that both QoSMR and RQoSR have maximum value for the same route, this results in selecting the same route. This is accomplished also for both alternative and risky routes.
QoS vs. routes
0 1 2 3 4 5 6 7 8
1 2 3 4 5 6 7 8
route number
Qo
S
QOSMR RQOSR
Fig 4. The Optimal Routes Using QoSMR and RQoSR
Comparison between variant metrics
0 1 2 3 4 5 6 7 8
1 2 3 4 5 6 7 8
route number
Qo
S
QOSMR RQOSR jitter andBER Bw and Delay Cp and jitter
Fig. 5 Comparison Between Effect of Metrics
6 Conclusion
The traditional solutions for Routing problems, such as Dijkstra algorithms, OSPF, used DP methodologies. These tools used one or more metrics and ignored the others. This causes confliction in route selection and results in long processing time to decide the proper solution. . This paper applied multiple metrics for deciding the optimal path. The paper reduced these metrics using RST and ROSETTA software. the paper presented a mathematical model for QoS to be used to select the optimal routes, then reduced the slightly effective metrics to reduce the processing time. The paper used both RST and ROSETTA to reduce these attributes. The results show that the proposed RQoSR is
an adequate metric at selecting the best route in network. For a future work, we think of using GA crossover and intelligent mutations to find the optimal routes using the QoS metric.
References
[1] Yanbing Liu , Hong Tang, Menghao Wang, and Shixin Sun: Routing Attribute Data Mining Based on Rough Set Theory. In Springer Berlin / Heidelberg, Volume 3584/2005, ISBN 978-3-540-27894-8, pages276-283, 2005.
[2] G. Almes, S. Kalidindi, and M. Zekauskas. A one-way delay metric for IPPM. IETF RFC 2679,September 1999.
[3] G. Almes, S. Kalidindi, and M. Zekauskas. A one-way packet loss metric for IPPM. IETF RFC 2680, September 1999
[4] G. Almes, S. Kalidindi, and M. Zekauskas. A round-trip delay metric for IPPM. IETF RFC 2681, September 1999.
[5] Z. Wang and J. Crowcroft. Quality-of-service routing for supporting multimedia applications. IEEE Journal on Selected Area Communications, 14:1228-1234, 1996.
[6] Douglas S. J. De Couto, Daniel Aguayo, Benjamin A. Chambers, and Robert Morris. Performance of multi-hop wireless networks:
Shortest path is not enough. In Proceedings of the First Workshop on Hot Topics in Networks (Hot Nets-I), ACM SIGCOMM., Princeton, New Jersey, October 2002.
[7] Rainer Baumann, Simon Heimlicher, Mario Strasser, Andreas Weibel: A Survey on Routing Metrics. Citeseer, TIK Report 262, February 2007.
[8] John G. Klincewicz ,Handbook Of Optimization In Telecommunications : Issues In Quality Of Service. In Springer US, ISBN
978-0-387-30662-9 (Print) 978-0-387-30165-5 , pages 435-458, December 2008.
[9] L. Iannone, R. Khalili, K. Salamatian, and S. Fdida. Cross-layer routing in wireless mesh networks. 1st International Symposium on Wireless Communication Systems, pages 319– 323, 2004.
[10] D. Estrin, Y. Rekhter, S. Hotz, "Scalable Inter-Domain Routing Architecture", In Proceedings of ACM SIGCOMM’92, Maryland,
August 1992.
[11] M. R. Garey, D. S. Johnson, "Computers and Intractability - A Guide to the Theory of NP Completeness", Freeman, California, USA. Citeseer, TIK Report 262, February 2007.
[12] Robert L. Carter and Mark E. Crovella. Measuring bottleneck link speed in packet-switched networks. PerformanceEvaluation ,27-28:297–318, October 1996. Available on: http: //apache. org/docs/1.3/howto/auth.html #access.
[13] B. Walczak , D.L. Massart: Tutorial Rough sets theory. Elsevier, Chem. metrics and intelligent Laboratory Systems 47_1999.1–16,
December 1998.
[14] Joseph Herbert, Jing Tao Yao, Time-Series Data Analysis with Rough Sets. Citeseer, CIEF, 2005.
[15] A. Qhrn. Discernibility and Rough Sets in Medicine: Tools and Applications. PhD thesis, Norweigian University of science and Technology, December 1999.ISBN 82-7984-014-1. Available on: http://www.idi.ntnu.no/~aleks/ thesis/.
[16] A. Qhrn Discernibility and Rough Sets , Available on http://en.bio-soft.net/chip/ Rosetta. html.
[17] Aleksander Ohrn: ROSETTA Technical Reference Manual. Department of Computer and Information Science, Norwegian University of Science and Technology, Trondheim, Norway. May 25, 2001.