University of New Hampshire Scholars' Repository
University of New Hampshire Scholars' Repository
Psychology Scholarship College of Liberal Arts (COLA)
5-2-2018
(2018) Employees high in personal intelligence differ in workplace
(2018) Employees high in personal intelligence differ in workplace
perceptions and behavior from their colleagues
perceptions and behavior from their colleagues
John D. Mayer
University of New Hampshire, Durham, [email protected]
Brendan Lortie A. T. Panter
University of North Carolina
David R. Caruso
Yale University
Follow this and additional works at: https://scholars.unh.edu/psych_facpub
Recommended Citation Recommended Citation
Mayer, J. D., Lortie, B., Panter, A. T., & Caruso, D. (2018). Employees high in personal intelligence differ in workplace perceptions and behavior from their colleagues. Journal of Personality Assessment, 00, 000-000 [First published online]. https://doi.org/10.1080/00223891.2018.1455690
This Article is brought to you for free and open access by the College of Liberal Arts (COLA) at University of New Hampshire Scholars' Repository. It has been accepted for inclusion in Psychology Scholarship by an authorized administrator of University of New Hampshire Scholars' Repository. For more information, please contact
RUNNING HEAD: PERSONAL INTELLIGENCE AT WORK
Employees High in Personal Intelligence Differ from their Colleagues in
Workplace Perceptions and Behavior
John D. Mayer
University of New Hampshire Brendan Lortie
University of New Hampshire A. T. Panter
University of North Carolina at Chapel Hill David R. Caruso
Yale University
Author Notes
The authors are grateful to Mariah Moore who participated in the early stages of this research and who generously made her undergraduate thesis data available for Study 1. The Gump Family Undergraduate Research Fund, administered by Honors Carolina, provided funding to Mariah Moore; the Undergraduate Research Opportunity Program of the University of New Hampshire and the the third author’s research funds from the University of North Carolina provided funding to Brendan Lortie. The authors also thank Victoria M. Bryan for assistance in reviewing the tables and Drs. Peter Gordon and David Thissen for their comments on the research.
Correspondence regarding this manuscript may be directed to John D. Mayer, Department of Psychology, University of New Hampshire, Durham, NH, 03824.
In press, Journal of Personality Assessment
Abstract
Personal intelligence (PI) involves the ability to recognize, reason, and to use information about personality to understand oneself and other people. Employees in two studies (N = 394; 482) completed the Test of Personal Intelligence (TOPI, e.g., Mayer, Panter, & Caruso, 2017a) and assessments of workplace perception and behavior. Higher personal intelligence was associated with higher perceived workplace support and lower counterproductive work behavior. These relationships continued to hold after controlling for other key variables. The results indicate the TOPI, although still in research trials, shows promise as a screening device for selecting employees and targeting
individuals for training.
Key words: personal intelligence, workplace support, counterproductive work behavior, big five
Prepublication version of:
Employees High in Personal Intelligence Differ from their Colleagues in
Workplace Perceptions and Behavior
The theory of personal intelligence describes people’s ability to accurately reason about personality and personality-related information. In the theory, personality refers to the organization of a person’s major psychological subsystems—the motives and emotions, cognition, self-control, and social behavior that collectively make up a person’s psyche (DeYoung, 2015; Larsen & Buss, 2014). People’s personalities vary dramatically: Some individuals feel overwhelmed by life events; others exhibit marvelous intellects, and some excel at motivating others. Individuals high in personal
intelligence can recognize “who is who” around them and tell apart, for example, those people who are calculating from those who are altruistic. As a result, people with high personal intelligence may thrive in social and organizational settings relative to others.
Over the 20th century, psychologists characterized people’s understanding of personality variously as psychological mindedness (Appelbaum, 1973), as intra- and interpersonal intelligences (Gardner, 1983), as characteristics of a good judge (Funder, 2001), and as dispositional intelligence (Christiansen, Wolcott-Burnam, Janovics, Burns, & Quirk, 2005). More recently, evolutionary psychologists argued that our distant ancestors evolved the capacity to understand personality on the savannahs of Africa as a fundamental human skill for living in groups (Buss, 2008; Dunbar, 2009).
The theory of personal intelligence synthesizes the above viewpoints in pointing out their common focus on an understanding of personality (Mayer, 2008). The use of the term personal in personal intelligence is meant to parallel the use of social and emotional in the social and emotional intelligences. The theory also describes a new research program for ability-based measurement: (a) a rationale for developing a measure of personal intelligence, (b) a clear specification of content domains pertinent to the construct (Mayer, 2008), (c) examples of relevant ability-based tasks (Mayer, 2009), (d) an explanation of why ability-based measurement ought to work, and (e) an empirical proof-of-concept (Mayer, Panter, & Caruso, 2012). The Tests of Personal Intelligence (TOPI) that developed from the theory all ask participants questions about personality and then assess respondents’ answers by comparing them to well-established findings from the personality literature. For example:
01.A person is straightforward and modest. Most likely, she also could be described as: A. Valuing ideas and beliefs
B. Active and full of energy
C. Sympathetic to others and “tender minded” D. Self-conscious and more anxious than average
The correct answer is C, based on research that people who are straightforward and modest also exhibit tender-mindedness and sympathy toward others (e.g., Ashton & Lee, 2010). People exhibit reliable individual differences on the TOPI measures (Mayer et al., 2017a).
Personal Intelligence at Work
Personality persists over time, and although it can be modified, its effects on people’s life activities tend to accumulate (Abelson, 1985). Personality qualities such as the intelligences,
Machiavellianism, guilt-proneness, conscientiousness and other mental traits predict job performance, and in particular, indices of supervisor satisfaction, organizational commitment, job knowledge and objective accomplishments, with typical effect sizes from r = .10 to r = .24 in a variety of occupations (Bosco, Aguinis, Singh, Field, & Pierce, 2015; Ones, Viswesvaran, & Dilchert, 2005a; Ones,
Viswesvaran, & Dilchert, 2005b). Human resource professionals who take employees’ personalities into account are better able to hire, train and promote members of their organizations (Ones et al., 2005b). Perhaps employees who are attuned to personalities also fare better in organizations.
are often more liked and respected than others, and successfully avoid unnecessary conflictual encounters with other people (Mayer, Roberts, & Barsade, 2008; Mayer & Skimmyhorn, 2017). The present research examines three ways that employees with high personal intelligence might differ from their colleagues: That people with high personal intelligence exhibit (a) increased organizational citizenship relative to others, (b) higher levels of experienced social support, and (c) fewer counterproductive work behaviors.
Organizational citizenship. Organ (1997, p. 86) defines organizational citizenship as “individual behavior that is discretionary, not directly or explicitly recognized by the formal reward system, and that…promotes the effective functioning of the organization”. Employees with good organizational citizenship act beyond their specified job roles to broadly contribute to the well-being and goals of their coworkers and the organization. We believe that people with high personal
intelligence are likely to be better organizational citizens than others because they better recognize others’ needs and are themselves happier in their careers.
Counterproductive work behavior. Counterproductive work behavior (CWB) is described as purposeful, harmful action taken against the organization or its members. CWB is not simply poor performance, but rather a “voluntary behavior that violates significant organizational norms,
and…threatens the well-being of the organization or its members, or both” (Sackett, Berry, Wiemann, & Laczo, 2006, p. 442). We believe it is especially likely that people low in personal intelligence will more often engage in counterproductive behavior at work because their incapacity to understand themselves and others is likely to increase their sense of frustration, to impair their self-guidance, and to limit their foresight concerning the costs of acting out against others. Current research indicates that organizational citizenship and counterproductive work behavior are sufficiently distinct, with
correlations near r = -.39, as to be best considered separately (Sackett et al., 2006).
Social support at work. Employees often evaluate their workplace characteristics along a number of key dimensions, including workplace support (Morgeson & Humphrey, 2006). We believe that people higher in personal intelligence, because they interact better with others, will experience a greater sense of mutual support at work than those lower in personal intelligence.
Personal Intelligence, Related Constructs, and Measurement
Too many intelligences? Although Austin and Saklofske (2005) have asked “Are there far too many intelligences?”, we believe that multiple constructs are useful—if they are clearly defined and are empirically independent constructs.
Present-day theories of intelligence describe general intelligence (g) as a capacity to reason abstractly across a wide range of mental problems. Those same present-day theories also demarcate a group of broad intelligences—abilities at reasoning in extensive (but less general) areas, and place this group in a hierarchy just below an individual’s general intelligence (Carroll, 1993; Flanagan, Alfonso, Ortiz, & Dynda, 2013; McGrew, 2009). Many broad intelligences involve the capacity to reason across a wide subject area such as verbal, perceptual-organizational, or mathematical areas (although other broad intelligences involve memory capacity and auditory-related skills). Each broad intelligence is, in turn, composed of more specific mental abilities that cohere with one another (in terms of correlating with one another more than with other specific abilities). For example, verbal intelligence is made up of vocabulary knowledge, reading comprehension, and writing skills, all of which correlate more highly with one another than with other specific abilities such as holding information in short term memory (McGrew, 2009).
management at levels of about r = .65, whereas both those people-centered intelligences correlate with thing-centered intelligences closer to r = .20 (Bryan & Mayer, 2017).
Independence of broad intelligences. There are both conceptual and empirical distinctions even among the person-centered intelligences. For example, personal intelligence is conceptually distinct from ability-based emotional intelligence in that personal intelligence requires not only reasoning about emotions (as does emotional intelligence), but also thinking about motives, traits, goals and goal-setting, and about self-control and optimal personal action (Mayer & Salovey, 1997; Mayer, Caruso, & Salovey, 2016).
The nature of the Test of Personal Intelligence and its test scores. Factor analyses of the TOPI Version 1.4-Revised (TOPI 1.4R), a recently-developed 67-item test, indicate that personal intelligence is a global mental ability that also can be separated into two highly-related factors: Consistency-Congruency personal intelligence reflects people’s capacity to identify and understand trait-like consistencies in personality and their connection to expressed behavior. Dynamic-Analytic personal intelligence reflects test-takers’ ability to integrate more complex information about personality, such as conflicting reputations, into reasonable conceptions of a person. The TOPI 1.4R’s two scales correlate roughly between r = .60 and .70 (Mayer et al., 2017a).
Finally worth noting is that the top 50% of scorers on the TOPI exhibit fairly good
comprehension of personality. By comparison, among the lower 50% of test-takers there exists a wide range of performance. Those lower scorers who are near the 50th percentile probably understand personality well enough to get by, but those at the 30th percentile and below—especially toward the lower 20%—appear perplexed by the differences among the people around them and by their own mental processes. It could be, therefore, that the predictions of the TOPI 1.4R will be stronger in the lower 50% of the sample for a variety of outcomes.
Relation to socio-affective variables and variables of self-control. Personal intelligence is relatively distinct also from the Big Five personality traits, correlating just r = .20 with agreeableness, openness, and conscientiousness, for example. Whereas the Big Five describe an individual’s self-described styles of socio-affective responding and self-control, personal intelligence concerns an individual’s capacity to reason about these characteristics. Personal intelligence also is distinct from mixed-model or “trait” EI which shares 65% or more of its variance with the Big Five (Joseph, Jin, Newman, & O’Boyle, 2015; Petrides, Pita, & Kokkinaki, 2007).
A note on self-reported personal intelligence. People’s self-estimates of their personal
intelligence can be assessed with a brief self-report scale, the scale of Self-Estimated Personal
Intelligence or SEPI. People’s SEPI scores are related to their TOPI scores at the fairly low level (for a test-to-test correlation) of r = .26 (Mayer et al., 2017a); the SEPI appears more likely to overlap with the Big Five.
The Current Studies
In two studies, we administered measures of personal intelligence to samples of individuals who were employed 35 hours or more per week, to test hypotheses concerning the relationship of personal intelligence to workplace perceptions and behavior.
Study 1: Initial Investigation
In Study 1, we tested two sets of hypotheses: The first were intended to assess the overall integrity of our research procedures, and concerned, first, the comparability of our results to earlier findings related to personal intelligence. The second group of hypotheses involved exploration of employees’ personal intelligence as it pertained to the workplace.
intelligence, at about r = .26 as found in the past (Mayer & Skimmyhorn, 2017; cf., Mayer et al., 2017a).
Hypotheses that tested new ideas about work. The newly-tested hypotheses were that ability-based personal intelligence would predict (a) higher levels of organizational citizenship, (b) lower levels of counterproductive work behavior; and (c) greater levels of subjective social support. We also tested whether (d) predictions of personal intelligence held when another broad intelligence (verbal intelligence, as measured by a vocabulary scale) was controlled for. Finally, we examined whether people below the 50th percentile in PI, who exhibit a particularly broad range in their levels of understanding personality (Mayer et al., 2017a), were especially likely to exhibit differences in their criterion experiences and behaviors.
Study1 Methods
Participants. Participants for Study 1 were recruited from Amazon Mechanical Turk (mTurk). Mechanical Turk is an online service that compensates participants for performing various tasks such as psychological surveys, data-entry, and translation tasks. Participation in our study was limited to workers who were US citizens, above the age of 18, who worked at least 35 hours per week, and who had an approval rating greater than 95% (the approval rating is also known in mTurk parlance as the Human Intelligence Task, or HIT, percentage). The rating ensured that only participants whose work usually had been approved by other researchers could participate.
Screening of the sample. There were 591 logons to the survey. We first screened out 130 non-responders, defined as those who completed less than 5% of the items, and 52 partial non-responders, defined as those who completed fewer than half the items of one of the three key measures of personal intelligence or organizational behavior (the Test of Personal Intelligence-MINI-12, Organizational Citizenship, or Counterproductive Workplace Behavior scales), because estimating test scores from a less-than-half-completed scale is a generally unreliable procedure (Fairclough & Cella, 1996; Graham, 2009). We further removed 15 participants who exhibited one or more signs of extreme inattention, including (a) average response times of less than 2s per item (Curran, 2016), (b) missing more than 50% of a set of 10 attention check items (Meade & Craig, 2012), or (c) responding invariantly and implausibly to scales (Johnson, 2005), e.g., endorsing “strongly agree” throughout the SEPI-16, which contains reversed-scored items. The Study 1 analyses are reported for the final, screened sample of N = 394 individuals.
The final N = 394 included 217 women and 176 men (1 unspecified); 185 were between 18 and 30-years- old, 166 between 31 and 50, and 43 were 51-years-old or above. Twenty-three of these had completed their education during or at the end of high school, 304 had some college or a bachelor’s degree, and 66 earned advanced degrees. Of their salaries, 26 earned less than $25,000 per year, 337 between $25,000 and $99,999, and 25 more than that (6 unspecified). The sample was 84%
White/Caucasian, with the remainder split among Asian, Black/African American, Middle Eastern, and Other. Within the sample, 84% had just one job. They worked an average of 42.0 hours per week in a wide range of employment settings, with the largest numbers in private, for-profit companies in fields related to sales, with others in education, libraries, and research.
Measures. We divided our central measures into three categories: (a) intelligence, (b)
workplace status, perceptions, and behaviors, and (c) ancillary measures included to assess additional constructs.
Digit Span, a measure of working memory that has been adapted for online administration (Ostrosky-Solís & Lozano, 2006).
2. Measures of workplace status, perception and behavior
Measures of workplace status. We asked participants their salary, number of people supervised, and to fill out the Job Satisfaction Scale (Bowling & Hammond, 2008), a three-item index measuring job satisfaction, including any plan to find a new job, that used a seven-point scale ranging from strongly disagree (1) to strongly agree (7). These measures were included to ensure that no workplace effects were confounded with employment status.
The Organizational Citizenship Behavior Checklist (OCB-C, Fox, Spector, Goh, Bruursema, & Kessler, 2012)is a20-item checklist that assesses the frequency of organizational citizenship behaviors performed by employees at work. Participants read a list of possible acts that benefit their coworkers and organization (e.g., finishing work for a co-worker, or volunteering to do a difficult task), and indicate whether they perform each act: never, once or twice, once or twice per month, once or twice per week, or every day (coded 1 to 5). The total score is a sum of the responses to the items.
The Counterproductive Work Behavior Checklist (CWB, Spector et al., 2006) is a 32-item measure that assesses the frequency of counterproductive work behavior engaged in by employees and contains five subscales: Abuse (harmful or aggressive behaviors towards coworkers; 17 items),
Production Deviance (assessing intentional failure to perform one’s job effectively; 3 items), Sabotage (intentional destruction of employer’s supplies; 3 items), Theft (the prevalence of stealing; 5 items), and Withdrawal (absences from work; 4 items). The response scale and scoring are the same as for the OCB-C.
The complete Work Design Questionnaire (Bowling & Hammond, 2008) consists of 21 factor-based scales grouped into five broad areas (Bowling & Hammond, 2008, see Table 3). We selected eight of the individual scales: Four from the Social Characteristics area that address the experience of support in the workplace and four comparison scales from the Knowledge and Task Characteristic domains that we regarded as unrelated to support. The four social scales included Social Support (friendliness and kindness at work; 6 items), Initiated Interdependence (helping others to complete their work; 3 items); Received Interdependence (reliance on others to complete one’s work; 3 items), and Interaction outside Organization (work-related relationships with people outside the organization; 4 items). The remaining four job characteristic scales were more cognitive and included Decision-Making Autonomy (allowance for personal judgment at work; 3 items), Task Significance (meaningful impact of work; 3 items), Job Complexity (cognitive demands of work tasks; 4 items) and Problem Solving (need for creativity and unique solutions on the job; 4 items). Respondents answered each question on a five-point scale ranging from strongly disagree (1) to strongly agree (5).
3. Ancillary measures. Two ancillary measures also were employed. Participants completed the Self-Estimated Personal Intelligence-16 (SEPI-16, Mayer et al., 2017a), a 16-item scale that includes statements such as, “I read people’s intentions well” and “I understand who I am.” (The 16-item version was embedded in a longer 70-item SEPI version that our laboratory had since abandoned, and the remaining 54 items were left unscored). Participants also completed the Multidimensional Scale of Perceived Social Support (Zimet, Dahlem, Zimet, & Farley, 1988): Its items measure perceived social support from friends, family, and a significant other, defined as any particularly special person. The three scales were included to test whether perceptions of social support at work also generalized to perceptions of social support in other areas of life. Respondents answered each of the 12 items about support on a seven-point scale from strongly disagree (1) to strongly agree (7).
Participants who completed the full survey received a seven-digit random number on the final screen that they entered into their mTurk page to validate their completion of the survey. The
participant’s responses were then reviewed for acceptable completion (e.g., most items answered), and if so, they were compensated.
Study 1 Results
Descriptive Statistics and Comparability to Prior Research.
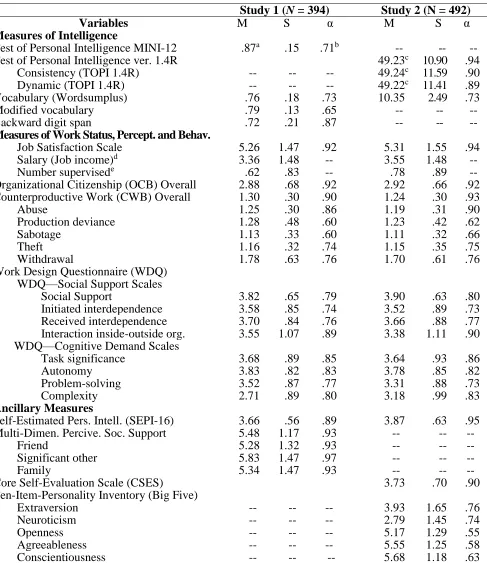
Descriptive statistics. Table 1 presents the study measures’ means, standard deviations, and reliabilities. The reliabilities ranged from α = .60 for two subscales of Counterproductive Behavior to .92 for Organizational Citizenship Behavior, with most αs between .70 and .90.
Comparability to Prior Research. Earlier, we had hypothesized several relationships between the TOPI and other scales, based on earlier findings with similar measures. As predicted, the TOPI correlated with other intelligences such as vocabulary and backward digit span r = .18 to .46, close to our estimate of r = .20 to .40 (see Table 2). We did note, however, that Backwards Digit Span
correlated with other mental ability scales between r = .11 (with Vocab-29) to .18, a bit below the r = .30 to .35 typically reported (e.g., Chabris, 2007; Ganzach, 2016) perhaps because of the participants’ fatigue once they reached the last scale in the survey. The ability-based TOPI scores correlated r = .11, p < .05 with the SEPI-16, a bit below our prediction of r = .26. Backward Digit Span aside, the
preponderance of findings indicated the general integrity of both the present and earlier results.
PI and workplace status, perception and behavior.
Personal intelligence and work demographics. We correlated personal intelligence and work status variables to ensure there were no strong confounds among those variables and none of much note arose. The TOPI did correlate r = -.15, p < .01 with number of people supervised; a linear contrast suggested that people who supervised increasingly more people (i.e., especially more than ten) were lower in personal intelligence than those who supervised 5 or fewer tcontrast = -2.194, p < .05.
Personal intelligence, organizational citizenship and counterproductive work behavior.
The TOPI MINI-12 did not exhibit any significant relationships with Organizational Citizenship, r = .03, n.s.. The MINI did, however, exhibit significant correlations with overall
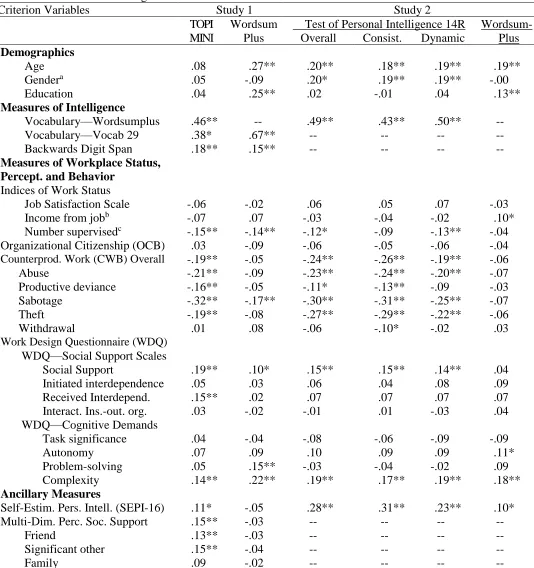
counterproductive work behavior, r = -.19, with social support at work r = .19, and with social support more generally on the Multidimensional Perceived Social Support scale, r = .15, all ps < .01, as indicated in Table 2. Collectively, these findings supported two of the three predicted relationships. For comparison purposes, correlations with Wordsumplus, an index of verbal intelligence, are presented in Table 2 as well.
The Counterproductive Work Behavior scale also has five content-based subscales, and higher scores on the TOPI were associated with lower Sabotage, Interpersonal Abuse, and Theft scores, at r = -.32, -.21 and -.19, all ps < .01. The TOPI correlated at lower levels with the Production Deviance and Withdrawal subscales (r = -.16 p < .01 and r = .01, n.s.).
Table 1
Means, Standard Deviations, and Reliabilities of Primary Measures
Study 1 (N = 394) Study 2 (N = 492)
Variables M S α M S α
Measures of Intelligence
Test of Personal Intelligence MINI-12 .87a .15 .71b -- -- -- Test of Personal Intelligence ver. 1.4R 49.23c 10.90 .94 Consistency (TOPI 1.4R) -- -- -- 49.24c 11.59 .90
Dynamic (TOPI 1.4R) -- -- -- 49.22c 11.41 .89 Vocabulary (Wordsumplus) .76 .18 .73 10.35 2.49 .73 Modified vocabulary .79 .13 .65 -- -- -- Backward digit span .72 .21 .87 -- -- --
Measures of Work Status, Percept. and Behav.
Job Satisfaction Scale 5.26 1.47 .92 5.31 1.55 .94 Salary (Job income)d 3.36 1.48 -- 3.55 1.48 -- Number supervisede .62 .83 -- .78 .89 -- Organizational Citizenship (OCB) Overall 2.88 .68 .92 2.92 .66 .92 Counterproductive Work (CWB) Overall 1.30 .30 .90 1.24 .30 .93 Abuse 1.25 .30 .86 1.19 .31 .90 Production deviance 1.28 .48 .60 1.23 .42 .62 Sabotage 1.13 .33 .60 1.11 .32 .66 Theft 1.16 .32 .74 1.15 .35 .75 Withdrawal 1.78 .63 .76 1.70 .61 .76 Work Design Questionnaire (WDQ)
WDQ—Social Support Scales
Social Support 3.82 .65 .79 3.90 .63 .80 Initiated interdependence 3.58 .85 .74 3.52 .89 .73 Received interdependence 3.70 .84 .76 3.66 .88 .77 Interaction inside-outside org. 3.55 1.07 .89 3.38 1.11 .90 WDQ—Cognitive Demand Scales
Task significance 3.68 .89 .85 3.64 .93 .86 Autonomy 3.83 .82 .83 3.78 .85 .82 Problem-solving 3.52 .87 .77 3.31 .88 .73 Complexity 2.71 .89 .80 3.18 .99 .83
Ancillary Measures
Self-Estimated Pers. Intell. (SEPI-16) 3.66 .56 .89 3.87 .63 .95 Multi-Dimen. Percive. Soc. Support 5.48 1.17 .93 -- -- -- Friend 5.28 1.32 .93 -- -- -- Significant other 5.83 1.47 .97 -- -- -- Family 5.34 1.47 .93 -- -- -- Core Self-Evaluation Scale (CSES) 3.73 .70 .90 Ten-Item-Personality Inventory (Big Five)
Extraversion -- -- -- 3.93 1.65 .76 Neuroticism -- -- -- 2.79 1.45 .74 Openness -- -- -- 5.17 1.29 .55 Agreeableness -- -- -- 5.55 1.25 .58 Conscientiousness -- -- -- 5.68 1.18 .63
a.Proportion correct. b.The TOPI-MINI-12 consists of two sets of 6 items and for that reason a split half reliability is
reported. Coefficient alpha was r = .65 (.67 for standardized items), corrected owing to a coding error discovered in an earlier report (Moore, 2014). The mean proportion correct (from 0 to 1.00) is reported. c.TOPI 1.4R scores are reported on
T-scales using IRT methods, with a possible range for the overall score of approximately 5.2 to 66, and similar ranges for the two subscales. dJob salary was coded into eight categories from less than $15,000 to greater than $100,000; eThe
Table 2
Correlation of Personal Intelligence with Central Measures
Criterion Variables Study 1 Study 2 TOPI
MINI
Wordsum Plus
Test of Personal Intelligence 14R Wordsum- Plus Overall Consist. Dynamic
Demographics
Age .08 .27** .20** .18** .19** .19**
Gendera .05 -.09 .20* .19** .19** -.00
Education .04 .25** .02 -.01 .04 .13**
Measures of Intelligence
Vocabulary—Wordsumplus .46** -- .49** .43** .50** -- Vocabulary—Vocab 29 .38* .67** -- -- -- -- Backwards Digit Span .18** .15** -- -- -- --
Measures of Workplace Status, Percept. and Behavior
Indices of Work Status
Job Satisfaction Scale -.06 -.02 .06 .05 .07 -.03
Income from jobb -.07 .07 -.03 -.04 -.02 .10*
Number supervisedc -.15** -.14** -.12* -.09 -.13** -.04
Organizational Citizenship (OCB) .03 -.09 -.06 -.05 -.06 -.04
Counterprod. Work (CWB) Overall -.19** -.05 -.24** -.26** -.19** -.06
Abuse -.21** -.09 -.23** -.24** -.20** -.07 Productive deviance -.16** -.05 -.11* -.13** -.09 -.03 Sabotage -.32** -.17** -.30** -.31** -.25** -.07 Theft -.19** -.08 -.27** -.29** -.22** -.06 Withdrawal .01 .08 -.06 -.10* -.02 .03
Work Design Questionnaire (WDQ)
WDQ—Social Support Scales
Social Support .19** .10* .15** .15** .14** .04 Initiated interdependence .05 .03 .06 .04 .08 .09 Received Interdepend. .15** .02 .07 .07 .07 .07 Interact. Ins.-out. org. .03 -.02 -.01 .01 -.03 .04 WDQ—Cognitive Demands
Task significance .04 -.04 -.08 -.06 -.09 -.09 Autonomy .07 .09 .10 .09 .09 .11* Problem-solving .05 .15** -.03 -.04 -.02 .09 Complexity .14** .22** .19** .17** .19** .18**
Ancillary Measures
Self-Estim. Pers. Intell. (SEPI-16) .11* -.05 .28** .31** .23** .10* Multi-Dim. Perc. Soc. Support .15** -.03 -- -- -- -- Friend .13** -.03 -- -- -- -- Significant other .15** -.04 -- -- -- -- Family .09 -.02 -- -- -- --
*p < .05; **p < .01; aCoding for gender was 1 for male; 2 for female; 3 (excluded from most analyses) for other. bJob
salary was coded into eight categories, from less than $15,000 to greater than $100,000; cThe supervision variable
Incremental validity. The TOPI also exhibited incremental validity relative to the
Wordsumplus. (We focused on Wordsumplus because it was both brief and reliable compared with the other intelligence measures; for the same reasons, we carried that scale forward to Study 2). In an ordinary least-squares regression to predict CWB, Wordsumplus was entered in the first step where it predicted R2 = .003, F(1, 390) = 1.15, n.s., whereas personal intelligence entered on the second step incrementally predicted the criterion with an R2
change = .037, F(1, 389) = 14.86, p < .001, and respective
standardized beta coefficients for vocabulary and personal intelligences in the second step of βs = .04 and -.22, ts(389) = -1.07, n.s., and -3.86, p < .001).
In a parallel ordinary least squares regression predicting the WDQ Social Support scale, Wordsumplus entered in the first step predicted Support at R2 = .011, F(1, 388) = 4.21, p < .05, but when personal intelligence was entered in the second step, the prediction of Wordsumplus dropped out and only personal intelligence was predictive, R2change = .025, with an F(1, 387) = 9.93, p < .001, and
standardized beta coefficients for verbal and personal intelligences of β = .02 and .18, ts(389) = .41, n.s. and 3.15, p < .01, respectively).
Effects at the upper and lower ranges of personal intelligence. Mayer and colleagues depicted TOPI test takers who score below the test’s median (50th percentile) as exhibiting a far greater range of
functionality in understanding personality relative to those who score above it (Mayer et al., 2017a). To examine whether correlations were stronger for the lower-scoring group, we divided the sample into high- and low-scoring groups as evenly possible. Because the TOPI MINI has only 12 items, the closest-to-even split was N = 149 versus 245 (37.8% v. 62.2%). Correlations between the TOPI-MINI and Counterproductive Work Behavior and Work Social Support were negligible at the higher range of PI at r = .01 and .09, n.s.. By comparison the relationships for the low-scoring groups were far stronger at r = -.29 with CWB and .24 for Support, ps < .01.
Study 1 Summary of Findings and Discussion (Deferred)
Study 1examined the relationship of personal intelligence to a group of work-related variables including workplace citizenship, counterproductive work behavior and work-support and related measures. Personal intelligence exhibited positive correlations with other measured mental abilities including, in a new finding tested here, with working memory capacity. It also correlated with
workplace support and (negatively) with counterproductive workplace behavior. By comparison, it did not exhibit relationships with organizational citizenship behaviors. We further consider the results in the General Discussion following Study 2.
Study 2: Replication and Extension
In Study 2, we replicated and extended some of the findings from Study 1 so as to assess how much confidence we could place in them. We also slightly refined our measures: We substituted the newly developed TOPI 1.4R for the TOPI-MINI because the 1.4R yields a more reliable overall score of PI, as well as two factor-based scales of Consistency-Congruence and Dynamic-Analytic personal intelligence. We also added the Ten-Item-Personality Inventory (Gosling, Rentfrow, & Swann, 2003), a very brief measure of the Big Five, and the Core Self-Esteem Scale, a measure of work self-esteem (Judge, Erez, Bono, & Thoresen, 2003). In order to make time for them in our survey, we reduced the number of intelligence measures we used and dropped the Multidimensional Scale of Perceived Social Support (because the latter measured general rather than work-related perceptions of support).
Hypotheses
Study 2 hypotheses that tested prior findings. To monitor the validity of our online research procedures, we again tested the reliable-seeming earlier findings that ability-based personal
intelligence correlated positively with: (a) the openness, agreeableness, and conscientiousness scales of the Big Five near r = .20; and with (b) people’s self-estimated personal intelligence, at or below r = .25 (Mayer & Skimmyhorn, 2017; Mayer et al., 2017a).
for by scales of the Big Five as we had supposed. To replicate findings from Study 1, we tested whether TOPI scores would again predict (a) no difference in levels of organizational citizenship, (b) lower levels of counterproductive work behavior; and (c) greater levels of subjective social support. We also tested whether the TOPI would exhibit incremental validity relative to our index of verbal intelligence, in the form of a brief vocabulary test (Haynes & Lench, 2003; Hunsley & Meyer, 2003), and in a new test, whether the TOPI would exhibit incremental validity above the Big Five. Also as before, we split the samples into high versus low PI groups to investigate whether obtained
relationships were stronger for test-takers who scored below the 50th percentile on PI than for those who scored above it (Mayer et al., 2017a).
Study 2 Methods
Participants. Participants again were recruited from mTurk using the same Study 1 criteria in the prior year. The 623 new log-ons to Study 2 were screened using the same Study 1 criteria. One hundred and thirty of these logins were removed due to non- or partial-responding, as well as 11 people who exhibited extreme signs of inattention, leaving a final N = 482.
The final N = 482 included 250 women and 230 men (and 2 gender unspecified), with 203 between 18 and 30-years- old, 236 between 31 and 50, and 43 51-years-old or above. Fifty-one respondents had completed their education by the end of high school, 368 had some college or a bachelor’s degree, and 63 earned advanced degrees. Of their salaries, 27 earned less than $25,000 per year, 404 earned between $25,000 and $99,999, and 47 more than that (4 unspecified). The sample was 74.3% White/Caucasian, with the remainder split among Asian, Black/African American, Middle Eastern and Other. Within the sample, 83.8% had just one job.
Measures. The central measures were divided into three areas as before: (a) intelligence, (b) job status and workplace perception and behavior, and (c) ancillary measures.
1. Measures of intelligence
The Test of Personal Intelligence 1.4 Revised (TOPI-1.4R, Mayer et al., 2017a) consisted of the 93 multiple-choice items of the TOPI 1.4, of which we scored the 67 items that formed the revised TOPI 1.4R. Each item consisted of a stem that posed a question about personality, followed by four alternatives, one of which is scored correct (“1”); the remainder, incorrect (“0”). The TOPI 1.4R yields an overall scale and two factor-based subscales of Consistency-Congruency and Dynamic-Analytic reasoning (see Introduction and Mayer et al., 2017a).
The Wordsumplus vocabulary measure was re-administered.
2. Measures of workplace status, perception and behavior. The indices of job status (including job satisfaction), and the Organizational Citizenship Behavior Checklist, Counterproductive Work Behavior Checklist, and Work Design Questionnaire all were carried forward from Study 1 without change.
3. Ancillary measures. The SEPI-16 was included again, to explore its relation with the Big Five personality traits. The Ten-Item Personality Inventory (Gosling et al., 2003) measured the Big Five personality traits using five two-item scales; the scale exhibits reasonable overall validity given its brief length (Ehrhart et al., 2009). Also included was the Core Self-Evaluations Scale (CSES; Judge,
Erez, Bono, & Thoresen, 2003), a 12-item measure that is used regularly in organizational research and assesses, “a basic, fundamental appraisal of one's worthiness, effectiveness, and capability as a person” (Judge et al., 2003, p. 304).
Procedure. We administered the Study 2 survey during the 2015-2016 academic year,
approximately one year after Study 1; participants again were recruited via Amazon Mechanical Turk (mTurk). They completed the scales in the same fashion as in Study 1 except that in Study 2 the test presentation and items within tests were fixed so as to more closely approximate the standard administration of the central instruments. Participants also were required to respond to all of the test items throughout the survey (not including certain demographic items).
Descriptive Statistics and Comparability to Prior Research.
Descriptive statistics. Table 1 presents the means, standard deviations, and reliabilities for the study measures in Study 2 (right hand columns). For tests that were the same across studies—the indices of job status, Organizational Citizenship, Counterproductive Work Behavior scales, the Work Design Questionnaire, and Wordsumplus, the means, standard deviations and reliabilities were quite similar to those in Study 1. The reliabilities of the new scales were good with the exception of three scales of the Ten-Item Personality Inventory that ranged between r = .55 and .66. According to classical psychometrics, an α of = .55 places an upper bound on a possible validity coefficient for the scale of r = .74, versus, for a comparison test with an α = .90, of r = .95 (Ghiselli, E. E., Campbell, J. P., Zedeck, S., 1981, p. 289, where r = 1.0 between true measures)—which although not ideal was sufficient for detecting effects in these studies.
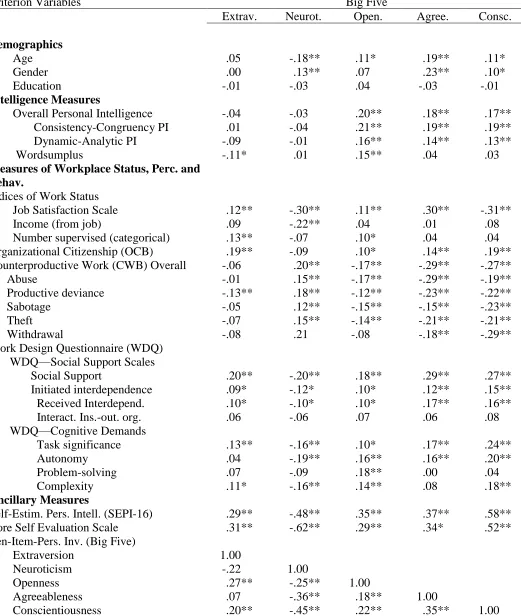
General comparability between findings here and earlier research. In Study 2, we had hypothesized a number of relationships between the TOPI, the Big Five and SEPI based on earlier findings. These were again upheld and included that the TOPI scores correlated with Openness, Agreeableness, and Conscientiousness of the Big Five between r = .17 and .20, near our prediction of around r = .20 (Table 3), and with the SEPI-16 r = .28, relative to our prediction of about r = .26.
SEPI-16 variance due to the Big Five. Among our new hypotheses was that people’s self-estimated personal intelligence on the SEPI-16 would correlate with Big Five scales about r = .50, which they did, from r = -.48 to r = .58 (see Table 3). Worth noting is that the Big Five collectively predicted the SEPI-16 at R2 = .46, F(5, 475) = 80.67, p < .001, accounting for 46% of the variance of self-estimates in an ordinary least-squares regression. In a parallel regression that included both the Big Five and the Core Self-Evaluation Scale, the overall prediction was R2 = .53, F(6, 474) = 89.95, p < .001. By comparison, the Big Five accounted for just R2 = .09, or 9% of the variance of the TOPI,
F(5, 475) = 9.37, p < .001; the parallel analysis including both the Big Five and CSES explained nothing further, with the prediction again R2 = .09, F(6,474) = 7.79. The TOPI 1.4R is the relatively novel measure here.
Personal intelligence, workplace status, perception, and behavior.
Personal intelligence and work status. As in Study 1, there were few relationships between TOPI scores and demographics or job status and those present were small. As in Study 1, employees with more supervisees scored slightly lower on the TOPI. A post-hoc one-way ANOVA again indicated that people who supervised more than about 10 people might be slightly lower in personal intelligence than those who supervised fewer than 6, with the linear contrast tcontrast= -11.60, p < .01. In
Study 2 (but not Study 1), both age and gender correlated with TOPI 1.4R scores, rs = .20 for age and for gender, ps < .05. (Gender was coded 1 for male and 2 for female, consequently, the r = .20
reflected women’s somewhat better performance). Wordsumplus showed effects for age and education of r = .19 and .13, ps = .01 for age (Table 2).
Personal intelligence, organizational citizenship, counterproductive workplace behavior, and support. As in Study 1, the TOPI 1.4R exhibited no relationship with organizational citizenship r = -.06, n.s., but did exhibit significant correlations, r = -.24, with counterproductive work behavior, and r = .15, ps < .01 with social support at work. Also repeating the Study 1 pattern, higher scores on the TOPI were associated with lower Sabotage, Interpersonal Abuse, and Theft scores, at r = -.30, -.24 and -.27, all ps < .01, but at lower absolute levels with Production Deviance, and were not significantly related to Withdrawal from the workplace. Examining the TOPI factor-based scales, these negative correlations appeared stronger for the Consistency-Congruency relative to Dynamic-Analytic
Table 3
Correlation of the Big Five and Self-Estimated Personal Intelligence with Central Measures of Study 2
Criterion Variables Big Five
Extrav. Neurot. Open. Agree. Consc.
Demographics
Age .05 -.18** .11* .19** .11*
Gender .00 .13** .07 .23** .10*
Education -.01 -.03 .04 -.03 -.01
Intelligence Measures
Overall Personal Intelligence -.04 -.03 .20** .18** .17** Consistency-Congruency PI .01 -.04 .21** .19** .19** Dynamic-Analytic PI -.09 -.01 .16** .14** .13** Wordsumplus -.11* .01 .15** .04 .03
Measures of Workplace Status, Perc. and Behav.
Indices of Work Status
Job Satisfaction Scale .12** -.30** .11** .30** -.31**
Income (from job) .09 -.22** .04 .01 .08
Number supervised (categorical) .13** -.07 .10* .04 .04 Organizational Citizenship (OCB) .19** -.09 .10* .14** .19** Counterproductive Work (CWB) Overall -.06 .20** -.17** -.29** -.27** Abuse -.01 .15** -.17** -.29** -.19** Productive deviance -.13** .18** -.12** -.23** -.22** Sabotage -.05 .12** -.15** -.15** -.23** Theft -.07 .15** -.14** -.21** -.21** Withdrawal -.08 .21 -.08 -.18** -.29** Work Design Questionnaire (WDQ)
WDQ—Social Support Scales
Social Support .20** -.20** .18** .29** .27** Initiated interdependence .09* -.12* .10* .12** .15** Received Interdepend. .10* -.10* .10* .17** .16** Interact. Ins.-out. org. .06 -.06 .07 .06 .08 WDQ—Cognitive Demands
Task significance .13** -.16** .10* .17** .24** Autonomy .04 -.19** .16** .16** .20** Problem-solving .07 -.09 .18** .00 .04 Complexity .11* -.16** .14** .08 .18**
Ancillary Measures
Self-Estim. Pers. Intell. (SEPI-16) .29** -.48** .35** .37** .58** Core Self Evaluation Scale .31** -.62** .29** .34* .52** Ten-Item-Pers. Inv. (Big Five)
Extraversion 1.00
Neuroticism -.22 1.00
Openness .27** -.25** 1.00
Agreeableness .07 -.36** .18** 1.00
Check for non-normality in the Counterproductive Work Behavior scale. Because many participants again characterized their counterproductive behavior by clicking the “Never” alternative on the CWB when describing their destructive workplace acts, we repeated the negative binomial regression as in Study 1, and again found the result remained significant with the negative binomial coefficient, B = -.005, Wald χ2= 54.18, p < .001. (The relatively small B in the model relative to Study
1 reflects the numerous, small intervals in the TOPI 1.4R score range, compared to that of the TOPI MINI used in Study 1. (The negative binomial coefficient is interpreted similarly to the unstandardized beta in ordinary least squares regression and is affected by units of measurement like the more familiar beta).
Incremental validity. The TOPI also exhibited incremental validity relative both to the Big Five and to the index of verbal intelligence (Wordsumplus). We performed an ordinary least squares regression again predicting Counterproductive Work Behavior. In the first step, we entered the Big Five scales and Core Self-Evaluation, yielding an R = .39, p < .001 for CWB. In the second step, we added the TOPI 14R (overall) and Wordsumplus scores. The second model yielded an R2change = .03; F
(2, 472) = 8.543, p < .001. The significant predictors in the second step were only three: Agreeableness (from the Big Five), Core SelfEvaluation, and the TOPI 1.4R; standardized betas, β = .17, .21, and -.20, respectively (ts(478) = -3.53, -3.65, and -4.03, ps < .001).
A parallel regression to predict work support indicated that the Big Five and CSES variables predicted support in the first step, R2 = .22, p. < .001; in the second step, the overall R2 = .22, was nearly the same (it was .013 higher carried to the thousandths place). In that second step, R2change = .01;
F(2, 472) = 2.12, n.s.. The individual variables with significant predictions in the second step were Extraversion, Neuroticism, Agreeableness and Core Self-Evaluation, with standardized betas, β = .09, .15, .17, and .38 respectively, ts(478) = 2.10, 2.69, 3.76, and 6.74, ps from < .05 to .001. Neither the TOPI 1.4R nor Wordsumplus Vocabulary added significantly to the prediction in the second step although the TOPI exhibited a trend in that direction with a β = .08, t(478) = 1.72, p < .10.
Effects at the upper and lower ranges of personal intelligence. We again tested whether the effects of personal intelligence were stronger for those scoring on the TOPI in the lower half of the sample. We divided the Study 2 sample at the TOPI median score, yielding subsamples of Ns = 244 and 238. Similar to Study 1, the TOPI correlations were weaker in the higher-scoring portion of the sample, with rs = .06 and .04, n.s., for the CWB and workplace support, and stronger in the lower-scoring group, at r = -.31, p < .01 and r = .10, n.s..
Relationships with the Big Five. Finally,Table 3 depicts the correlations between the scales of the Big Five with the criterion measures. We had not specifically hypothesized what the relationships would be because they were not our focus. That said, a number of positive relationships arose in the r = .20 range between positive socioaffective traits, lower counterproductive work behavior, and higher social support.
General Discussion
Summary of findings
Among our key findings were that, as in earlier studies, personal intelligence correlated
the personal intelligence-to-behavior connection far stronger in the lower-scoring half of the sample (where the functional range of good to poor understanding appears more meaningful).
We believe that people low in personal intelligence struggle to make sense of their coworkers; they are uncertain of whose advice to take or whose suggestions to follow. These individuals
ultimately may abandon their attempts to understand others and instead default to somewhat
indiscriminate or habitual interpersonal styles. As is true of people generally, some of our sample with low personal intelligence likely internalized their frustrations in form of experienced anxiety and depression; a higher-than-average number among them, however, exhibit disagreeable behavior (given the roughly r = .20 correlation between personal intelligence and agreeableness), and report that they act out at higher-than-usual levels against their coworkers and the organizations at which they work. Assessments of personal intelligence may aid these employees to understand one source of their frustrations and, ultimately, to get along better in the workplace.
Personal intelligence and Human Resource Development
Enlarged understandings. Further replications of the effects found here are certainly
warranted. That said, from an organizational perspective, being aware of the contribution of personal intelligence potentially allows for an enlarged understanding of one’s workforce. Employees who are high in PI may provide one another with workplace social support that is advantageous to the
organization and the people in it over the long term. There may, in addition, be further advantages of higher personal intelligence, as-of-yet unknown.
Surely, being aware of employees with lower personal intelligence may also be helpful in preventing counterproductive workplace activities. Human resource professionals can help employees understand and cope with their challenges in understanding their coworkers by accepting that some people do experience such frustrations despite doing the best they can, by providing “translation” services of why others behave as they do, and by providing training in what personality is and how it operates. Training relevant to personality understanding appears to have positive effects (Durlak, Weissberg, Dymnicki, Taylor, & Schellinger, 2011).
Is the job of assessment ever done? Human resource professionals may be forgiven for wondering how many personality attributes they need to assess: The number of recently-proposed broad intelligences has been growing. As we noted earlier, some psychologists have asked “are there too many intelligences?” (Austin & Saklofske, 2005). There are two rather different answers to that question. Schneider and Newman (2015) have answered that even if HR professionals are interested chiefly in general intelligence, they must still measure broad intelligences as a means to calculate g, and, having done so, might as well exploit the incremental validity afforded by carefully choosing the broad intelligences they measured and examining individual scores on them.
The second answer is to think of certain broad intelligences as falling along a continuum from thing- to people-centered (Bryan & Mayer, 2017). It may make sense to regularly sample from the people-centered (and thing-centered) ends of this continuum rather than to worry about measuring them all.
Strengths and limitations
How Ready are Tests of Personal Intelligence?
To promote work with personal intelligence, we have made the TOPI MINI-12 available to all interested, qualified, researchers, beginning with the 5th edition of the test manual (Mayer et al., 2017b). The TOPI 1.4R also is available to interested researchers, including to researchers with activities planned in organizational settings, who might wish to partner with us.
A Few Closing Thoughts
What is the purpose of the human resource management if not to better understand members of an organization, their needs, how they work together, and their overall well-being? We believe
personal intelligence is a very powerful component of personality—in some sense, it serves as
personality’s guidance system, including the world of work, especially as it pertains to the individual’s capacity to set personal goals, and to navigate their social worlds. The theory of personal intelligence suggests that people’s variation in skill can help explain some of the differences among employees and their functioning, and we hope that others may find it a useful variable to explore in the future.
References
Abelson, R. P. (1985). A variance explanation paradox: When a little is a lot. Psychological Bulletin, 97(1), 129-133. doi:10.1037/0033-2909.97.1.129
Appelbaum, S. A. (1973). Psychological-mindedness: Word, concept and essence. The International Journal of Psychoanalysis, 54(1), 35-46.
Ashton, M. C., & Lee, K. (2010). Trait and source factors in HEXACO-PI-R self- and observer reports. European Journal of Personality, 24(3), 278-289. doi:10.1002/per.759
Austin, E. J., & Saklofske, D. H. (2005). Far too many intelligences? on the communalities and differences between social, practical, and emotional intelligences. In R. D. Roberts (Ed.),
Emotional intelligence: An international handbook. (pp. 107-128). Ashland, OH US: Hogrefe & Huber Publishers.
Bosco, F. A., Aguinis, H., Singh, K., Field, J. G., & Pierce, C. A. (2015). Correlational effect size benchmarks. Journal of Applied Psychology, 100(2), 431-449. doi:10.1037/a0038047
Bowling, N. A., & Hammond, G. D. (2008). A meta-analytic examination of the construct validity of the michigan organizational assessment questionnaire job satisfaction subscale. Journal of Vocational Behavior, 73(1), 63-77.
Bryan, V. M., & Mayer, J. D. (2017). People versus thing intelligences?. Sacramento, CA: Poster presented at the 14th Meeting of the Association for Research in Personality.
Buss, D. M. (2008). Human nature and individual differences: Evolution of human personality. In L. A. Pervin (Ed.), Handbook of personality psychology: Theory and research (3rd ed.). (pp. 29-60). New York, NY US: Guilford Press.
Carroll, J. B. (1993). Human cognitive abilities: A survey of factor-analytic studies. New York, NY US: Cambridge University Press.
Chabris, C. F. (2007). Cognitive and neurobiological mechanisms of the law of general intelligence. In M. J. Roberts, & M. J. Roberts (Ed) (Eds.), (pp. 449-491). New York, NY, US: Psychology Press. Christiansen, N. D., Wolcott-Burnam, S., Janovics, J. E., Burns, G. N., & Quirk, S. W. (2005). The
good judge revisited: Individual differences in the accuracy of personality judgments. Human Performance, 18(2), 123-149. doi:10.1207/s15327043hup1802_2
Cor, M. K., Haertel, E., Krosnick, J. A., & Malhotra, N. (2012). Improving ability measurement in surveys by following the principles of IRT: The wordsum vocabulary test in the general social survey. Social Science Research, 41(5), 1003-1016. doi:10.1016/j.ssresearch.2012.05.007
DeYoung, C. G. (2015). Cybernetic big five theory. Journal of Research in Personality, 56, 33-58. doi:10.1016/j.jrp.2014.07.004
Dunbar, R. I. M. (2009). The social brain hypothesis and its implications for social evolution. Annals of Human Biology, 36(5), 562-572. doi:10.1080/03014460902960289
Durlak, J. A., Weissberg, R. P., Dymnicki, A. B., Taylor, R. D., & Schellinger, K. B. (2011). The impact of enhancing students’ social and emotional learning: A meta-analysis of school-based universal interventions. Child Development, 82(1), 405-432.
doi:10.1111/j.1467-8624.2010.01564.x
Ehrhart, M. G., Ehrhart, K. H., Roesch, S. C., Chung-Herrera, B., Nadler, K., & Bradshaw, K. (2009). Testing the latent factor structure and construct validity of the ten-item personality inventory. Personality and Individual Differences, 47(8), 900-905. doi:10.1016/j.paid.2009.07.012 Fairclough, D. L., & Cella, D. F. (1996). Functional assessment of cancer therapy (FACT-G):
Non-response to individual questions. Quality of Life Research: An International Journal of Quality of Life Aspects of Treatment, Care & Rehabilitation, 5(3), 321-329. doi:10.1007/BF00433916 Flanagan, D. P., Alfonso, V. C., Ortiz, S. O., & Dynda, A. M. (2013). Cognitive assessment: Progress
in psychometric theories of intelligence, the structure of cognitive ability tests, and interpretive approaches to cognitive test performance. In D. H. Saklofske, C. R. Reynolds, V. L. Schwean, D. H. Saklofske, C. R. Reynolds & V. L. Schwean (Eds.), (pp. 239-285). New York, NY, US: Oxford University Press.
Fox, S., Spector, P. E., Goh, A., Bruursema, K., & Kessler, S. R. (2012). The deviant citizen: Measuring potential positive relations between counterproductive work behaviour and
organizational citizenship behaviour. Journal of Occupational and Organizational Psychology, 85(1), 199-220. doi:10.1111/j.2044-8325.2011.02032.x
Funder, D. C. (2001). Accuracy in personality judgment: Research and theory concerning an obvious question. In R. Hogan (Ed.), Personality psychology in the workplace. (pp. 121-140). Washington, DC US: American Psychological Association. doi:10.1037/10434-005
Ganzach, Y. (2016). Another look at the spearman's hypothesis and relationship between digit span and general mental ability. Learning and Individual Differences, 45, 128-132.
doi:10.1016/j.lindif.2015.12.026
Gardner, H. (1983). Frames of mind: The theory of multiple intelligences. New York, NY US: Basic Books.
Ghiselli, E. E., Campbell, J. P., Zedeck, S. (1981). Measurement theory for the behavioral sciences. San Francisco, CA USA: Freeman & Company.
Gosling, S. D., Rentfrow, P. J., & Swann, W. B. J. (2003). A very brief measure of the big-five personality domains. Journal of Research in Personality, 37(6), 504-528. doi:10.1016/S0092-6566(03)00046-1
Graham, J. W. (2009). Missing data analysis: Making it work in the real world. Annual Review of Psychology, 60, 549-576. doi:10.1146/annurev.psych.58.110405.085530
Haynes, S. N., & Lench, H. C. (2003). Incremental validity of new clinical assessment measures. Psychological Assessment, 15(4), 456-466. doi:10.1037/1040-3590.15.4.456
Hunsley, J., & Meyer, G. J. (2003). The incremental validity of psychological testing and assessment: Conceptual, methodological, and statistical issues. Psychological Assessment, 15(4), 446-455. doi:10.1037/1040-3590.15.4.446
Johnson, J. A. (2005). Ascertaining the validity of individual protocols from web-based personality inventories. Journal of Research in Personality, 39(1), 103-129. doi:10.1016/j.jrp.2004.09.009 Joseph, D. L., Jin, J., Newman, D. A., & O’Boyle, E. H. (2015). Why does self-reported emotional
Judge, T. A., Erez, A., Bono, J. E., & Thoresen, C. J. (2003). The core self-evaluations scale: Development of a measure. Personnel Psychology, 56(2), 303-331. doi:10.1111/j.1744-6570.2003.tb00152.x
Larsen, R. J., & Buss, D. M. (2014). Personality psychology: Domains of knowledge about human nature. Boston, MA: McGraw Hill.
Mayer, J. D. (2008). Personal intelligence. Imagination, Cognition and Personality, 27(3), 209-232. doi:10.2190/IC.27.3.b
Mayer, J. D. (2009). Personal intelligence expressed: A theoretical analysis. Review of General Psychology, 13(1), 46-58. doi:10.1037/a0014229
Mayer, J. D. (2018). Intelligences about things and intelligences about people. In R. J. Sternberg (Ed.), The nature of human intelligence (pp. 270-286). New York: Cambridge University Press.
Mayer, J. D., Caruso, D. R., & Salovey, P. (2016). The ability model of emotional intelligence: Principles and updates. Emotion Review, 8, 1-11.
Mayer, J. D., Panter, A. T., & Caruso, D. R. (2012). Does personal intelligence exist? evidence from a new ability-based measure. Journal of Personality Assessment, 94, 124-140.
doi:10.1080/00223891.2011.646108
Mayer, J. D., Panter, A. T., & Caruso, D. R. (2017a). A closer look at the test of personal intelligence (TOPI). Personality and Individual Differences, 111, XXX.
Mayer, J. D., Panter, A. T., & Caruso, D. R. (2017b). Test of personal intelligence MINI MARKER-12 (TOPI MINI-12) (5th ed): Brief manual. Unpublished manuscript.
Mayer, J. D., Roberts, R. D., & Barsade, S. G. (2008). Human abilities: Emotional intelligence. Annual Review of Psychology, 59, 507-536. doi:10.1146/annurev.psych.59.103006.093646
Mayer, J. D., & Salovey, P. (1997). What is emotional intelligence? In D. J. Sluyter (Ed.), Emotional development and emotional intelligence: Educational implications. (pp. 3-34). New York, NY US: Basic Books.
Mayer, J. D., & Skimmyhorn, W. (2017). Personality attributes that predict performance of cadets at west point. Journal of Research in Personality, 66, 14-16.
McGrew, K. S. (2009). CHC theory and the human cognitive abilities project: Standing on the shoulders of the giants of psychometric intelligence research. Intelligence, 37(1), 1-10. doi:10.1016/j.intell.2008.08.004
Meade, A. W., & Craig, S. B. (2012). Identifying careless responses in survey data. Psychological Methods, 17(3), 437-455. doi:10.1037/a0028085
Ones, D. S., Viswesvaran, C., & Dilchert, S. (2005a). Cognitive ability in selection decisions. In O. Wilhelm, R. W. Engle, O. Wilhelm (Ed) & R. W. Engle (Ed) (Eds.), (pp. 431-468). Thousand Oaks, CA, US: Sage Publications, Inc. doi:10.4135/9781452233529.n24
Ones, D. S., Viswesvaran, C., & Dilchert, S. (2005b). Personality at work: Raising awareness and correcting misconceptions. Human Performance, 18(4), 389-404.
doi:10.1207/s15327043hup1804_5
Organ, D. W. (1997). Organizational citizenship behavior: It's construct clean-up time. Human Performance, 10(2), 85-97. doi:10.1207/s15327043hup1002_2
Ostrosky-Solís, F., & Lozano, A. (2006). Digit span: Effect of education and culture. International Journal of Psychology, 41(5), 333-341. doi:10.1080/00207590500345724
Petrides, K. V., Pita, R., & Kokkinaki, F. (2007). The location of trait emotional intelligence in personality factor space. British Journal of Psychology, 98(2), 273-289.
doi:10.1348/000712606X120618
Spector, P. E., Fox, S., Penney, L. M., Bruursema, K., Goh, A., & Kessler, S. (2006). The
dimensionality of counterproductivity: Are all counterproductive behaviors created equal? Journal of Vocational Behavior, 68(3), 446-460. doi:10.1016/j.jvb.2005.10.005
Zimet, G. D., Dahlem, N. W., Zimet, S. G., & Farley, G. K. (1988). The multidimensional scale of perceived social support. Journal of Personality Assessment, 52(1), 30-41.