Parents’ Perceptions of Primary Care: Measuring Parents’ Experiences of
Pediatric Primary Care Quality
Michael Seid, PhD*; James W. Varni, PhD*‡; Laura Olson Bermudez, PhD*; Mirjana Zivkovic, MD, PhD*; Maryam Davodi Far, PhD*; Melissa Nelson, MPH*; and Paul S. Kurtin, MD*
ABSTRACT. Objective. A measure of pediatric pri-mary care quality that is brief, practical, reliable, and valid would be useful to patients and pediatricians, policymak-ers, and health system leaders. Parents have a unique per-spective from which to report their experiences with their child’s primary care, and these reports may be valid indi-cators of pediatric primary care quality. The research objec-tive was to develop a brief parent report of their children’s primary care, the Parent’s Perceptions of Primary Care sure (P3C), and to test its reliability and validity as a mea-sure of pediatric primary care quality.
Study Design. The P3C was based on the elements of primary care as defined by the Institute of Medicine. Pretesting of domain content and item clarity was accom-plished via focus interviews. The P3C was developed in English and translated to Spanish, Vietnamese, and Ta-galog. The 23-item P3C yields a total score, as well as subscale scores for continuity, access, contextual knowl-edge, communication, comprehensiveness, and coordina-tion. The P3C was administered to 3371 parents of chil-dren in kindergarten through sixth grades in a large, urban school district.
Principal Findings. The percentage of missing values for the overall sample was 1.88%, indicating acceptable feasibility. Range of measurement, assessed via floor and ceiling effects, was moderate to good. Cronbach’s coeffi-cient␣, an indicator of scale internal consistency reliabil-ity, was 0.95 for the P3C total scale. Factor analysis sup-ported the subscale structure, and P3C scores were higher for children with health insurance, whose parents com-pleted the survey in English, and who had a regular physician. P3C scores were positively related to parent reports of the child’s health-related quality of life.
Conclusions. The P3C is a practical, reliable, and valid measure of parents’ reports of pediatric primary care quality. This brief measure could be used alone, or in conjunction with other measures, to enhance outcomes and evaluate the impact of systems changes on the deliv-ery of the main elements of primary care. Pediatrics
2001;108:264 –270;quality of healthcare, outcome and pro-cess assessment (healthcare), primary healthcare, mea-surement, questionnaires.
ABBREVIATIONS. IOM, Institute of Medicine; PEDsQL, Pediatric Quality of Life Inventory; SD, standard deviation.
H
igh quality pediatric primary care is a cor-nerstone of efforts to improve health out-comes, control health care spending, and im-prove access to care.1–3 To improve the quality ofpediatric primary care, a reliable and valid measure must exist. The ideal instrument is one that is brief, practical, reliable, and valid.4,5 Given the current
high rate of uninsured children6and children
with-out a regular source of care,7,8 such an instrument
must also be applicable regardless of insurance sta-tus and health plan membership or the presence of a regular provider of care.
Primary care, according to the Institute of Medi-cine (IOM), is “the provision of integrated, accessible health care services by clinicians who are account-able for addressing a large majority of personal health care needs, developing a sustained partner-ship with patients, and practicing in the context of family and community.”9Operational definitions of
these concepts vary across researchers. Nevertheless, there is general agreement that primary care is ac-cessible, longitudinally continuous, adequately com-municated, contextual (based on a provider’s accu-mulated knowledge of the patient and family), comprehensive, and coordinated.
Parents are in a unique position to report on the care their children receive.10 –13Indeed, some aspects
of primary care (for example, accessibility, adequate communication, and contextual care) describe the parent’s/patient’s experience of care, rather than a specific provider behavior. Other aspects of care can be reliably reported by parents (for example longitu-dinal continuity, comprehensiveness). Although some have argued that patients/parents cannot re-port on the coordination of care,14it could be argued
that the best coordination is apparent to the patient or parent—that part of coordinating care involves communicating the process and outcomes of that coordination to the parent.
A distinction has been made between patient/par-ent reports of experiences with the health care deliv-ery system and ratings of satisfaction with health care delivery.15,16 Although both reports of
experi-ences and ratings of satisfaction require the respon-dent to make evaluative responses, these 2 types of evaluations differ in the criterion against which the evaluation is made. Satisfaction ratings are evaluated against an individual’s expectations and preferences, which vary widely across individuals and ultimately do not suggest ways in which the health system can
From the *Center for Child Health Outcomes, Children’s Hospital and Health Center, San Diego, California; and ‡Department of Psychiatry, Uni-versity of California San Diego School of Medicine, San Diego, California. Received for publication Sep 28, 2000; accepted Dec 15, 2000.
be improved.16 On the other hand, reports of
expe-riences are evaluated against a specific prescriptive criterion (for example, that care be “adequately com-municated”14). As such, deviations from the criterion
represent potential decrements in quality and areas for improvement.
Several measures of primary care currently exist. Starfield and Cassady’s Child Health Systems Pri-mary Care Assessment Survey16 is an
interviewer-administered survey consisting of 2 parallel surveys for consumers and providers of care that assess both structural and process indicators of primary care for children. It focuses on consumers’ experiences with health delivery characteristics rather than satisfac-tion with them, and has been shown to be a reliable and valid measure. A somewhat shorter version, the Primary Care Assessment Tool–Child Edition has been described.17 This version also requires
inter-viewer-administration and takes approximately 25 minutes to complete. This subject burden may have contributed to the 36% response rate (27% response rate for the test-retest portion) reported. Safran’s Pri-mary Care Assessment Survey18 is a 51-item,
self-administered instrument. It measures 7 domains of primary care for adults within the context of a spe-cific clinician-patient primary care relationship. Only those respondents who report an established rela-tionship with a primary clinician can complete the measure. The Primary Care Assessment Survey in-cludes both reports and evaluative ratings. It has been subjected to rigorous psychometric testing and has been linked to outcomes of care.19Flocke’s
Com-ponents of Primary Care Index15is a brief (20-item),
self-administered measure of adults’ reports of their experiences with 4 aspects of primary care. It re-quires patients to report, rather than rate, their inter-action with a specific physician in the context of a particular office visit. All these instruments are based on the IOM’s definition of primary care and are designed as multidimensional instruments, although each measures a slightly different overlapping set of constructs. Each has been subjected to various de-grees of psychometric testing, and all seem to have at least some degree of reliability and validity.
However, a need exists for an instrument that is at once a brief, practical, reliable, and valid measure of pediatric primary care that can be used irrespective of insurance status or the presence of an established clinician-patient relationship. Although others have posited that an established clinician-patient relation-ship is necessary for the existence of primary care, and have therefore restricted measurement of pri-mary care to those patients with such a relationship, the fact remains that many children, both insured and uninsured, lack a regular site of care or a regular provider of care. It behooves researchers, clinicians, and policy makers to develop and use measures that encompass the experiences of these children as well. The present study describes such an instrument, the Parent’s Perceptions of Primary Care measure (P3C). Using a large, diverse, community sample, we assessed the feasibility, reliability, and validity of the P3C. Feasibility is measured in terms of missing data and the percentage of respondents with the lowest
possible (floor effect) and the highest possible (ceil-ing effect) score. Low rates of miss(ceil-ing data indicate that parents are willing and able to complete the survey items. Small floor and ceiling effects indicate that the instrument allows parents to respond to an adequate range of experiences. Reliability is mea-sured in terms of internal consistency. High internal consistency indicates that items grouped into a scale are measuring a similar construct.
Validity is demonstrated by an instrument’s ability to respond as expected, given specific research-based hypotheses. First, we examined the validity of the P3C subscales via factor analysis. It is hypothesized that P3C items should be associated with the a priori subscales. Second, we examined the P3C’s ability to distinguish between groups thought to differ in the quality of primary care received. In this case, it is hypothesized that higher quality primary care will be reported for parents whose children have health insurance,20,21who complete the form in English,22,23
and whose children have a regular health care pro-vider.24 –26Finally, we examined the relationship
be-tween the P3C and a measure of health-related qual-ity of life, the Pediatric Qualqual-ity of Life Inventory (PedsQL).27 It is hypothesized that higher scores on
the P3C will be related to higher PedsQL scores.
METHODS Instrument Development
The P3C is based on the IOM definition of primary care. Using this definition as a criterion, the P3C was designed to measure 6 components of care which, when present, constitute high quality primary care. High scores reflect care conforming to this a priori definition. Thus, the P3C measures quality based on parent re-ports of their experiences, rather than ratings of satisfaction with those experiences. The P3C was designed to measure the quality of primary care received, rather than the quality of a particular provider of primary care. This was done so that the care received by children without a regular provider could also be described in relation to the IOM definition of quality primary care.
The components of primary care included in the P3C are those on which parents are thought able to report. The 6 components of primary care are defined as follows. Longitudinal continuity is defined as the parent’s report of the length of time they have been bringing their children to a regular place or physician.2,14Access is
defined as the parent’s report of timely and convenient access to care for their children.14Communication is defined as the parent’s
report of how well the physician listens and explains during their interactions.15 Contextual knowledge is defined as the parent’s
report that the physician knows his or her values and preferences about medical care issues, clearly understands his or her child’s health needs, and knows the child’s medical history.2
Comprehen-siveness is defined as the parent’s report of the extent to which a regular place and/or doctor provides care for acute and chronic problems and preventive services.14,15 Coordination of care is
defined as the parent’s report of their physician’s knowledge of other visits and visits to specialists, as well as the follow-up of problems through subsequent visits or phone calls.2
Item Development and Pilot Testing
Items were developed from the existing literature,14 –19from
goal was to create parsimonious scales consisting of items that would be understood by the majority of parents in a diverse community population. This instrument was specifically devel-oped to be appropriate for self-administration in a culturally di-verse community population. All items are at or below an eighth-grade reading level.
To ensure content validity and that the measure encompasses all appropriate domains of interest, 12 groups of 3 parents each were interviewed in small-group settings at an elementary school. Parents completed pilot versions of the measure and were asked whether the measure allowed them to adequately characterize their experiences of their child’s health care. Parents were asked to nominate additional domains or items and to indicate items thought to be irrelevant or redundant. Minor changes were made to the measure based on parent feedback at this stage.
To ensure item clarity and to identify and modify unclear items, the modified instrument was then piloted with 15 additional parents at an elementary school and a preschool using cognitive interviewing methodology.28,29 Parents completed the
question-naire and then, for each item, were asked to describe in their own words what the item was asking. Discrepancies between item intent and parents’ understanding were noted, and the parent was asked for suggestions as to how to reword the item. The pilot subjects easily understood the majority of the items. Several items were modified or deleted based on this feedback.
The resulting measure included 23 items measuring 6 aspects of primary care. The items, grouped by aspect of primary care, are shown in the “Appendix.”
The instructions were designed to be applicable for parents of children regardless of the presence of a regular site or source of care or the type of health care provider. They read as follows:
“The person your child sees for health care might be a general doctor, a specialist doctor, a nurse practitioner, a physician assis-tant, or a nurse. Although these questions ask about ”the doctor,“ please think about the person (or people) your child sees for health care.”
Except for the 2 longitudinal continuity items, the response scale for the instrument was a 5-point Likert-type scale, with the options 0⫽never, 1⫽sometimes, 2⫽often, 3⫽almost always, and 4⫽always. For the coordination scale, an additional response choice of NA (not applicable) was included, and scored as a user-missing value. For ease of interpretability, these items are transformed to a 0 to 100 scale, with 100 being best, as follows: 0⫽
0, 1⫽25, 2⫽50, 3⫽75, and 4⫽100. The response scale for the longitudinal continuity items was; 0⫽no particular place (per-son), 1⫽ ⬍6 months, 2⫽6 months to 1 year, 3⫽1 to 2 years, 4⫽ 3 to 5 years, and 5⫽ ⬎5 years. These responses were rescored to be compatible with the 0 to 100 scale as follows: 0⫽0, 1⫽20, 2⫽ 40, 3 ⫽60, 4 ⫽ 80, and 5 ⫽100. Computing the mean of the nonmissing values on each scale formed the total scale score, as well as the scores for each subscale.
The P3C was developed in English, and then translated into Spanish, Vietnamese, and Tagalog. Translation was accomplished using forward-backward translation striving for conceptual, as opposed to syntactical equivalence and consistent language lev-el.30 –34
Other Measures
Respondents also completed the PedsQL, a reliable and valid measure of children’s health-related quality of life.27In this study,
the parent proxy-report version is used. Additionally, respondents were asked whether there was someone they would consider their child’s personal doctor, and whether their child currently had health insurance.
Procedures
As part of a larger study to validate a measure of quality of care for vulnerable children, the P3C was administered to parents of children in 228 classes, from kindergarten through the sixth grade, at 18 elementary schools within a large, urban school district. Schools were selected for inclusion in the study based on the presence of the 3 target languages (Spanish, Vietnamese, and Tagalog) and heterogeneity of socioeconomic status, as measured by the percentage of the student body eligible for federal free or reduced-priced lunch. Classes at schools were randomly selected within grade. Classes in which the consent rate was below 50%
were dropped from the sample and resampled if additional classes at that school were available.
Project staff visited each classroom and distributed the ques-tionnaires for students to take home to their parents. Parents signed the informed consent and completed the surveys at home, and returned them to school via the students. At several schools, sessions were held for parents with limited literacy. In these cases, bilingual staff was available to administer the survey to the par-ents. Phone calls were made to those parents who had missing data on any part of the larger survey.
This protocol was reviewed and approved by the institutional review board at Children’s Hospital and Health Center, San Di-ego, California.
RESULTS
The overall response rate for the survey was 66%. A total of 3371 parents (77.1% mothers, 16.9% fathers, 6% percent other) completed the P3C. The sample was 50.8% girls, and diverse with respect to race/ ethnicity (14.0% white, 37.6% Latino, 13.3% black, 5.9% Vietnamese, 21.3% Filipino, 6.8% Other Asian-Pacific Islander, 0.4% Native American, 0.8% other). 64.4% of respondents completed the P3C in English (27.7% Spanish, 4.2% Vietnamese, 3.6% Tagalog). Re-garding educational attainment, 33.6% of mothers and 30.7% of fathers had not completed high school, while 22.2% of mothers and 19.5% of fathers had graduated from college or beyond. Parents reported that 20.2% of the children had no health insurance, 38.9% had no regular physician, and 10.8% had a chronic health condition.
Feasibility
Missing data were 1.88% for the sample overall (1.21% for respondents completing the survey in En-glish and 3.06% for respondents completing the sur-vey in another language, 1.22% in cases where the mother had completed high school and 2.55% if she had not).
The P3C Total scale shows minimal floor and ceil-ing effects overall, by insurance status, and by lan-guage of form. Regarding subscales, notable floor effects exist for the continuity subscale, especially for uninsured (45.1%) and for non-English speakers (36.6%). Notable ceiling effects exist for the commu-nication subscale, especially for the insured (35.5%) and for those who completed the questionnaire in English (37.1%).
Internal Consistency Reliability
The internal consistency reliability (␣) coefficients, as well as scale descriptives, of the P3C Total scale and subscales are displayed in Table 1. An␣ coeffi-cient of 0.70 is recommended for group comparison, whereas the more stringent 0.90 level is recom-mended for individual level comparison.35As can be
seen, the internal consistency for the Total scale and for the subscales of the P3C are acceptable, for the whole sample and for the subgroup having a per-sonal doctor. These results hold, as well, for groups with and without insurance, and for those complet-ing the survey in English and in another language.
Validity
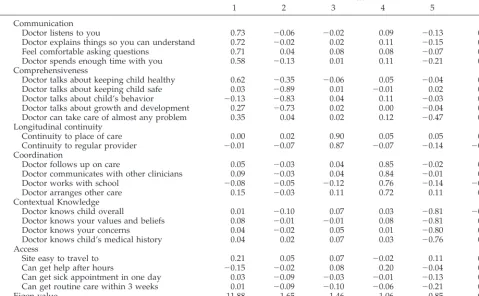
principal components factor analysis, using oblique rotation and forcing 6 factors (the same number as the number of subscales). Factor rotation converged in 19 iterations and the solution explained a total of 77.0% of the variance. With few exceptions, the items of the 6 factors are consistent with the a priori hy-pothesized P3C subscales.
Table 3 displays the comparisons on mean P3C Total scale scores between groups thought to differ in the quality of primary care received. Independent samplet tests compared children with and without health insurance; children whose parents completed the survey in English or another language; and chil-dren with and without a regular physician. All com-parisons were statistically significant. Multivariate analyses of variance comparing the P3C subscale means between the above factors confirmed that the subscale means also were significantly different in every comparison.
We examined the relationship between P3C and PedsQL scores. We split the sample into 3 tertiles according to P3C score and compared these 3 groups on their PedsQL scores. A 1-way analysis of variance indicated that the differences among these means were statistically significant (F(2, 3260)⫽40.94,P⬍
.001), and posthoc tests showed that the highest ter-tile P3C group (mean: 80.24, standard deviation [SD]: 16.29) had significantly higher PedsQL scores than did the lowest (mean: 74.29, SD: 16.91) and middle (mean: 75.07, SD: 16.78) tertiles, which were not sig-nificantly different from one another (Fig 1).
DISCUSSION
This study presents the feasibility, reliability, and validity of the P3C. Based on the IOM definition of primary care, the P3C elicits a parent’s reports of certain characteristics of their child’s primary care which, when present, constitute high quality care. In this diverse community sample, where a third of the mothers and 30% of the fathers had not completed high school, the low rates of missing data overall and by language indicate that English-speakers, as well as Spanish-, Vietnamese-, and Tagalog-speakers were able to respond to the P3C items. For the sam-ple overall and for groups defined by insurance sta-tus and language spoken, the internal consistency reliability of the P3C total scale exceeded the strin-gent 0.90 standard required for comparisons
be-tween individuals. The internal consistency reliabil-ity of the subscales was also strong, exceeding the 0.70 standard required for group comparisons and, in some cases, approaching or exceeding 0.90. The results of the factor analysis supported the a priori conceptually derived subscales, lending validity to the subscale scores. The total scale and all subscale scores distinguished between children with and without health insurance, between those whose par-ents completed the P3C in English or another lan-guage, and between those with and without a regu-lar physician. Furthermore, the P3C was related to health-related quality of life, as measured by the PedsQL. The 5- to 6-point difference in PedsQL scores between children in the group with the high-est P3C scores and those in the middle and lowhigh-est groups was similar to the difference in PedsQL scores found between healthy and chronically ill chil-dren in the original validation of the PedsQL.27These
data imply that the P3C is a feasible, reliable, and valid measure of primary care characteristics, suit-able for use in large, diverse community samples.
Several shortcomings exist. Test-retest reliability was not assessed for the P3C. Additional field-testing is planned to address test-retest reliability. The P3C was not compared with an extant measure of pri-mary care. Additional research comparing the P3C to an existing measure would strengthen evidence for its validity. The P3C measures only parents’ reports of their child’s primary care. It does not include a provider-report form, as other measures have.16
Re-garding translation, although the measure was trans-lated using state-of-the-art methods, it was not si-multaneously developed in these other languages, as has been sometimes recommended. However, the measure seems to be feasible, reliable, and valid in other languages and the present method has the advantage of creating a set of items that are parallel across language. The P3C does not specify a partic-ular provider, and thus might not accurately repre-sent a particular source of primary care. This was intentional, as the goal was to develop a measure that could be used irrespective of the presence of a regular provider of care. The P3C is intended to measure the quality of primary care received, rather than the quality of a specific provider of primary care. It stands to reason that at least those parents reporting a regular provider were thinking of a par-ticular person as they completed the form, and the internal consistency for this subgroup was very sim-ilar to the overall sample. Nevertheless, additional research is still needed to determine whether the measurement properties of the P3C hold when re-spondents report explicitly on a specific health care provider. Finally, the relationship between P3C scores and PedsQL scores, although supportive of the construct validity of the P3C, is subject to con-founding. Specifically, third variables such as socio-economic status, race/ethnicity, language, and edu-cation, may affect both P3C and PedsQL scores. Additional research incorporating these variables is necessary to further clarify this relationship.
These results have several implications for pedia-tricians, patients, purchasers, and policy makers.
TABLE 1. Scale Descriptives and Internal Consistency Reli-ability for P3C
N Mean SD ␣
Total Sample
Regular Provider
P3C Scale
Total 3371 62.07 24.73 0.95 0.95
Continuity 3346 53.34 35.87 0.77 0.75
Access 3364 65.76 28.43 0.80 0.79
Contextual Knowledge 3365 62.17 30.72 0.92 0.92
Communication 3378 73.77 29.11 0.92 0.92
Comprehensiveness 3360 55.15 31.53 0.87 0.86
Coordination 2342 55.96 33.66 0.89 0.89
Those pediatricians and medical groups interested in performance improvement now have a measure that can serve as an indicator of the quality of primary care experienced by parents of their patients. The instrument’s brevity minimizes respondent burden, and the results presented here support the idea that it is sufficiently reliable and valid to measure changes in quality of care cross-sectionally, and per-haps even over time. Parents and those purchasing health care have, in the P3C, a common metric for evaluating the experiences of parents of patients in a particular pediatric practice or group. Such informa-tion could be useful for enrollment and purchasing decisions. Policy makers, likewise, have a tool to measure the experiences of populations of interest, such as children covered by Medicaid or the federal State Child Health Insurance Program, or minority
populations who may have limited English ability. Fig 1.fined by P3C scores.Parent report PedsQL scores as a function of groups
de-TABLE 2. P3C Factor Loadings
Factor
1 2 3 4 5 6
Communication
Doctor listens to you 0.73 ⫺0.06 ⫺0.02 0.09 ⫺0.13 0.05
Doctor explains things so you can understand 0.72 ⫺0.02 0.02 0.11 ⫺0.15 0.05
Feel comfortable asking questions 0.71 0.04 0.08 0.08 ⫺0.07 0.12
Doctor spends enough time with you 0.58 ⫺0.13 0.01 0.11 ⫺0.21 0.07
Comprehensiveness
Doctor talks about keeping child healthy 0.62 ⫺0.35 ⫺0.06 0.05 ⫺0.04 0.03
Doctor talks about keeping child safe 0.03 ⫺0.89 0.01 ⫺0.01 0.02 0.04
Doctor talks about child’s behavior ⫺0.13 ⫺0.83 0.04 0.11 ⫺0.03 0.01
Doctor talks about growth and development 0.27 ⫺0.73 0.02 0.00 ⫺0.04 0.00
Doctor can take care of almost any problem 0.35 0.04 0.02 0.12 ⫺0.47 0.09
Longitudinal continuity
Continuity to place of care 0.00 0.02 0.90 0.05 0.05 0.05
Continuity to regular provider ⫺0.01 ⫺0.07 0.87 ⫺0.07 ⫺0.14 ⫺0.07
Coordination
Doctor follows up on care 0.05 ⫺0.03 0.04 0.85 ⫺0.02 0.02
Doctor communicates with other clinicians 0.09 ⫺0.03 0.04 0.84 ⫺0.01 0.00
Doctor works with school ⫺0.08 ⫺0.05 ⫺0.12 0.76 ⫺0.14 ⫺0.05
Doctor arranges other care 0.15 ⫺0.03 0.11 0.72 0.11 0.17
Contextual Knowledge
Doctor knows child overall 0.01 ⫺0.10 0.07 0.03 ⫺0.81 ⫺0.01
Doctor knows your values and beliefs 0.08 ⫺0.01 ⫺0.01 0.08 ⫺0.81 0.00
Doctor knows your concerns 0.04 ⫺0.02 0.05 0.01 ⫺0.80 0.09
Doctor knows child’s medical history 0.04 0.02 0.07 0.03 ⫺0.76 0.11
Access
Site easy to travel to 0.21 0.05 0.07 ⫺0.02 0.11 0.71
Can get help after hours ⫺0.15 ⫺0.02 0.08 0.20 ⫺0.04 0.69
Can get sick appointment in one day 0.03 ⫺0.09 ⫺0.03 ⫺0.01 ⫺0.13 0.73
Can get routine care within 3 weeks 0.01 ⫺0.09 ⫺0.10 ⫺0.06 ⫺0.21 0.72
Eigen value 11.88 1.65 1.46 1.06 0.85 0.80
Percent variance 51.67 7.18 6.36 4.60 3.72 3.50
Total variance explained: 77.0%.
TABLE 3. Results oftTests Comparing Groups Thought to Differ in Quality of Primary Care Received
N Mean SD t df Significance
Health insurance?
Yes 2661 64.84 23.85 13.08 3323 0.001
No 664 51.16 25.20
Language of form
English 2178 66.53 23.43 14.59 3369 0.001
Other 1193 53.93 24.97
Personal doctor?
Yes 2061 68.10 23.10 18.75 3354 0.001
No 1295 52.45 24.22
Additional research on the P3C and its correlates is planned. A follow-up survey of the original sample is being fielded. Changes in health insurance status in the sample are anticipated, with some uninsured children becoming insured. Given extant research linking insurance status with receipt of primary care,36measuring the resulting changes in P3C scores
for this subsample will enable conclusions to be drawn regarding the sensitivity of this measure to change. A separate subsample will be asked to re-spond to a 2-week follow-up to examine the test– retest reliability of this instrument. Field trials in other settings will also allow evaluation of the P3C when respondents are asked to report on a specific provider. Finally, research is needed to more fully explicate the links between insurance status, vulner-ability, use of primary care, quality of primary care, and health-related quality of life.
ACKNOWLEDGMENTS
This research was supported by the Agency for Healthcare Research and Quality (Grant R01 HS10317) and the Substance Abuse and Mental Health Services Administration.
We thank the parents and students at San Diego Unified School District who generously gave their time to complete these surveys, the principals and teachers who graciously allowed us onto their campuses and into their classrooms, and Jack Campana, Rose Marie Lofgren, RN, MA, CNP, and Sandy Wright, RN, BSN, whose experience, cooperation, and sage advice enabled the project team to forge strong working relationships with the schools in this sample.
REFERENCES
1. Starfield B. Public health and primary care: a framework for proposed linkages.Am J Public Health. 1996;86:1365–1369
2. Starfield B.Primary Care: Balancing Health Needs, Services, and Technology. New York, NY: Oxford University Press; 1998
3. Starfield B, Simpson L. Primary care as part of US health services reform.JAMA. 1993;269:3136 –3139
4. McGlynn EA, Halfon N. Overview of issues in improving quality of care for children.Health Serv Res. 1998;33:977–1000
5. Varni JW, Seid M, Kurtin PS. Pediatric health-related quality of life measurement technology: A guide for health care decision makers.
J Clin Outcomes Manage. 1999;6:33– 40
6. US Department of Commerce. Census Brief: Children Without Health Insurance. Washington, DC: US Department of Commerce, Bureau of the Census; 1998
7. Halfon N, Newacheck PW, Wood DL, St Peter RF. Routine emergency department use for sick care by children in the United States.Pediatrics. 1996;98:28 –34
8. Wood DL, Hayward RA, Corey CR, Freeman HE, Shapiro MF. Access to medical care for children and adolescents in the United States. Pediat-rics. 1990;86:666 – 673
9. Donaldson M, Yordy K, Lohr K, Vanselow N, eds.Primary Care: Amer-ica’s Health in a New Era.Washington, DC: National Academy Press; 1996
10. Homer CJ, Marino B, Cleary PD, et al. Quality of care at a children’s hospital: the parent’s perspective.Arch Pediatr Adolesc Med. 1999;153: 1123–1129
11. Dinkevich EI, Cunningham SJ, Crain EF. Parental perceptions of access to care and quality of care for inner-city children with asthma.J Asthma. 1998;35:63–71
12. Garwick AW, Kohrman C, Wolman C, Blum RW. Families’ recommen-dations for improving services for children with chronic conditions.
Arch Pediatr Adolesc Med. 1998;152:440 – 448
13. Crain EF, Kercsmar C, Weiss KB, Mitchell H, Lynn H. Reported diffi-culties in access to quality care for children with asthma in the inner city.Arch Pediatr Adolesc Med. 1998;152:333–339
14. Bindman AB, Grumbach K, Osmond D, Vranizan K, Stewart AL. Pri-mary care and receipt of preventive services.J Gen Intern Med. 1996;11: 269 –276
15. Flocke SA. Measuring attributes of primary care: development of a new instrument.J Fam Pract. 1997;45:64 –74
16. Starfield B, Cassady C, Nanda J, Forrest CB, Berk R. Consumer experi-ences and provider perceptions of the quality of primary care: implica-tions for managed care.J Fam Pract. 1998;46:216 –226
17. Cassady CE, Starfield B, Hurtado MP, Berk RA, Nanda JP, Friedenberg LA. Measuring consumer experiences with primary care. Pediatrics. 2000;105:998 –1003
18. Safran DG, Kosinski M, Tarlov AR, et al. The Primary Care Assessment Survey: tests of data quality and measurement performance.Med Care. 1998;36:728 –739
19. Safran DG, Taira DA, Rogers WH, Kosinski M, Ware JE, Tarlov AR. Linking primary care performance to outcomes of care.J Fam Pract. 1998;47:213–220
20. Stoddard JJ, St Peter RF, Newacheck PW. Health insurance status and ambulatory care for children.N Engl J Med. 1994;330:1421–1425 21. Szilagyi PG, Zwanziger J, Rodewald LE, et al. Evaluation of a state
health insurance program for low-income children: implications for state child health insurance programs.Pediatrics. 2000;105:363–371 22. Halfon N, Inkelas M, Wood D. Nonfinancial barriers to care for children
and youth.Annu Rev Public Health. 1995;16:447– 472
23. Uba L. Cultural barriers to health care for southeast Asian refugees.
Public Health Rep. 1992;107:544 –548
24. Kempe A, Beaty B, Englund BP, Roark RJ, Hester N, Steiner JF. Quality of care and use of the medical home in a state-funded capitated primary care plan for low-income children.Pediatrics. 2000;105:1020 –1028 25. Kasper JD. The importance of type of usual source of care for children’s
physician access and expenditures.Med Care. 1987;25:386 –398 26. Short PF, Lefkowitz DC. Encouraging preventive services for
low-income children. The effect of expanding Medicaid.Med Care. 1992;30: 766 –780
27. Varni JW, Seid M, Rode CA. The PedsQL: measurement model for the Pediatric Quality of Life Inventory.Med Care. 1999;37:126 –139 28. Schwarz N, Sudman N.Answering Questions: Methodology for
Determin-ing Cognitive and Communicative Processes in Survey Research. San Fran-cisco, CA: Jossey-Bass; 1996
29. Schwartz CE, Kozora E, Zeng Q. Towards patient collaboration in cognitive assessment: Specificity, sensitivity, and incremental validity of self-report.Ann Behav Med. 1996;18:177–184
30. Canales S, Ganz PA, Coscarelli CA. Translation and validation of a quality of life instrument for Hispanic American cancer patients: meth-odological considerations.Qual Life Res. 1995;4:3–11
31. Hendricson WD, Russell IJ, Prihoda TJ, Jacobson JM, Rogan A, Bishop GD. An approach to developing a valid Spanish language translation of a health-status questionnaire.Med Care. 1989;27:959 –966
32. Herdman M, Fox-Rushby J, Badia X. Equivalence and the translation and adaptation of health-related quality of life questionnaires.Qual Life Res. 1997;6:237–247
33. Keller SD, Ware JE, Jr, Gandek B, et al. Testing the equivalence of translations of widely used response choice labels: results from the IQOLA Project.J Clin Epidemiol. 1998;51:933–944
34. Ware JE, Keller SD, Grandek B, Brazier JE, Sullivan M. Evaluating translations of health status questionnaires: Methods from the IQOLA Project.Int J Tech Assess Health Care. 1995;11:525–551
35. Nunnally JC, Bernstein IR.Psychometric Theory. 3rd ed. New York, NY: McGraw-Hill; 1994
DOI: 10.1542/peds.108.2.264
2001;108;264
Pediatrics
Davodi Far, Melissa Nelson and Paul S. Kurtin
Michael Seid, James W. Varni, Laura Olson Bermudez, Mirjana Zivkovic, Maryam
Pediatric Primary Care Quality
Parents' Perceptions of Primary Care: Measuring Parents' Experiences of
Services
Updated Information &
http://pediatrics.aappublications.org/content/108/2/264
including high resolution figures, can be found at:
References
http://pediatrics.aappublications.org/content/108/2/264#BIBL
This article cites 31 articles, 4 of which you can access for free at:
Subspecialty Collections
_management_sub
http://www.aappublications.org/cgi/collection/administration:practice
Administration/Practice Management
following collection(s):
This article, along with others on similar topics, appears in the
Permissions & Licensing
http://www.aappublications.org/site/misc/Permissions.xhtml
in its entirety can be found online at:
Information about reproducing this article in parts (figures, tables) or
Reprints
http://www.aappublications.org/site/misc/reprints.xhtml
DOI: 10.1542/peds.108.2.264
2001;108;264
Pediatrics
Davodi Far, Melissa Nelson and Paul S. Kurtin
Michael Seid, James W. Varni, Laura Olson Bermudez, Mirjana Zivkovic, Maryam
Pediatric Primary Care Quality
Parents' Perceptions of Primary Care: Measuring Parents' Experiences of
http://pediatrics.aappublications.org/content/108/2/264
located on the World Wide Web at:
The online version of this article, along with updated information and services, is
by the American Academy of Pediatrics. All rights reserved. Print ISSN: 1073-0397.