Lincoln University Digital Thesis
Copyright
Statement
The
digital
copy
of
this
thesis
is
protected
by
the
Copyright
Act
1994
(New
Zealand).
This
thesis
may
be
consulted
by
you,
provided
you
comply
with
the
provisions
of
the
Act
and
the
following
conditions
of
use:
you
will
use
the
copy
only
for
the
purposes
of
research
or
private
study
you
will
recognise
the
author's
right
to
be
identified
as
the
author
of
the
thesis
and
due
acknowledgement
will
be
made
to
the
author
where
appropriate
you
will
obtain
the
author's
permission
before
publishing
any
material
from
the
thesis.
Water extraction and use of seedling and
established dryland lucerne crops
A thesis
submitted in partial fulfilment
of the requirements for the Degree
of Doctor of Philosophy
at
Lincoln University
New Zealand
by
Richard E. Sim
Lincoln University Canterbury, New Zealand
Parts of this thesis have been accepted for publication in advance of
submission of this thesis
From Chapter 4, 5 and 6
Sim, R.E, Moot, D.J., Brown, H.E., Teixeira, E.I. 2012a. Development, growth and water extraction of seedling lucerne grown on two contrasting soil types. In: I. Yunusa (Ed.). "Capturing Opportunities and Overcoming Obstacles in Australian Agronomy". Proceedings of the 16th Australian Agronomy Conference 2012, University of New England, Armidale, NSW The Regional Institute Ltd.
From Chapter 4 and 6
Abstract of a thesis in partial fulfilment of the requirements for the
Degree of Doctor of Philosophy
Water extraction and use of seedling and established dryland
lucerne crops
By
Richard E. Sim
AbstractThe main aim of this research was to refine best management practices for dryland lucerne (Medicago sativa L.) crops in relation to crop water extraction. To do this, dryland lucerne was established at Lincoln University, New Zealand in two soils which differed in the plant available water content (PAWC). The low PAWC site (Ashely Dene) had a very stony silt loam soil with ~130 mm of water to 2.3 m. The high PAWC site (Iversen 12) is a deep silt loam soil with ~360 mm of water to 2.3 m. The available water for crop extraction in the establishment year was manipulated by imposing the second treatment, sowing date. This resulted in mean annual dry matter (DM) yields which ranged from 0.4 to 21.5 t DM/ha. A detailed examination of lucerne physiology was undertaken to determine how lucerne extracts water from the soil to explain these yield differences. Mean annual DM production was maximised when lucerne was spring sown in October, with yields of 2.8 t DM/ha at Ashley Dene and 12.1 t DM/ha at Iversen 12. Delayed sowing from December to February reduced the annual yield in the establishment season by 16 kg DM/ha/day at Ashley Dene and 114 kg DM/ha/day at Iversen 12.
Accumulated intercepted radiation explained most (R2 = 0.98) of the differences in DM
Crops in the establishment season displayed an extraction front velocity (EFV) of 14 mm/day when crop water demand was greater than supply. The EFV of second year crops at Ashley Dene doubled to 32 mm/day, to compensate for the low water supply from the soil, however water demand exceeded supply and water stress occurred. Water stress was quantified as transpiration (ET) in relation to demand (EPT). Soil evaporation
(ES) was described by the Ritchie model, modified to account for soil drying by crop
roots. It explained 84% of the variation in observed soil water content of bare soil. ET/EPT was compared to yield forming processes to determine the effect of water stress
on crop canopy development, expansion and shoot radiation use efficiency (RUEshoot),
expressed as a fraction of a fully water crop (fobs/pred). The expansion of LAI was the
most sensitive component to water stress which decreased from fobs/pred of 1.0 to near
zero when ET/EPT was 0.30, compared with RUEshoot fobs/pred which decreased to 0.30.
But, because of the exponential relationship between fractional radiation interception and LAI, and also greater below ground partitioning of DM in response to waters stress, differences in RUEshoot had the greatest influence on DM yield. RUEshoot for crops
grown at Iversen 12 displayed a seasonal pattern, 0.68 g DM/MJ in spring and early summer which decreased to 0.45 g DM/MJ in late summer. RUEshoot was consistently
0.27 g DM/MJ at Ashley Dene.
The effect of grazing management was determined on dryland lucerne DM yield and water use. Grazing the crop canopy reduced transpiration which was proportional to the decrease in intercepted radiation. But, total water use was consistent among grazing managements because ET and ES were balanced.
Table of Contents
1 General Introduction ... 1
1.1 Overview of dryland forage production in New Zealand ... 1
1.2 Potential to increase dryland pasture production ... 2
1.3 Research objectives ... 3
2 Review of literature... 6
2.1 Lucerne production in New Zealand... 6
2.1.1 Overview ... 6
2.1.2 DM yield ... 7
2.1.3 Forage quality and animal production... 7
2.1.4 Defoliation management ... 8
2.2 Environmental factors that determine lucerne yield ... 11
2.2.1 Crop growth, development and yield ... 11
2.2.2 Temperature ... 12
2.3 Interception of solar radiation by the canopy ... 16
2.3.1 Leaf area index ... 16
2.4 DM production and radiation use efficiency (RUE) ... 20
2.4.1 Effect of temperature on RUE... 21
2.4.2 DM partitioning ... 22
2.5 Effect of water limitation on yield ... 24
2.5.1 Soil water supply ... 24
2.5.2 Water use ... 25
2.5.3 Crop water stress ... 28
2.6 Establishment ... 31
2.7 Summary ... 33
3 Materials and Methods ... 34
3.1 Experimental sites ... 34
3.1.1 Site history ... 34
3.1.2 Soil characteristics ... 34
3.2 Meteorological conditions ... 37
3.2.1 Measurements ... 37
3.2.2 Long-term meteorological conditions ... 37
3.2.3 Rainfall and evapotranspiration during the experiments ... 38
3.2.4 Temperature and solar radiation... 41
3.2.5 Vapour pressure deficit and wind run ... 42
3.3 Agronomic management ... 44
3.3.1 Experimental design and treatments ... 44
3.3.2 Establishment ... 45
3.3.3 Soil fertility ... 46
3.3.4 Weed control ... 47
3.3.5 Insect control ... 47
3.3.6 Defoliation... 47
3.4 Calculations... 49
3.4.1 Meteorological conditions ... 49
3.4.2 Thermal time calculation... 49
4 Lucerne establishment and DM production ... 51
4.1 Introduction ... 51
4.2 Material and methods ... 52
4.2.1 Emergence ... 52
4.2.2 Time to first trifoliate leaf ... 52
4.2.3 Seedling shoot and root biomass ... 53
4.2.4 Shoot yield ... 53
4.2.5 Seasonal growth rates ... 53
4.2.6 Root biomass ... 53
4.2.7 Validating the base temperature ... 54
4.2.8 Gravimetric soil water content at sowing... 56
4.3 Results ... 57
4.3.1 Lucerne seedling establishment ... 57
4.3.2 Annual and seasonal DM yield ... 63
4.3.3 Root biomass and partitioning ... 72
4.4 Discussion ... 79
4.4.1 Establishment ... 79
4.4.2 DM yield ... 80
4.4.3 DM yield in relation to sowing date ... 81
4.4.4 Root partitioning ... 82
4.5 Conclusions ... 85
5 The effect of canopy development and expansion on radiation interception and growth ... 86
5.1 Introduction ... 86
5.2 Materials and Methods ... 87
5.2.1 Canopy development ... 87
5.2.2 Canopy expansion ... 88
5.2.3 Radiation interception ... 90
5.2.4 Radiation use efficiency ... 92
5.2.5 Canopy nitrogen content ... 93
5.3 Results ... 94
5.3.1 Canopy development ... 94
5.3.2 Canopy expansion ... 103
5.3.3 Canopy architecture ... 107
5.3.4 Towards explaining LAER ... 108
5.3.5 Radiation interception ... 113
5.4 Discussion ... 119
5.4.1 Intercepted radiation and DM yield ... 119
6.2.4 Water use efficiency ... 137
6.2.5 Quantifying the effect of water stress ... 138
6.2.6 Statistics ... 139
6.3 Results ... 141
6.3.1 Soil water deficit and plant available water capacity ... 141
6.3.2 Water use and yield ... 152
6.3.3 Water limitations and yield ... 157
6.4 Discussion ... 163
6.4.1 Plant available water and water extraction... 163
6.4.2 DM yield in relation to water stress ... 167
6.5 Conclusions ... 171
7 Lucerne yield and water use after different defoliation regimes ... 172
7.1 Introduction ... 172
7.2 Material and methods ... 173
7.2.1 Experimental site ... 173
7.2.2 Agronomic management ... 174
7.2.3 Measurements ... 177
7.2.4 Statistical analysis ... 180
7.3 Results ... 181
7.3.1 The effect of grazing management on DM yield, forage quality and water use ... 181
7.3.2 The effect of timing of grazing on DM yield, forage quality and water use ... 193
7.4 Discussion ... 204
7.4.1 The effects of grazing management on DM yield ... 204
7.4.2 The effects of grazing management on forage quality ... 208
7.4.3 The effects of grazing management on water use ... 209
7.5 Conclusions ... 212
8 General Discussion ... 213
8.1 Introduction ... 213
8.2 Lucerne establishment and yield ... 213
8.3 Water supply and demand ... 214
8.4 Mechanisms responsible for a reduction in yield under water stress ... 216
8.5 Grazing management ... 217
8.5.1 Grazing management and water use ... 218
8.6 Conclusions ... 220
Appendices ... 222
References ... 254
List of Tables
Table 3.1 Monthly long-term means (LTM) from 1960 to 2012 for total solar
radiation (Ro), maximum (Tmax), minimum (Tmin) and mean (Tmean) air
temperatures, rainfall, Penman potential evapotranspiration (EP), wind run and vapour pressure deficit (VPD) measured at the Broadfields Meteorological Station, Lincoln, Canterbury, New Zealand. ... 38
Table 3.2 Total seasonal rainfall, Penman potential evapotranspiration (EP) and
maximum potential soil moisture deficit (PSMDmax) for two growing
seasons from 1 July 2010 to 30 June 2012 for Ashley Dene and Iversen 12 at Lincoln University, Canterbury, New Zealand. ... 39
Table 3.3 Summary of sowing dates for two experiments conducted at Ashley Dene
paddock 2MB (Ashley Dene) and Iversen Field paddock 12 (Iversen 12) at Lincoln University, Canterbury, New Zealand. ... 44
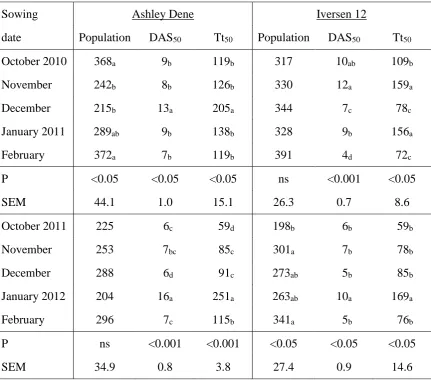
Table 4.1 Final population (plants/m2), days after sowing (DAS50) and thermal time
(Tt50;°Cd) requirement for 50% emergence of lucerne sown in the field
at Ashley Dene and Iversen 12 over a range of sowing dates from October 2010 to February 2012 at Lincoln University, Canterbury, New Zealand. ... 58
Table 4.2 Days after emergence (DAE) and thermal time (Tt; °Cd) requirement for
first trifoliate leaf appearance of lucerne sown in the field at Ashley Dene and Iversen 12 over a range of sowing dates from October 2010 to February 2012 at Lincoln University, Canterbury, New Zealand. ... 62
Table 4.3 Shoot and root plant dry weight (mg) and fractional partitioning of DM to
roots (Proot) for seedling dryland lucerne at the 2nd and 6th trifoliate leaf
growth stage at sown Ashley Dene and Iversen 12 from October 2011 to February 2012, Lincoln University, Canterbury, New Zealand. ... 63
Table 4.4 Total annual (1 July to 30 June) dry matter yields (t/ha) of lucerne sown
on 10 dates from October 2010 to July 2012 at Ashley Dene and Iversen 12, Lincoln University, Canterbury, New Zealand. ... 64
Table 4.5 Root biomass (t DM/ha) of lucerne in its first winter (Year 1: 13 June
Table 5.1 Shoot population (shoots/m2) of lucerne grown at Ashley Dene at the
end of each growth period for two seasons, subjected to different sowing dates at Lincoln University, Canterbury, New Zealand. ... 101
Table 5.2 Shoot population (shoots/m2) of lucerne grown at Iversen 12 at the end
of each growth period for two seasons, subjected to different sowing dates at Lincoln University, Canterbury, New Zealand. ... 102
Table 5.3 Seasonal accumulated intercepted radiation (Ri; MJ/m2) and shoot
radiation use efficiency (RUEshoot; g DM/MJ) for lucerne sown on five
dates in the establishment (sowing to June 2011) and year two (June 2011 to July 2012) at Ashley Dene, Lincoln University, Canterbury, New Zealand. ... 115
Table 5.4 Seasonal accumulated intercepted radiation (Ri; MJ/m2) and shoot
radiation use efficiency (RUEshoot; g DM/MJ) for lucerne sown on five
dates in the establishment (sowing to June 2011) and year two (June 2011 to July 2012) at Iversen 12, Lincoln University, Canterbury, New Zealand. ... 116
Table 5.5 Shoot (RUEshoot) and total (RUEtotal) radiation use efficiency (RUE; g
DM/MJ) for lucerne sown on fives dates in the establishment (sowing to June 2012) season at Ashley Dene and Iversen 12, Lincoln University, Canterbury, New Zealand. ... 118
Table 6.1 Maximum soil water deficit (mm) of dryland lucerne measured in the
establishment (2010/11) and second (2011/12) growth season at Ashley Dene and Iversen 12, Lincoln University, Canterbury, New Zealand. ... 142
Table 6.2 Seasonal accumulated water use (WU; mm) and water use efficiency
(WUE; kg DM/ha/mm) for lucerne sown on five dates in the establishment (sowing to June 2011) and second year (June 2011 to July 2012) at Ashley Dene, Lincoln University, Canterbury, New Zealand. ... 154
Table 6.3 Seasonal accumulated water use (WU; mm) and water use efficiency
(WUE; kg DM/ha/mm) for lucerne sown on five dates in the establishment (sowing to June 2011) and second year (June 2011 to July 2012) at Iversen 12, Lincoln University, Canterbury, New Zealand. ... 155
Table 7.1 Cultivars and their dormancy ratings used in two experiments in paddock
H7 at Ashley Dene, Lincoln University, Canterbury, New Zealand. ... 175
Table 7.2 Accumulated DM yield (t DM/ha) of dryland lucerne from June 2011 to
Table 7.3 Maximum soil water deficit (SWDmax; mm), crop water use (ET; mm),
water use efficiency (WUE; kg DM/ha/mm) and soil evaporation (ES;
mm) of dryland lucerne from 8 June 2011 to 5 December 2011 subjected to three grazing managements at Ashley Dene, Lincoln University, Canterbury, New Zealand. ... 186
Table 7.4 Annual dry matter yield (DM; t DM/ha), intercepted total radiation (Ri;
MJ/m2) and shoot radiation use efficiency (RUE
shoot; g DM/MJ) of
dryland lucerne within a rotationally grazed six paddock system from June 2011 to June 2012 at Ashley Dene, Lincoln University, Canterbury, New Zealand. ... 193
Table 7.5 Maximum soil water deficit (SWDmax; mm), crop water use (ET; mm),
water use efficiency (WUE; kg DM/ha/mm) and soil evaporation (ES;
mm) of dryland lucerne grown within a rotationally grazed six paddock system from June 2011 to June 2012 at Ashley Dene, Lincoln University, Canterbury, New Zealand. ... 196
Table 7.6 Mean and total annual energy and crude protein content of six dryland
lucerne paddocks in a rotationally grazed system over six growth cycles from June 2011 to June 2012 at Ashley Dene, Lincoln University, Canterbury, New Zealand. ... 200
Table 7.7 Date of grazing, DM yield (t DM/ha) and post-grazing residual (t
List of Figures
Figure 1.1 Flow diagram of thesis structure. ... 5
Figure 2.1 Monthly growth rate () and air temperature () for irrigated lucerne
from November 1968 to December 1969 at Lincoln University, Canterbury, New Zealand. (Adapted from Hoglund et al. (1974)). ... 12
Figure 2.2 Broken-stick threshold model for thermal time (Tt) accumulation at
different mean air temperatures as proposed (Moot et al., 2000). ... 14
Figure 2.3 Growth rate in relation to mean air temperature (Tair) for irrigated
lucerne from November 1968 to December 1967 at Lincoln University, Canterbury, New Zealand. (Analysed from data presented in Figure 2.1, adapted from Hoglund et al. (1974))... 15
Figure 2.4 The relationship between leaf area expansion rate (LAER) and
photoperiod (From Teixeira et al. (2009)). ... 17
Figure 2.5 The relationship between phyllochron (mainstem leaf appearance rate;
°Cd) and photoperiod (From Teixeira et al. (2009)). ... 18
Figure 2.6 The relationship between total radiation use efficiency (RUEtotal) of
irrigated lucerne grown at Lincoln University, Canterbury, New Zealand (From Brown et al. (2006b)). ... 21
Figure 2.7 Fractional partitioning of DM to crown plus taproot in irrigated lucerne
crops defoliated on a 42 day rotation in relation to increasing (IPp) and decreasing (DPp) photoperiod (a) and the relationship between 100 mm soil and air temperature grown at Lincoln University, Canterbury, New Zealand (Adapted from Teixeira et al. (2008)). ... 23
Figure 2.8 Relative effect on yield forming processes (ƒdry/irr) in lucerne of degree
of water limitation (T/TD) for leaf area index expansion (a), mainstem
node appearance rate (b), and radiation use efficiency (c) at Lincoln University, Canterbury, New Zealand (From Brown et al. (2009)). ... 29
Figure 3.1 Upper () and lower () limits of mature lucerne water extraction to
2.3 metres at Ashley Dene (A) and Iversen Field (B) at Lincoln University, Canterbury, New Zealand. Shaded areas and numbers represent plant available water content (Adapted from Moot et al. (2008) and Brown (2004)). ... 36
Figure 3.2 Monthly rainfall for Ashley Dene () and Iversen 12 () and Penman
Figure 3.3 Seasonal pattern of potential soil water deficit (PSMD) for two seasons from 1 July 2010 to 30 June 2012 for Ashley Dene (—) and Iversen 12 (—) at Lincoln University, Canterbury, New Zealand. --- marks the long-term mean of maximum PSMD (PSMDmax; 520 mm). ... 41
Figure 3.4 Mean daily solar radiation () and mean daily air temperature for
Ashley Dene (╶╴) and Iversen 12 (╶╴) for monthly periods from 1 July 2010 to 30 June 2012, Lincoln University, Canterbury, New Zealand. ... 42
Figure 3.5 Mean daily vapour pressure deficit () and wind run (╶╴) for
monthly periods from 1 July 2010 to 30 June 2012. Data were obtained from Broadfields Meteorological Station, Canterbury, New Zealand. ... 43
Figure 4.1 Number of days (a) and emergence rate (b) to 50% final seedling
emergence, and number of days (c) and leaf appearance rate (d) from 50% emergence to first trifoliate leaf of lucerne sown at different times; October (), November (), December (), January (▽) and February (◇) in the field from October 2011 to February 2012 at Ashley Dene (open) and Iversen 12 (closed) at Lincoln University, Canterbury, New Zealand. ... 55
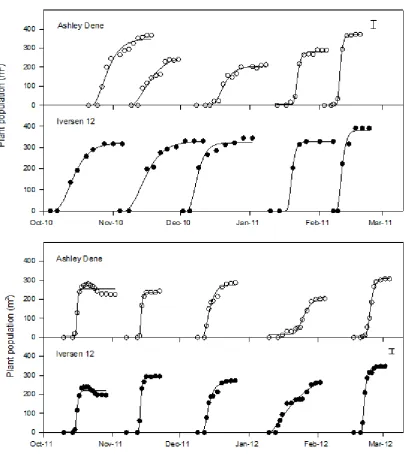
Figure 4.2 The field emergence of lucerne sown on 10 dates at Ashley Dene ()
and Iversen 12 () over two seasons from October 2010 to March 2012 at Lincoln University, Canterbury, New Zealand. ... 59
Figure 4.3 Gravimetric water content at sowing and daily rainfall () for Ashley
Dene () and Iversen 12 () for 10 sowing dates over two seasons from October 2010 to March 2012 at Lincoln University, Canterbury, New Zealand. ... 60
Figure 4.4 Thermal time to 50% field emergence (Tt50) in relation to gravimetric
water content (GWC) at sowing (0-20 mm) for lucerne sown at Ashley Dene () and Iversen 12 () from October 2010 to February 2012 at Lincoln University, Canterbury, New Zealand. ... 61
Figure 4.5 Total annual shoot yield of lucerne sown from October to February at
Figure 4.8 Lineargrowth rates of lucerne sown on five dates; SD1 (), SD2 (), SD3 (), SD4 (▽) and SD5 (◇) at Ashley Dene and Iversen 12, Lincoln University, Canterbury, New Zealand. ... 70
Figure 4.9 Linear growth rate of two year old lucerne crops in relation to
increasing (—) and decreasing (---) mean air temperature over the regrowth cycle at Ashley Dene () and Iversen 12 (), Lincoln University, Canterbury, New Zealand. ... 71
Figure 4.10 Fractional partitioning of dry matter to roots (Proot) in relation to
photoperiod at emergence for seedling lucerne at 50% flowering over a range of sowing dates at Ashley Dene () and Iversen 12 (), Lincoln University, Canterbury, New Zealand. ... 75
Figure 4.11 Accumulated shoot () and root () dry matter yields for lucerne
sown on five dates at Ashley Dene and Iversen 12, Lincoln University, Canterbury, New Zealand. ... 77
Figure 4.12 Fractional partitioning of dry matter to roots (Proot) in relation to
increasing () and decreasing () photoperiod at the start of regrowth periods for lucerne grown at Ashley Dene and Iversen 12, Lincoln University, Canterbury, New Zealand. ... 78
Figure 4.13 Yield accumulation of lucerne sown on 17 February 2012 at Ashley
Dene () and Iversen 12 () in relation to predicted potential yield of forage kale (∙∙∙∙∙), oats () and annual ryegrass (‒ ‒ ‒) at Lincoln University, Canterbury, New Zealand. ... 82
Figure 5.1 Leaf area (cm2) of seedling () and regrowth () lucerne shoots
from Ashley Dene (red) and Iversen 12 (black) measured by LICOR 3100 area meter intact (leaf areashoot) in relation to leaf area of the same
shoots when leaf and stem fractions were measured independently (leaf
arealeaf+stem). ... 89
Figure 5.2 Leaf area index (LAI) measured non-destructively using the sunscan
canopy analyser in relation to LAI measured destructively of seedling () and regrowth () lucerne, grown at Ashley Dene (red) and Iversen 12 (black) from July 2011 to June 2012 at Lincoln University, Canterbury, New Zealand. ... 91
Figure 5.3 The natural log of solar radiation transmission (Ln(R/Ro; measured with
Figure 5.4 The number of mainstem () and total () nodes for seedling lucerne in relation to thermal time accumulation from sowing to 50% flowering grown at Ashley Dene and Iversen 12 after sowing on five dates from October 2011 to February 2012 at Lincoln University, Canterbury, New Zealand. ... 95
Figure 5.5 The number of mainstem () and total () nodes for second year
lucerne grown at Ashley Dene and Iversen 12 from June 2011 to July 2012 at Lincoln University, Canterbury, New Zealand. ... 97
Figure 5.6 Phyllochron of mainstem seedling () and regrowth () lucerne
measured from October 2010 to July 2012 at Ashley Dene and Iversen 12 at Lincoln University, Canterbury, New Zealand. ... 98
Figure 5.7 Phyllochron of seedling (a,c) and regrowth (b,d) lucerne in response to
increasing () and decreasing () photoperiods at the start of each growth period when grown at Ashley Dene (a,b) and Iversen 12 (c,d), Lincoln University, Canterbury, New Zealand. ... 99
Figure 5.8 The rate of secondary node appearance (branching) in relation to the
rate of mainstem node appearance (phyllochron) for dryland lucerne crops grown at Ashley Dene () and Iversen 12 () in 2011/2012, Lincoln University, Canterbury, New Zealand. ... 100
Figure 5.9 Leaf area index of lucerne grown at Ashley Dene from five sowing
dates over two seasons from October 2011 to July 2012 at Lincoln University, Canterbury, New Zealand. ... 104
Figure 5.10 Leaf area index of lucerne grown at Iversen 12 from five sowing dates
over two seasons from October 2011 to July 2012 at Lincoln University, Canterbury, New Zealand. ... 105
Figure 5.11 Leaf area expansion rate (LAER) of seedling lucerne sown on five
dates (present in red); SD1 (October; ), SD2 (November; ), SD3 (December; ), SD4 (January; ▽) and SD5 (February; ◇) and subsequent regrowth phases from October 2010 to July 2012 at Ashley Dene, Lincoln University, Canterbury, New Zealand. ... 106
Figure 5.14 Leaf area index (LAI) in relation to total leaves per shoot for dryland lucerne grown at Ashley Dene () and Iversen 12 () from July 2011 to June 2012 at Lincoln University, Canterbury, New Zealand. 108
Figure 5.15 Leaf area index (LAI) in relation to total number of leaves per m2 for
dryland lucerne grown at Ashley Dene () and Iversen 12 () from July 2011 to June 2012 at Lincoln University, Canterbury, New Zealand. 109
Figure 5.16 Mean leaf size (mm2) for individual regrowth phases in relation to date
(a) and mean air temperature (b) for dryland lucerne grown at Ashley Dene () and Iversen 12 () from July 2011 to June 2012 at Lincoln University, Canterbury, New Zealand. ... 110
Figure 5.17 Leaf area expansion rate (LAER) in relation to mean leaf size for
individual regrowth phases for dryland lucerne grown at Ashley Dene () and Iversen 12 () from July 2011 to June 2012 at Lincoln University, Canterbury, New Zealand. ... 111
Figure 5.18 Crop nitrogen (N) uptake in relation to shoot yield for dryland lucerne
grown at Ashley Dene () and Iversen 12 () from July 2011 to June 2012 at Lincoln University, Canterbury, New Zealand. ... 112
Figure 5.19 Crop nitrogen (N) uptake in relation to leaf area index (LAI) for
dryland lucerne grown at Ashley Dene () and Iversen 12 () from July 2011 to June 2012 at Lincoln University, Canterbury, New Zealand. 113
Figure 5.20 Relationship between accumulated shoot yield and accumulated
intercepted total solar radiation by lucerne crops sown on fives dates at Ashley Dene () and Iversen 12 () for both the establishment (2010/11) and the subsequent growth season (2011/12) at Lincoln University, Canterbury, New Zealand. ... 114
Figure 5.21 Shoot radiation use efficiency (RUEshoot) of lucerne sown on five
dates; October (), November (), December (), January (▽) and February (◇) at Ashley Dene and Iversen 12, Lincoln University, Canterbury, New Zealand. ... 117
Figure 5.22 Measured () and temperature adjusted () shoot radiation use
efficiency (RUEshoot) for second year dryland lucerne sown on five dates
in the previous season; October (), November (), December (), January (▽) and February (◇) at Iversen 12 from July 2011 to July 2012, Lincoln University, Canterbury, New Zealand. ... 126
Figure 6.1 Upper () and lower () limits of mature lucerne water extraction to
Figure 6.2 Comparison of measured () and predicted (—) soil water content (SWC) for the 0-0.2 m soil layer of fallow treatments at Ashley Dene (A, ) and Iversen 12 (B, ), Lincoln University, Canterbury, New Zealand. ... 135
Figure 6.3 Soil water deficit to 2.3 m from October 2010 to July 2012 for dryland
lucerne sown on five dates at Ashley Dene and Iversen 12 Lincoln, University, Canterbury, New Zealand. ... 143
Figure 6.4 Upper () and lower () limits of lucerne water extraction measured
in the establishment (2010/11) and subsequent (2011/12) year sown on five dates at Ashley Dene, Lincoln University, Canterbury, New Zealand. ... 145
Figure 6.5 Upper () and lower () limits of lucerne water extraction measured
in the establishment (2010/11) and subsequent (2011/12) year sown on five dates at Iversen 12, Lincoln University, Canterbury, New Zealand. ... 146
Figure 6.6 Water extraction patterns at five 0.1 m soil layers for a dryland lucerne
crop in the second season from August 2011 to July 2012 at Ashley Dene, Lincoln University, Canterbury, New Zealand. ... 148
Figure 6.7 Water extraction patterns at five 0.1 m soil layers for a dryland lucerne
crop in the second season from August 2011 to July 2012 at Iversen 12, Lincoln University, Canterbury, New Zealand. ... 149
Figure 6.8 Time of water extraction (tc) for each individual soil layer for seedling
(a,b) and regrowth (c,d) dryland lucerne at Ashley Dene () and Iversen 12 () for the 2011/12 season at Lincoln University, Canterbury, New Zealand. ... 151
Figure 6.9 Extraction decay constant (-kl) of second year dryland lucerne over a
2.25 m soil profile at Ashley Dene () and Iversen () in the 2011/12 season at Lincoln University, Canterbury, New Zealand. Error bar represent l.s.d (P = 0.05). ... 152
Figure 6.10 Accumulated shoot yield in relation to accumulated water use for
Figure 6.12 Transpiration (ET) from dryland lucerne grown at Ashley Dene (a; )
and Iversen 12 (b; ) compared with transpiration demand (EPT; )
from June 2011 to July 2012, Lincoln University, Canterbury, New Zealand. Values above each regrowth period quantify transpiration relative to transpiration demand (ET/EPT). ... 158
Figure 6.13 The mean soil water deficit in relation to the water stress (ET/EPT) for
individual regrowth cycles of dryland lucerne at Ashley Dene () and Iversen 12 () Lincoln University, Canterbury, New Zealand. ... 159
Figure 6.14 Observed phyllochron of dryland lucerne relative to a predicted
irrigated crop (ƒobs/pred) in relation to water stress (ET/EPT) of crops
grown at Ashley Dene () and Iversen 12 () 2011/2012, Lincoln University, Canterbury, New Zealand. ... 160
Figure 6.15 Rate of branching (axillary leaves per mainstem node) for dryland
lucerne in relation to water stress (ET/EPT) of crops grown at Ashley
Dene () and Iversen 12 () 2011/2012, Lincoln University, Canterbury, New Zealand. ... 160
Figure 6.16 Observed LAER (a) and RUEshoot (b) of dryland lucerne relative to a
predicted irrigated crop (ƒobs/pred) in relation to water stress (ET/EPT) of
crops grown at Ashley Dene () and Iversen 12 () 2011/2012, Lincoln University, Canterbury, New Zealand. ... 162
Figure 6.17 Relative effect (fobs/pred ) on LAER (a) and RUEshoot (b) in lucerne in
relation to water stress (ET/EPT) in Ashley Dene () and Iversen 12 ()
from 2011/2012 redrawn with data from Brown et al. (2009) of dryland relative to irrigated lucerne (fdry/irr) from 2000/2002 () at Lincoln
University, Canterbury, New Zealand. ... 170
Figure 7.1 Crop mass ofdryland lucerne subjected to three grazing managements
from 27 September to 5 December 2011; set stocked (△), semi-set stocked (□) and rotationally grazed () at Lincoln University, Canterbury, New Zealand. ... 183
Figure 7.2 Leaf area index of dryland lucerne subjected to three grazing
managements from 27 September to 5 December 2011; set stocked (△), semi-set stocked (□) and rotationally grazed () at Lincoln University, Canterbury, New Zealand. ... 184
Figure 7.3 Relationship between accumulated shoot yield and accumulated total
Figure 7.4 Canopy nitrogen (N) uptake in relation to leaf area index (LAI) of dryland lucerne subjected to three grazing managements from 27 September to 5 December 2011; set stocked (△), semi-set stocked (□) and rotational () at Lincoln University, Canterbury, New Zealand. ... 185
Figure 7.5 Accumulated crop water use (red), total water use (black) and daily
rainfall () ofdryland lucerne subjected to three grazing managements; set- stocked (∙∙∙∙∙), semi set-stocked (‒ ‒ ‒) and rotational grazing () from July to December 2012 at Lincoln University, Canterbury, New Zealand. ... 187
Figure 7.6 Transpiration (ET) in relation to intercepted radiation (Ri) accumulated
from 1 July to 5 December 2011 for dryland lucerne subjected to three grazing management treatments from 27 September to 5 December 2011; set stocked (△), semi-set stocked (□) and rotational () at Lincoln University, Canterbury, New Zealand. ... 188
Figure 7.7 Accumulated shoot yield of dryland lucerne from June 2011 to June
2012 subjected to three grazing managements from 27 September to 5 December 2011; set stocked (△), semi-set stocked (□) and rotational grazed () at Lincoln University, Canterbury, New Zealand. ... 189
Figure 7.8 Soil water deficit to 2.3 m for June 2011 to July 2012 for dryland
lucerne subjected to three grazing managements; set stocked (△), semi-set stocked (□) and rotational grazing () at Lincoln University, Canterbury, New Zealand. ... 190
Figure 7.9 Relationship between accumulated shoot yield and accumulated total
intercepted radiation of dryland lucerne from June 2011 to June 2012 subjected to three grazing managements; set stocked (△), semi-set stocked (□) and rotational grazing () at Lincoln University, Canterbury, New Zealand. ... 191
Figure 7.10 Accumulated shoot yield in relation to accumulated crop water use
(ET) for dryland lucerne from June 2011 to June 2012 subjected to three
Figure 7.12 Relationship between accumulated shoot yield and accumulated total intercepted radiation of dryland lucerne within a rotationally grazed six paddock system; paddock 1 (△), 2 (□), 3 (◇), 4 (×), 5 (▽) and 6 () from June 2011 to June 2012 at Ashley Dene, Lincoln University, Canterbury, New Zealand. ... 195
Figure 7.13 Accumulated shoot yield in relation to accumulated water use of
dryland lucerne within a rotationally grazed six paddock system; paddock 1 (△), 2 (□), 3 (◇), 4 (×), 5 (▽) and 6 () from June 2011 to June 2012 at Ashley Dene, Lincoln University, Canterbury, New Zealand. ... 196
Figure 7.14 Transpiration (ET) in relation to intercepted radiation (Ri) accumulated
for dryland lucerne within a rotationally grazed six paddock system; paddock 1 (△), 2 (□), 3 (◇), 4 (×), 5 (▽) and 6 () from June 2011 to June 2012 at Ashley Dene, Lincoln University, Canterbury, New Zealand. ... 197
Figure 7.15 Transpiration (ET) in relation to intercepted radiation (Ri) accumulated
within regrowth periods for dryland lucerne within a rotationally grazed six paddock system (paddock one shown) from June 2011 to June 2012 at Ashley Dene, Lincoln University, Canterbury, New Zealand. ... 198
Figure 7.16 Transpiration per unit of intercepted radiation (ET/Ri) in relation to
mean vapour pressure deficit (VPA) for dryland lucerne within a rotationally grazed six paddock system; paddock 1 (△), 2 (□), 3 (◇), 4 (×), 5 (▽) and 6 () from June 2011 to June 2012 at Ashley Dene, Lincoln University, Canterbury, New Zealand. ... 199
Figure 7.17 Leaf percentage (a), energy content (MJ ME/kg DM ;b) and crude
protein content (CP; c) of dryland lucerne at final harvest in a rotationally grazed system over 6 growth cycles from June 2011 to June 2012 at Ashley Dene, Lincoln University, Canterbury, New Zealand. ... 201
Figure 7.18 Energy (GJ ME/ha; ) consumption and DM utilisation () in
List of Equations
Equation 1.1 Y = WU * WUE * HI ... 2
Equation 2.1 Y = Ro * R/Ro * RUE * HI ... 11
Equation 2.2 Thermal time (Tt; °Cd) =∑ (Tmean – Tb) ... 13
Equation 2.3 R/Ro = 1-exp(-k*LAI) ... 16
Equation 2.4 RUE = Pn = (Pg – RT) / Ri ... 20
Equation 3.1 PSMDi = PSMDi-1 + EPi – rainfalli ... 49
Equation 4.1 Y(t) = a*exp(-exp[-b*(t – m)] ... 52
Equation 4.2 t(DAS50) = m – ln[-ln(Y/100)]/b ... 52
Equation 5.1 y = a + c/(-b(x – m)) ... 89
Equation 6.1 WU = min(ET, EPT ) ... 129
Equation 6.2 SWC =
∑
top bot θ * d ... 131Equation 6.3 WU = PR – (SWCE – SWCS) ... 131
Equation 6.4 WUdaily = (WU/EP) * EPdaily ... 131
Equation 6.5 SWD = SWDi + WUdaily - R ... 131
Equation 6.6 ES1 = EP * (1-R/Ro) when ∑ES≤ U... 133
Equation 6.7 ES2 = α * t1/2 when ∑ES > U ... 133
Equation 6.8 t = [(∑ES - U)/α]2 ... 134
Equation 6.9 SWCt = LL + PAWC exp(-kl(t-tc)Sc) Sc= 0 if t ≤ tc ... 136
Equation 6.10
∑
= − = n i i i s m n RMSD 1 2 ) ( 1 ... 139Equation 7.1 CP= N%*6.25 ... 179
List of Abbreviations
Abbreviation Description Units a.i Active ingredient
CP Crude protein %
DM Dry matter t/ha
DL Critical limiting water deficit mm DUL Drained upper limit mm3/mm3 EFV Extraction front velocity mm/day EP Penman potential evaporation mm EPT Potential transpiration mm
ES Soil evaporation mm
ET Actual transpiration mm
fobs/pred Observed value/predicted value dimensionless
GAI Green area index dimensionless
HI Harvest index dimensionless
k extinction coefficient dimensionless -kl extraction rate constant /day
LAER Leaf area expansion rate m2/m2/°Cd LAI Leaf area index dimensionless LAIcrit Critical leaf area index dimensionless
LL lower limit mm3/mm3
l.s.d Least significant difference
ME Metabolisable energy MJ/kg PAWC Plant available water content mm
Pp Photoperiod h/day
Proot Fractional DM partitioning
PSWD Potential soil water deficit mm
R/Ro Fractional radiation interception dimensionless
R2 Coefficient of determination
Ri Intercepted radiation MJ/m2
RMSD Root mean square deviation
Abbreviation Description Units RUE Radiation use efficiency g DM/MJ
RUEshoot Radiation use efficiency for shoot DM g DM/MJ
RUEtotal Radiation use efficiency for total DM g DM/MJ
SEM Standard error of the mean
SWC Soil water content mm
SWD Soil water deficit mm
SWDmax Maximum annual soil water deficit mm
Tb Base temperature °C
tc Extraction start time within an individual layer date
Tm Maximum temperature °C
To Optimum temperature °C
VPD Vapour pressure deficient kPa
WUE Water use efficiency kg DM/ha/mm
1
General Introduction
1.1 Overview of dryland forage production in New Zealand
New Zealand has a temperate climate (White, 1999) which supports perennial ryegrass (Lolium perenne) and white clover (Trifolium repens) as the main contributors to our pastoral agriculture. These pastures are productive and persistent in areas of high rainfall (>1200 mm) and fertile soils (Brock and Hay, 2001), but unreliable in dryland pastoral systems (Moot, 2012). The central mountain range in both islands, combined with the westerly flows creates a rain shadow on the east coast of ~2.9 M ha which receives ≤800 mm of annual rainfall (Brown and Green, 2003). In these regions evapotranspiration exceeds annual rainfall from 300-800 mm, which leads to potential soil moisture deficits (PSMD) between 200 to 500 mm (Salinger, 2003). In the absence of irrigation, water stress conditions develop most summers and pasture production declines when about half of the soil stored plant available water is depleted (Sheaffer et al., 1988). In Canterbury, plant available water generally ranges from 50 to 150 mm/m due to the highly variable, alluvial outwash soils (Webb, 2000). Mills et al. (2006) showed in a dryland cocksfoot (Dactylis glomerata L.) pasture, yield decreased relative to a fully watered crop by 1.4% per mm beyond a critical deficit of 78 mm. To overcome summer dry conditions the area of land irrigated in Canterbury has increased three fold in the last 30 years to ~360 thousand ha, with the potential for up to 1 M ha to be irrigated (Miller and Veltman, 2004; Moot et al., 2010). Dryland forage production is expected to continue on the hill country where topography limits irrigation and areas on the plains which may be restricted by water availability. However, alternative species and management strategies are required to maximise production in these water limited environments (Moot et al., 2010).
(Avery et al., 2008). Successive droughts can lead to negative environmental impacts. For example, failed forage crops may lead to over-grazing of sensitive areas by livestock, exposing the soil surface to wind erosion (Avery et al., 2008). Furthermore, there are predictions for a drier future for these farms. The average increase in surface temperature in New Zealand has been 0.7 °C in the last 150 years which has resulted in the strengthening of westerly wind flow patterns. By 2080 predictions indicate 10% less rain and an increase in PSMD of 20 to 30% in these dry east coast regions (Salinger, 2003). The adaption to a drier environment by dryland pastoral systems has resulted in a need to diversify the traditional ryegrass/white clover pasture to alternative, more suitable species (Milne, 2011; Moot, 2012). Agronomic management strategies are one approach to increase crop productivity when water is scarce (Passioura, 2006). To do this requires an understanding of how crops extract water and how this affects yield. Crop responses to water shortage in relation to environmental conditions needs to be understood as management strategies will depend on specific soil-crop combinations within a farm system.
1.2 Potential to increase dryland pasture production
Where rainfall is insufficient to meet crop demand, the accumulation of yield (Y) is related to water use (WU), described by Equation 1.1. The relationship can be further defined by the dry matter (DM) produced per unit of water transpired (water use efficiency; WUE) and the harvest index (HI), which is the conversion of biomass into usable, usually above ground herbage for forages.
Equation 1.1 Y = WU * WUE * HI
access to stored water in the soil profile. For example, on a Wakanui silt loam, a free draining, deep soil, lucerne extracted 328 mm of water to a depth of 2.3 m. In comparison a perennial ryegrass pasture extracted only 243 mm of water to 1.5 m (Moot
et al., 2008). The lucerne crop had a WUE of 40 kg DM/ha/mm compared with the perennial ryegrass pasture of 18 kg DM/ha/mm. Together these attributes show lucerne has the ability to both extract more water and use it more efficiently than ryegrass based pastures. Therefore, lucerne as a forage crop is one strategy to increase yield when water is scarce on dryland farms. The physiology of lucerne in relation to water use will be studied in greater detail to allow the refinement of best management practices.
1.3 Research objectives
The main aim of this research was to refine best management practices for dryland lucerne crops in relation to crop water extraction. To do this two field experiments were implemented over two years; 2010/11 and 2011/12. Lucerne was grown under dryland conditions in the same climate, but on two sites which differed in plant available water capacity. The plant available water for seedling crops was manipulated by imposing a second treatment, of sowing date. Sowing date may influence root growth down the soil profile and therefore water available for extraction. The secondary aim was to examine how grazing management affected dryland lucerne yield and water use. To do this, a third and fourth experiment were implemented in 2011/2012 which involved three different grazing strategies, on an established lucerne stand.
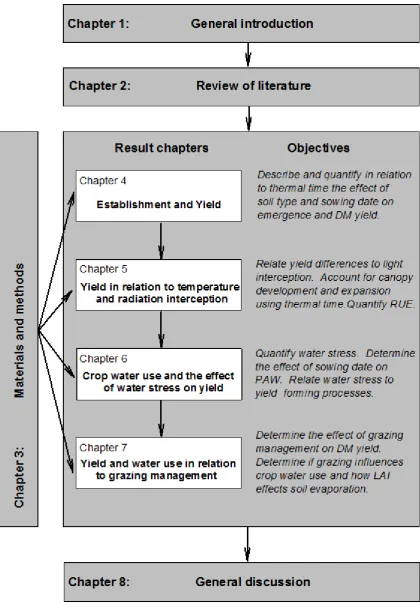
This thesis is structured in eight chapters (Figure 1.1). Chapter 2 reviews the literature and focuses on the environmental factors which determine yield potential and physiological reasons for a reduction in yield in relation to water stress. Chapter 3 describes the experimental design and agronomic management and environmental conditions for the first two experiments, which are common to the results in Chapters 4 to 6. Research is divided into four chapters, each with specific objectives.
between sites and years. DM yield in the establishment and subsequent year will be compared to determine the sowing date where yield is maximised for both sites. The interaction between the PAWC of the soil and sowing date will combine to produce crops which differ in yield.
The objective of Chapter 5 is to quantify the yield of these crops in relation to environmental variables as management strategies depend on the potential yield of the crop in a specific environment. To do this, yield will be related to intercepted radiation by accounting for canopy development and expansion and the efficiency with which radiation is converted to biomass.
Chapter 6 will examine how the relationships formed in Chapter 5 are influenced by water shortage. To do this, water supply will be quantified to determine water extraction patterns for the crops which differed in yield. Water stress will be quantified as crop transpiration in relation to demand, and relationships developed between the yield forming processes identified in Chapter 5 in relation to water limitation.
Chapter 7 is the final results chapter. The aim of this research is to examine if the timing of DM production can be influenced by grazing the crop at different times, through the manipulation of crop water use. To do this, the crop canopy and the pattern of intercepted radiation will be manipulated by different grazing managements and yield and water use determined.
2
Review of literature
This chapter reviews the current literature on dryland lucerne production and explains why it is a suitable dryland pasture species. It focuses on crop establishment because sowing date is a main treatment of this research. Intercepted solar radiation by the crop canopy is the driver of both crop photosynthesis and transpiration, which contribute to yield. The mechanisms which contributed to the capture and use of radiation will be described and current literature on how temperature and water limitation affects these processes will be reviewed.
2.1 Lucerne production in New Zealand
2.1.1 Overview
loss from grazed pastures. They reported lucerne yielded 14% more than a ryegrass/white clover pasture and leached 37% less nitrate at 0.6 m depth, although this may further be reduced because lucerne can extract water beyond this depth.
2.1.2 DM yield
Lucerne is grown in a wide range of environments and soil types in New Zealand and therefore reported annual yield ranges from 2.0 to 28.0 t DM/ha/year. The lower yield reported by Musgrave (1977) was for lucerne sown into soil with a pH of 5.5 and seedbed described as ‘rubbly’ which established 21 plants/m2. This is below the suggested threshold of 30 to 45 plants/m2 to maximise yield (Palmer and
Wynn-Williams, 1976; Teixeira et al., 2007a). Lucerne establishment is discussed in Section 2.6. Successful lucerne establishment can increase DM yield three fold relative to poor quality browntop (Agrostis capillaris) pastures (Kearney et al., 2010) and lucerne consistently yields ~40% more than grass based pastures in a dryland environment (Iversen and Calder, 1956; Douglas, 1986; Moot et al., 2008). Iversen and Calder (1956) reported an annual yield of 5.1 t DM/ha for lucerne grown on a stony Lismore silt loam, consistent with that in the current research. They found two thirds of the DM production occurred in spring but, compared over five years, lucerne had the lowest coefficient of variability in yield relative to grass based pastures. This suggests stored soil water contributes a larger proportion to yield than that of the shallower rooting pasture species. Lucerne yields increase with greater plant available water. Janson and Knight (1973) reported the yield of lucerne on a stony silt loam with a PAWC of 50 mm/m soil increased from 4.8 to 15.6 t DM/ha when irrigation was applied. Furthermore, Brown et al. (2003) consistently grew 20 t DM/ha from a dryland crop on a Wakanui silt loam with PAWC a of 150 mm/m. The physiological basis for yield and how water limitation affects this are discussed in the second part of this review.
2.1.3 Forage quality and animal production
Brown et al. (2005a) reported lucerne had relatively stable leaf and stem ME of 11.6 and 9.4 MJ/kg DM, respectively and 29.1 and 11.6% for CP. Forage quality was predominantly driven by the leaf to stem ratio, which decreased as regrowth duration increased due to the lignification of the stem which lowers digestibility (Fletcher, 1976). For example, Allison and Vartha (1973) reported quality could be improved by reducing the regrowth duration from 5 to 4 weeks, noting leaf percentage increased from 55 to 65%. However, increased defoliation frequency lengthens the time the canopy is incomplete which allows germination of weed seeds and can reduce the stand persistence (Palmer, 1982). Hoglund et al. (1974) showed weed composition of total DM decreased from 50% to <5% when defoliation was lengthened from pre-bud to flowering. The ability of lucerne to fix atmospheric nitrogen maintains CP of forage in dryland farm systems which often receive little nitrogen fertiliser. Irrespective of regrowth duration, these authors reported annual CP yields of ~2 t/ha, four fold that reported by Mills et al. (2006) for a dryland nitrogen deficient cocksfoot pasture. Elliott and Kerse (1974) reviewed on-farm lucerne areas and stocking rate and found farms with >15% of total area in lucerne had an average carrying capacity of 1 stock unit (s.u)/ha higher. Further development of lucerne beyond this attributed directly to 4 to 5 extra s.u per ha, with the recommendation that 40-60% of the farm should be in lucerne to maximise lamb LWG (White, 1982).
2.1.4 Defoliation management
full sunlight, and induces bud expansion. Frequent defoliation increased the lag period for bud formation, which delayed regrowth. Throughout the year, this lag period resulted in a decline in yield with increasing frequency of defoliation (Vartha, 1973; Hoglund et al., 1974; Teixeira et al., 2007c) and reduced plant population, which favoured ingress of weeds (Palmer, 1982) and decreased stand persistence. For example, Langer and Steinke (1965) reported cutting lucerne every 20 days (6 cuts/year) halved the DM yield compared with cutting every 40 days (3 cuts/year). Hoglund et al. (1974) showed yield increased when cutting time was lengthened from bud initiation (10.3 t DM/ha) to first flower (15.6 t DM). Teixeira et al. (2007c) reported a similar response, where the decline in yield was proportional to the amount of light intercepted by the canopy. Grazing management has been refined through greater understanding of lucerne physiology and reviewed by Moot et al. (2003), and then implemented successfully on-farm (Avery et al., 2008). To reduce the influence of regrowth interval on the current research, defoliation will be standardised across the experiments based on crop phenology (Section 3.3.6).
2.1.4.1 Continuous grazing
The literature shows there is generally a reduction in yield and stand persistence when lucerne is continuously grazed. For example, O'Connor (1970) showed yield of lucerne continuously grazed in the spring and summer was 75% less than that which had been intensively grazed for 12 days, on a rotational basis. Janson (1974) reported growth rate was a third for a crop continuously grazed compared with a rotational grazed crop, which resulted in annual DM yields of 13.0 and 18.3 t DM/ha, respectively. The authors noted continuous grazing damaged basal buds which reduced regrowth capacity. The result of this has been recommendations against continuous grazing of lucerne at any time (Janson, 1982; Moot et al., 2003).
declines. Continuous grazing over a longer term depletes root reserves which increases plant mortality (Teixeira et al., 2007b; Teixeira et al., 2007c). Thus, stocking rate and grazing duration are two key factors which need to be taken into account if set stocking lucerne. O'Connor (1970) continuously grazed lucerne from spring for five months, which depleted perennial reverses and did not allow replenishment during the autumn. Janson (1974) implemented a stocking rate of 30 ewes with 1.3 lambs/ha, feed demand exceeded feed supply and plots were destocked within six weeks of the start of grazing.
2.2 Environmental factors that determine lucerne yield
2.2.1 Crop growth, development and yield
Crop yield is the result of plant growth and development (Hay and Walker, 1989). Development is the morphological change of the crop dimensions through distinct events; from germination to maturity. Plant development is driven by temperature and modified by photoperiod (Pp). Brown and Moot (2004) showed that for individual lucerne regrowth cycles the rate of mainstem leaf appearance (phyllochron) occurred at a constant rate in relation to the accumulation of temperature but increased from 37 °Cd in spring, when Pp was 11.4 h, to 60 °Cd when Pp increased to 15.7 h in late summer. Growth refers to the increase in crop DM as the net result of gain through photosynthesis and loss via respiration (Hay and Walker, 1989). Photosynthesis occurs in the chloroplasts, found in crop leaves. During this process incident light energy is used to reduce atmospheric CO2 and water to produce carbohydrate. The formation of
yield, which includes both crop development and growth, can be described by Equation 2.1:
Equation 2.1 Y = Ro * R/Ro * RUE * HI
Where yield (Y) is the quantity of useable dry matter (DM), which is the result of the quantity of solar radiation (Ro), and the fraction intercepted by the canopy (R/Ro), RUE
is the radiation use efficiency of conversion of R/Ro to DM. HI represents the harvest
2.2.2 Temperature
Plant growth and development rate generally increase with temperature (Monteith, 1972; Gallagher and Biscoe, 1978). Hoglund et al. (1974) showed irrigated lucerne grown in Canterbury had a growth rate of 150 kg DM/ha/day during summer when mean air temperature was 18 °C which decreased to 25 kg DM/ha/day in winter when temperature decreased to 5 °C (Figure 2.1).
Figure removed for copyright compliance
Figure 2.1 Monthly growth rate () and air temperature () for irrigated lucerne from
November 1968 to December 1969 at Lincoln University, Canterbury, New Zealand. (Adapted from Hoglund et al. (1974)).
2.2.2.1 Quantifying temperature, thermal time
Equation 2.2 Thermal time (Tt; °Cd) =∑ (Tmean – Tb)
Where, Tmean = (Tmax + Tmin)/2
For example, Moot et al. (2000) showed white clover germinated in 12 days when soil temperature was 5 °C compared with 4 days when at 15 °C. The rate of germination relative to temperature showed a strong (R2 = 0.98) linear relationship, thus the thermal time for germination was consistent at 57 °Cd (Tb = 0 °C). Fick et al. (1988) defined
the cardinal temperatures for lucerne and suggested the thresholds were; a Tb of 5 °C, To
of 30 °C and Tm of 40 °C. Moot et al. (2001) showed results of lucerne grown in a cool
climate that suggested this Tb was too high. Furthermore, Bonhomme (2000) suggested
the Tt became non-linear at lower temperatures which is more relevant for crops grown in a temperate environment where Tmean is closer to Tb. Moot et al. (2001) presented a
broken-stick threshold model for lucerne to account for this (Figure 2.2). Tt is zero for temperatures less than the Tb of 1.0 °C, which is consistent with a variety of temperate
pasture species (Moot et al., 2000; Monks et al., 2009). Tt is accumulated linearly from Tb until 15 °C at a rate of 0.7 °Cd/°C and then at a rate of 1.0 °Cd/°C until 30 °C.
Masiunas and Carpenter (1984) also showed lucerne Tm of 40 °C. The upper threshold
is not usually required in our temperate environment because Tmean does not exceed To.
The Tt calculation can further be improved by using diurnal temperature rather than Tmean (Jones and Kiniry, 1986). This method calculates Tt at three hourly intervals
Figure removed for copyright compliance
Figure 2.2 Broken-stick threshold model for thermal time (Tt) accumulation at
different mean air temperatures as proposed (Moot et al., 2000).
Analysis of the data presented in Figure 2.1 showed temperature explained 85% of the variation in seasonal growth rate of the irrigated lucerne crop (Figure 2.3). Growth rate increased linearly at a rate of 11 kg DM/day/°C when mean temperature increased from 5 °C to 17 °C. Figure 2.3 also demonstrates Bonhomme (2000) point of the non-linear response of growth at temperatures close to Tb and the limitations of determining Tb
Figure removed for copyright compliance
Figure 2.3 Growth rate in relation to mean air temperature (Tair) for irrigated lucerne
from November 1968 to December 1967 at Lincoln University, Canterbury, New Zealand. (Analysed from data presented in Figure 2.1, adapted from Hoglund et al.
(1974)).
2.3 Interception of solar radiation by the canopy
Solar radiation is intercepted by the leaves which form the canopy. The amount of light intercepted by the canopy (R/Ro) is a function of the size of the canopy, the leaf area
index (LAI; m2 leaf/m2 soil) and the canopy architecture. The canopy architecture is characterised by factors such as; leaf angle, leaf surface properties, thickness, shape and arrangement (Hay and Walker, 1989). The relationship between LAI and R/Ro can be
described using the Beer-Lambert law which describes the exponential reduction of light through the canopy, Equation 2.3;
Equation 2.3 R/Ro = 1-exp(-k*LAI)
Where the extinction coefficient (k) represents the canopy architecture, which is most sensitive to leaf angle, which then regulates the fraction of radiation intercepted by each unit of LAI. Generally, a single extinction coefficient is used to describe the canopy architecture which integrates daily changes in relation to solar elevation (Thornley and Johnson, 2000) and changes in leaf angle throughout the canopy strata. Variation in leaf angle of the lucerne canopy allows more even distribution of light. Keoghan (1982) showed lucerne leaf angle increased from the top to the bottom of the canopy which resulted in increases in k from 0.35 to 1.72, respectively. The author presented a mean k of 0.77 which is consistent with others reported in the literature of 0.70 to 0.93 (Whitfield et al., 1986; Robertson et al., 2002; Varella, 2002; Teixeira et al., 2011; Mattera et al., 2013).
2.3.1 Leaf area index
components of LAI. Teixeira et al. (2007c) reported lucerne grown at Lincoln had an optimum leaf area expansion rate (LAER) of 0.016 m2/m2/°Cd. The LAER was
adjusted to account for seasonal variation as a function of photoperiod (Pp) by a linear decline of 0.0064 m2/m2/°Cd for Pp below 12.5 h, until zero was reached at 10 h (Figure 2.4).
Figure removed for copyright compliance
Figure 2.4 The relationship between leaf area expansion rate (LAER) and photoperiod
(From Teixeira et al. (2009)).
2.3.1.1 Mainstem node appearance
Mainstem node development is the main driver of leaf appearance as it determines the rate of mainstem leaf appearance, which also controls the potential of axillary leaves from the axial buds (Hay and Walker, 1989). The interval between successive mainstem nodes is defined as the phyllochron and quantified using Tt. Brown et al.
Moot, 2004; Brown et al., 2005b; Teixeira et al., 2007c). Irrigated lucerne grown at Lincoln displays a minimum phyllochron of 34 °Cd for Pp ≥ 12.5 h which increases to a maximum of 40 °Cd at Pp of 10.5 h (Figure 2.5). Leaf appearance rates are determined by the rate of cell division and expansion at the stem apex (Hay and Walker, 1989) which is driven by assimilate supply. The pattern of seasonal phyllochron follows that of shoot RUE, both decrease during late summer when crops increase partitioning to below ground organs (Teixeira et al., 2007b), which reduces assimilate supply, and possibly the rate of phyllochron expression. Seedling lucerne, defined as the growth phase from sowing to first defoliation has been reported to have a longer phyllochron of 47 °Cd compared with that of regrowth lucerne (subsequent growth phases following the seedling phase) which is consistent with greater partitioning below ground for these crops (Teixeira et al., 2011). It is unknown if a single phyllochron for seeding lucerne is suitable, regardless of sowing date. This will be investigated in the current research, along with the influence sowing date on DM partitioning of seedling crops.
Figure removed for copyright compliance
derived from branched material, which shows branching is an important contributor towards crop yield. The rate of branching is a development process and can be described in relation to Tt, alternatively branching can be expressed as the relationship between mainstem node number and total node number. For example, Brown et al.
(2005b) showed in irrigated lucerne grown at Lincoln, branching was initiated after the appearance of about the fifth mainstem node. The rate of branching for spring and autumn regrowth cycles was 2.5 secondary nodes per mainstem node compared with 1.7 for the summer cycles. This difference indicated branch development had a different environmental response or rate of response to that of mainstem node appearance. Juan
2.4 DM production and radiation use efficiency (RUE)
DM production is dependent on the efficiency of conversion of solar energy into assimilate and the partitioning of this assimilate into biomass (Equation 2.1). Radiation use efficiency (RUE) is determined by the slope of the relationship between crop DM and accumulated intercepted radiation (Monteith, 1972, 1977; Sinclair and Muchow, 1999). RUE is a measure of net photosynthesis (Pn); gross photosynthesis (Pg) less total
respiration (RT) in relation to intercepted radiation (Ri), at the crop level (Equation 2.4).
Equation 2.4 RUE = Pn = (Pg – RT) / Ri
Photosynthetically active radiation (PAR) occurs within the waveband spectrum of 400 to 700 nm, and is half of the incoming total solar radiation (Monteith, 1972). Solar radiation intensity and duration differs with location and season due to changes in solar angle (Hay and Walker, 1989). Care needs to be taken when defining RUE. RUE can be expressed differently with regard to; DM (total or above ground), band of radiation wavelength (total solar radiation or PAR) and either as intercepted or absorbed radiation. Throughout this research, RUE will be defined by intercepted total solar radiation and reported as shoot RUE (RUEshoot) or total RUE (RUEtotal).
Varella (2002) showed in field grown lucerne in full sunlight the maximum photosynthesis rate (Pmax) was reached at a radiation intensity of ~1000 µmol m-2 s-1,
however 95% Pmax was reached at half this intensity. Solar radiation intensity does not
normally limit crop growth in the field for lucerne, a C3 plant, rather declining
Argentina. The three main factors which influence photosynthesis and therefore RUE are nitrogen, temperature and water stress, the latter two are discussed in more detail.
2.4.1 Effect of temperature on RUE
Brown et al. (2006b) showed a strong linear increase in RUEtotal with mean air
temperature for irrigated lucerne grown at Lincoln from 0.6 g DM/MJ at 6 °C to 1.6 g DM/MJ at 18 °C, an increase in RUEtotal of 0.09 g DM/MJ/°C. They presented a
framework to account for the effect of temperature on seasonal RUEtotal (Figure 2.6).
This relationship was validated for lucerne grown in the same climate, defoliated on a 42 day cycle (RMSD of 0.2 g DM/MJ) by Teixeira et al. (2008) who showed RUEtotal
increased at 0.10 g DM/MJ/°C from 8 to 18°C. Decreases in photosynthesis at temperatures below optimum are associated with a decline in enzyme activity which catalyse reactions in the Calvin cycle (Hay and Walker, 1989). However, Teixeira et al.
(2008) showed a poor relationship (R2 = 0.11) between air temperature and RUEshoot,
because the two components that influence RUEshoot; RUEtotal and fractional partitioning
of DM to the perennial reserves below ground responded separately to temperature.
Figure removed for copyright compliance
Figure 2.6 The relationship between total radiation use efficiency (RUEtotal) of irrigated
lucerne grown at Lincoln University, Canterbury, New Zealand (From Brown et al.
2.4.2 DM partitioning
The carbon allocation strategy of lucerne differs with ontogenetic development which is influenced by environmental factors. During establishment a greater amount of DM is partitioned to the crown and taproot, and shoot growth is compromised. Thiebeau et al.
(2011) showed seedling and regrowth crops used intercepted radiation equally efficiently, however greater partitioning of assimilate below ground reduced shoot growth for seedling crops. Khaiti and Lemaire (1992) reported the fractional partitioning of DM to the root (Proot) for seedling spring sown lucerne in France was
0.65 compared with ~0.2 for the following regrowth cycle. Higher partitioning in seedling crops is linked with slower canopy development rates relative to regrowth lucerne and maximum LAI expansion rates for these crops reported by Teixeira et al.
(2011) of 0.009 m2/m2/°Cd, half the rate of regrowth lucerne.
Teixeira et al. (2008) reported root DM of regrowth lucerne ranged between 3.5 and 5.5 t DM/ha throughout the growth season, independent of defoliation management. The allocation of DM throughout the season for lucerne grown at Lincoln was described in relation to Pp (Figure 2.7a). During winter and early spring, when daylength is short (<10 h), crops remobilised reserves from the crown and taproot and Proot was close to
zero. As Pp lengthened, Proot increased linearly at a rate of 0.08/h up to Pp of 16.5 h
where Proot was 0.5, and constant for the remainder of the season. Teixeira et al.
(2007c) observed a strong positive correlation (R2 = 0.76) between the nitrogen content of root DM and LAER during the early spring period and reported LAER increased ~30% when the nitrogen pool increased from 20 to 60 kg N/ha. Teixeira et al. (2008) used the relationship between soil and air temperature ratio (Tsoil/Tair) and Proot which