www.nat-hazards-earth-syst-sci.net/10/1913/2010/ doi:10.5194/nhess-10-1913-2010
© Author(s) 2010. CC Attribution 3.0 License.
and Earth
System Sciences
The cold frontal depression that affected the area of Cyprus between
28 and 29 January 2008
K. Nicolaides, A. Orphanou, K. Savvidou, S. Michaelides, and M. Tsitouri
Meteorological Service, Nicosia, Cyprus
Received: 16 June 2009 – Revised: 14 June 2010 – Accepted: 26 August 2010 – Published: 15 September 2010
Abstract. The baroclinic depression that affected the area of
Cyprus during the cold period, between 28 and 29 January 2008 was thoroughly studied and is presented in the present paper. A small perturbation on a northwesterly flow to the north of Cyprus has initiated the generation of the depression and in 24 h this developed into a deep baroclinic system. This depression was associated with intense weather phenomena, such as heavy thunderstorms with hail and near gale force winds. Strong cold advection resulted in a significant tem-perature decrease; precipitation even in lower altitudes was in the form of snow, while the accumulated rainfall corre-sponded to the 25% of the monthly normal. January 2008 is considered as a dry month, despite the fact that, on the aver-age, January is considered as the wettest month of the year. In this study, the evolution and development of the depres-sion was investigated from synoptic, dynamic, energetic and thermodynamic perspectives, in order to enhance our knowl-edge on the life cycle and behaviour of similar depressions over the area with extreme characteristics.
1 Introduction
The climatic characteristics of the area of the eastern Mediterranean are related to the medium and upper tropo-spheric circulation (Radinovic, 1987; Jacobeit, 1987); the prevailing westerly air flow is a result of the combination of the zone of subtropical highs to the south and the mid-latitude zone of frequent passage of lows, just to the north. During the winter, the area of the eastern Mediterranean is under the influence of the southwestern edge of the Siberian anticyclone resulting in the observed relatively high surface pressure fields. The area is also affected by depressions
Correspondence to: K. Nicolaides ([email protected])
with intense baroclinic characteristics (El-Fandy, 1946; Kal-los and Metaxas, 1980; Maheras et al., 2002). These de-pressions invade the area mostly from the west, while only a small number of them approach from the north direction (Michaelides et al., 2004; Nicolaides et al., 2004; Nicolaides, 2005). The present study refers to the investigation of the synoptic, dynamic, thermodynamic and energetic character-istics of the cold frontal depression which entered into the eastern Mediterranean from the north and affected the area of Cyprus during the period from the 28 to 29 January 2008. It has long been realized, but only recently documented, that the area of Cyprus is considered as a region with rela-tively frequent cyclogenesis (Maheras et al., 2001). The con-tribution of various cyclogenetic factors in the Mediterranean basin has been emphasized by several researchers; primary of such factors is the orographic forcing (Tafferner and Egger, 1990; Stein and Alpert, 1993). During the winter, in the east-ern Mediterranean, the relatively warmer sea acts as a source of moisture and latent and sensible heat, as shown by Shay-El and Alpert (1991) and Stein and Alpert (1993). Cyprus’ area has been recognized as the second most favorable region for cyclogenesis in the Mediterranean, after Genoa’s Gulf.
2 Data and methodology
In order to study the characteristics of the system in a spatial and temporal context, several dynamic, energetic and ther-modynamic parameters were calculated for selected isobaric layers, for the period extending from 26 until 30 January 2008.
The studied dynamic parameters were the relative vortic-ity, the divergence of the horizontal wind vector; the verti-cal motion and the static instability (Nicolaides et al., 2004 for a comprehensive mathematical presentation). For the energetic study, the zonal components of the available po-tential and kinetic energies (ZAPE and ZKE, respectively), their eddy counterparts (EAPE and EKE, respectively), their conversions and boundary transfers were calculated (see Michaelides 1987 and 1992 for a thorough mathematical for-mulation and physical interpretation of the energetic compo-nents). For the needs of the thermodynamic analysis, sev-eral thermodynamic indices were examined, using local ra-diosonde data, namely those from Athalassa rara-diosonde sta-tion (35◦090N, 33◦240E), located in the centre of the is-land. Radiosonde data are available only at 06:00 UTC and 12:00 UTC and these were used in order to reveal a pos-sible temporal evolution of these indices. The definition and interpretation of the various thermodynamic parameters can be found online (http://www.crh.noaa.gov/lmk/soo/docu/ indices.php). The data used for the required mathematical calculations were deduced from the NCEP/NCAR global re-analyses for 00:00 UTC, with a grid dimension of 2.5◦×2.5◦; the area of the calculations is bounded by meridians 20◦W and 50◦E and parallel circles 20◦N and 65◦N. The resolu-tion resulting from the grid distance is considered to be ad-equate for the synoptic-scale analysis carried out here; data at finer resolutions could be used, but they would not alter the basic characteristics of the distributions of the dynamic parameters at the scale considered. For the synoptic investi-gation, surface and upper air charts and surface observations from the archives of Cyprus Meteorological Service were also used, together with satellite images at different wave-lengths.
3 Results
3.1 Synoptic study
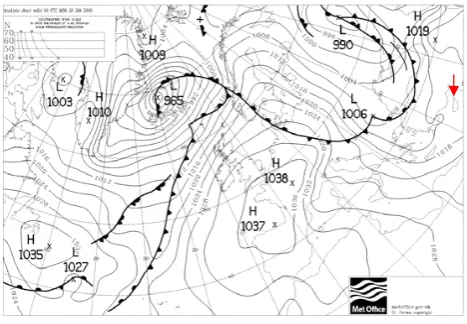
At 00:00 UTC 28 January 2008, an extensive barometric low was affecting the eastern Europe, with Cyprus lying on its southern edge, having a mean sea level pressure (MSLP) value of 1014 hPa (Fig. 1). The predominant airflow over Cyprus was from the west. A significant change was noted 24 h later (00:00 UTC 29 January 2008), when a deep and well marked barometric low formed in the eastern Mediter-ranean, being cut-off from the pre-existing broader cyclonic circulation (Fig. 2). The depression was covering the north
Fig. 1. Surface analysis chart for 0000 UTC 28 January 2008 (U.K., Met. Office). The red arrow points to Cyprus area
Fig. 2. Surface analysis chart for 0000 UTC 29 January 2008 (U.K., Met. Office). The red arrow points to Cyprus area.
Fig. 1. Surface analysis chart for 00:00 UTC 28 January 2008 (UK,
Met. Office). The red arrow points to Cyprus area.
Fig. 1. Surface analysis chart for 0000 UTC 28 January 2008 (U.K., Met. Office). The red arrow points to Cyprus area
Fig. 2. Surface analysis chart for 0000 UTC 29 January 2008 (U.K., Met. Office). The red arrow points to Cyprus area.
Fig. 2. Surface analysis chart for 00:00 UTC 29 January 2008 (UK,
Met. Office). The red arrow points to Cyprus area.
part of the eastern Mediterranean basin and its lowest pres-sure was 998 hPa, just to the west of the island of Cyprus. This depression progressed eastwards and filled in the fol-lowing 24 h period, while all associated phenomena ceased by 00:00 UTC 31 January.
-10 0 10 20 30 40 50 Longitude
30 40 50 60
La
ti
tu
d
e
-20 -10 0 10 20 30 40 50
20 30 40 50 60
(a)
-10 0 10 20 30 40 50
Longitude 30
40 50 60
Lat
it
ude
-20 -10 0 10 20 30 40 50
20 30 40 50 60
(b)
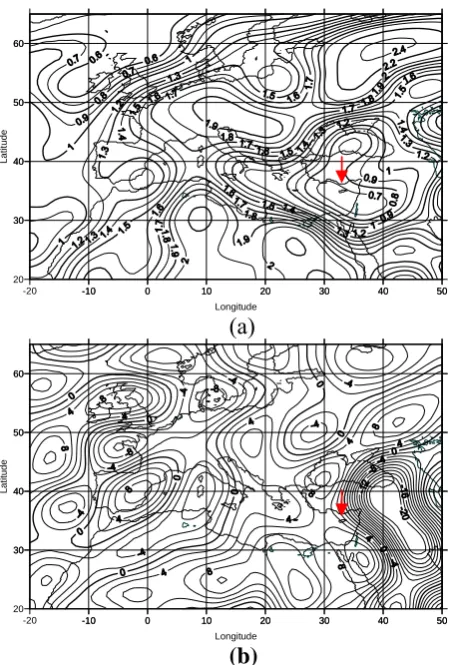
Fig. 3.
(a) Static stability index (unit: K
2s
-1); (b) Divergence of the horizontal wind vector (unit: x10
-6s
-1)
at the isobaric layer of 850hPa, at 0000UTC 27 January 2008. The red arrow point to Cyprus area.
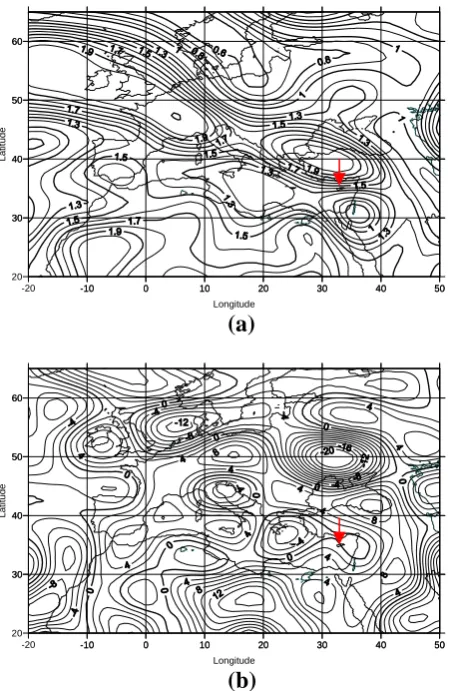
Fig. 3. (a) Static stability index (unit: K2s−1); (b) Divergence of the horizontal wind vector (unit:×10−6s−1) at the isobaric layer of 850 hPa, at 00:00 UTC 27 January 2008. The red arrow point to Cyprus area.
was noted again at 06:00 UTC and lasted until 13:00 UTC 29 January. A northerly surface flow was established as from 11:00 UTC 29 January 2008, while the cloud bands began to move away or clear by 20:00 UTC.
3.2 Dynamic study
3.2.1 27 January 2008
At the lower troposphere, as represented by the isobaric level of 850 hPa, stable air (see Fig. 3, where high values of static stability index denote stable air, whereas lower values de-note less stable air) covered the area of the Black Sea and Asia Minor (the static stability index obtains values of more than 2.0 K2s−1), extending into the central and western Eu-rope, while the areas of the Mediterranean and the Near East were covered with lower values (static stability values less than 1.2 K2s−1over central Mediterranean and less than 0.8 K2s−1over the area of the Near East), as the lower
tro-pospheric air is relatively unstable in these latter areas (note that in late January the land is generally colder than the sea over the area).
From the distribution of the divergence of the horizontal wind vector at 850 hPa, as presented in Fig. 3, enhanced con-vergence (negative values denote concon-vergence and positive values divergence) was noted just to the north of the Black Sea (less than−20×10−6s−1), while much weaker lower tropospheric convergence was observed over the Mediter-ranean. From the distribution of the divergence of the hor-izontal wind vector over the upper troposphere (as calculated at the 300 hPa isobaric level, but not presented), strong diver-gence (more than 20×10−6s−1)was found just to the north of the Black Sea, which, coupled with the lower tropospheric convergence over the same area, enhanced strong ascending motions and subsequent cloud formation.
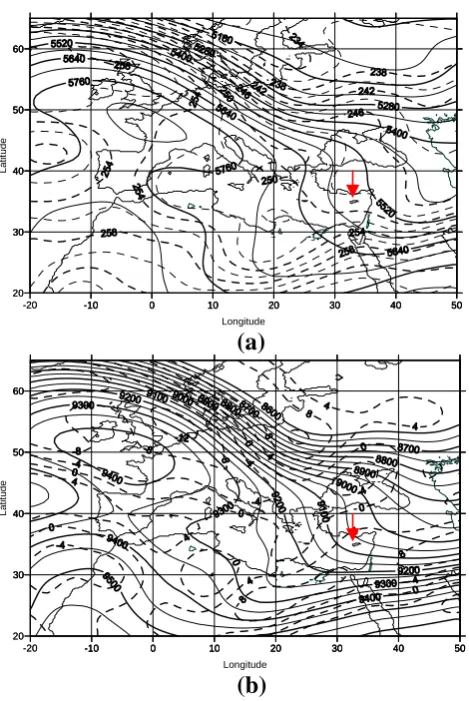
At 00:00 UTC 27 January, in the middle and upper tropo-sphere (500 and 300 hPa, respectively), a weak upper trough had just passed over Cyprus, leaving the area under the in-fluence of a northwesterly upper flow. In the middle tropo-sphere (Fig. 4), a minor trough was noted, extending from 48◦N to 55◦N and 20◦E to 28◦E. This trough was ahead of a strong northwesterly jet stream, extending from the north of the British Isles towards the northwest of the Black Sea (see Fig. 4). Also, the distribution of the field of relative vor-ticity over the upper troposphere (see Fig. 4) exhibited posi-tive values (denoting cyclonic behaviour at the upper tropo-sphere) over the eastern Mediterranean, suggesting enhanced upward motions of air. On the contrary, the western Europe lied in an area of negative relative vorticity values, which denotes anticyclonic behaviour of the atmosphere (Fig. 4). The spot value over the island of Cyprus is 5×10⁻⁵s−1, while the area of maximum relative vorticity values (exceed-ing 8×10⁻⁵s−1)was found over Egypt, just ahead of the minor upper trough.
3.2.2 28 January 2008
Figure 5 displays the existence of significant lower tropo-spheric instability, covering the area of the Black Sea, Asia Minor, and the Aegean Sea at 00:00 UTC 28 January; at this time, the static stability index over the Black Sea was less than 0.7 K2s−1and over Cyprus was around 1 K2s−1. Also, at this time, lower tropospheric convergence took place over Asia Minor and the Aegean which, in association with the divergence of the horizontal wind vector of the upper tro-posphere (calculated but not presented), denotes ascending motion and cloud formation.
-10 0 10 20 30 40 50 Longitude
30 40 50 60
La
ti
tu
d
e
-20 -10 0 10 20 30 40 50
20 30 40 50 60
-20 -10 0 10 20 30 40 50
20 30 40 50 60
(a)
-10 0 10 20 30 40 50
Longitude 30
40 50 60
L
a
tit
ude
-20 -10 0 10 20 30 40 50
20 30 40 50 60
-20 -10 0 10 20 30 40 50
20 30 40 50 60
(b)
Fig. 4.
(a) Geopotential height (solid lines, unit: gpm) and temperature (dashed lines, unit: K) at the
isobaric level of 500hPa (a); (b) geopotential height (solid lines, unit: gpm) and relative vorticity (dashed
lines, unit: x10
-5s
-1) at the isobaric level of 300hPa, at 0000 UTC 27 January 2008. The red arrow point to
Cyprus area.
Fig. 4. (a) Geopotential height (solid lines, unit: gpm) and
tem-perature (dashed lines, unit: K) at the isobaric level of 500 hPa (a);
(b) geopotential height (solid lines, unit: gpm) and relative vorticity
(dashed lines, unit:×10−5s−1) at the isobaric level of 300 hPa, at 00:00 UTC 27 January 2008. The red arrow point to Cyprus area.
relative vorticity values at the upper troposphere covered central and west Europe, as a result of the anticyclonic jet stream’s curvature; the areas of the eastern Mediterranean and Egypt were characterized by positive relative vorticity values, ahead of the upper trough (see Fig. 6). As a result of the middle and upper tropospheric driving mechanisms, significant changes took place within the lower troposphere.
3.2.3 29 January 2008
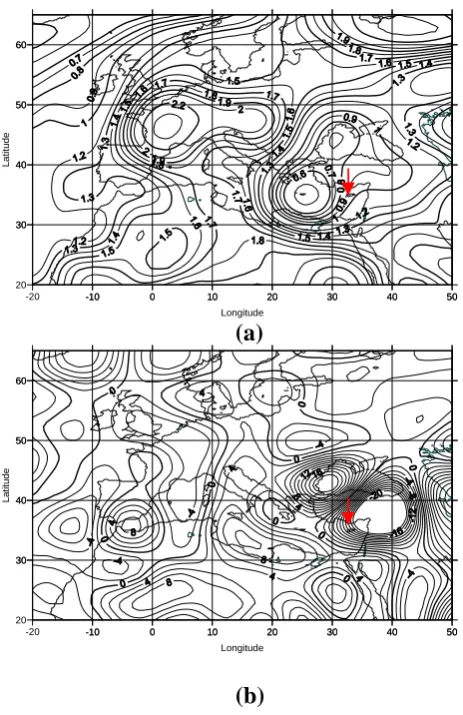
At 00:00 UTC 29 January, low values of static stability in-dex were located over the areas of the Aegean and the east-ern Mediterranean, representing a remarkable instability at the lower tropospheric layers (see Fig. 7). From the distri-bution of divergence, an area of lower tropospheric conver-gence covering the eastern Mediterranean, north Syria and east Asia Minor was formed which, in association with the
-10 0 10 20 30 40 50
Longitude 30
40 50 60
La
tit
ude
-20 -10 0 10 20 30 40 50
20 30 40 50 60
(a)
-10 0 10 20 30 40 50
Longitude 30
40 50 60
La
tit
ude
-20 -10 0 10 20 30 40 50
20 30 40 50 60
(b)
Fig. 5.
As Fig. 3, but for 0000UTC 28 January 2008.
Fig. 5. As Fig. 3, but for 00:00 UTC 28 January 2008.
upper tropospheric divergence (300 hPa divergence) over the same area (calculated but not presented) denotes enhanced ascending motion and cloud formation. The infra-red satel-lite image of Fig. 8 displays the extensive cloud formations covering the eastern Mediterranean area corresponding to this time.
(a)
-10 0 10 20 30 40 50 Longitude
30 40 50 60
Lat
it
u
d
e
-20 -10 0 10 20 30 40 50 20
30 40 50 60
-20 -10 0 10 20 30 40 50 20
30 40 50 60
(b)
Fig. 6.
As Fig. 4, but for 0000 UTC 28 January 2008.
-10 0 10 20 30 40 50 Longitude
30 40 50 60
L
a t i tu
d e
-20 -10 0 10 20 30 40 50 20
30 40 50 60
-20 -10 0 10 20 30 40 50 20
30 40 50 60
Fig. 6. As Fig. 4, but for 00:00 UTC 28 January 2008.
is worth mentioning that the shear of the advancing upper trough was the driving mechanism for the development at the upper levels.
3.2.4 30 January 2008
At 00:00 UTC 30 January, the last day in the present analysis, the area of the central and eastern Mediterranean was char-acterised by lower tropospheric instability (Fig. 10), while stable air was found over the Balkans. From the distribution of the divergence of the horizontal wind vector over the lower troposphere (Fig. 10) the area of convergence was located at the time eastwards, namely, over east of Asia Minor. The associated cloud bands have subsequently progressed east-wards.
At this time, although the trough has relaxed (Fig. 11), its axis remained over Cyprus and a slight further decrease in the geopotential heights was noted in the middle troposphere (5380 gpm). At the upper troposphere, the trough was giving signs of relaxation, while moving eastwards. The relative vorticity over the area of Cyprus was preserved, while the geopotential height exhibited a further fall (spot value over Cyprus: 8950 gpm; see Fig. 11).
-10 0 10 20 30 40 50
Longitude 30
40 50 60
La
tit
ude
-20 -10 0 10 20 30 40 50
20 30 40 50 60
(a)
-10 0 10 20 30 40 50
Longitude 30
40 50 60
Lat
it
ude
-20 -10 0 10 20 30 40 50
20 30 40 50 60
(b)
Fig. 7.
As Fig. 3, but for 0000 UTC 29 January 2008.
Fig. 7. As Fig. 3, but for 00:00 UTC 29 January 2008.
3.3 Thermodynamic study
Fig. 8. Meteosat infra-red image (MSG-2, 10.8μm) for 0000 UTC 29 January 2008. Copyright © 2010 EUMETSAT.
Fig. 8. Meteosat infra-red image (MSG-2, 10.8 µm) for 00:00 UTC
29 January 2008. Copyright 2010 EUMETSAT.
-10 0 10 20 30 40 50
Longitude 30
40 50 60
Lat
it
ude
-20 -10 0 10 20 30 40 50
20 30 40 50 60
-20 -10 0 10 20 30 40 50
20 30 40 50 60
(a)
-10 0 10 20 30 40 50
Longitude 30
40 50 60
La
tit
ude
-20 -10 0 10 20 30 40 50
20 30 40 50 60
-20 -10 0 10 20 30 40 50
20 30 40 50 60
(b)
Fig. 9.
As Fig. 4, but for 0000 UTC 29 January2008.
Fig. 9. As Fig. 4, but for 00:00 UTC 29 January 2008.
From the calculation of several thermodynamic in-dices/parameters which are considered in the literature to be associated with convective and/or severe weather, it did not
-10 0 10 20 30 40 50
Longitude 30
40 50 60
La
tit
ude
-20 -10 0 10 20 30 40 50
20 30 40 50 60
(a)
-10 0 10 20 30 40 50
Longitude 30
40 50 60
Lat
it
ude
-20 -10 0 10 20 30 40 50
20 30 40 50 60
(b)
Fig. 10.
As Fig. 3, but for 0000 UTC 30 January 2008.
Fig. 10. As Fig. 3, but for 00:00 UTC 30 January 2008.
Table 1. Thermodynamic indices calculated for Athalassa radiosonde station during the study period, for 06:00 and 12:00 UTC. Based on
literature, numbers in red indicate strong probability and numbers in green moderate probability for thundery activity.
Date 27 Jan 2008 28 Jan 2008 29 Jan 2008 30 Jan 2008 Time
(UTC) 06:00 12:00 06:00 12:00 06:00 12:00 06:00 12:00
SWEAT 33 32 184.4 147 196 144 72 74
KO 9.3 1.7 7.2 −0.7 0 0 5.8 4.9
K 9.1 – 8.5 20.1 27 18.4 61 6.5
TT 43.4 44.2 50 50 55 54.3 41.6 42
LI 10.4 5.1 9.7 1.3 2.3 2.2 9.5 6.8
WBZ 2127 3748 3900 5202 3545 2679 808 344
SRH 19 52 207 133 94 110 – 21
BRNsh 1.6 11.7 10.7 63.9 14.1 74.1 4.6 58.6
LFC – – – 813 1744 920 1839 798
-10 0 10 20 30 40 50
Longitude 30
40 50 60
L
a
tit
ude
-20 -10 0 10 20 30 40 50
20 30 40 50 60
-20 -10 0 10 20 30 40 50
20 30 40 50 60
(a)
-10 0 10 20 30 40 50
Longitude 30
40 50 60
La
tit
ude
-20 -10 0 10 20 30 40 50
20 30 40 50 60
-20 -10 0 10 20 30 40 50
20 30 40 50 60
(b)
Fig. 11.
As Fig. 4, but for 0000 UTC 30 January2008.
Fig. 11. As Fig. 4, but for 00:00 UTC 30 January 2008.
thresholds by Savvidou et al. (2009) for the area of Cyprus, it can be deduced that the TT index suggested potentially ex-treme thunderstorm events on 29 of January, while the value on the 28 January exceeded the winter observed threshold
(49.8◦C). The LI index resulted in less indicative results,
without suggesting thunderstorm potential, compared to the TT index. This can be attributed to the fact that the LI In-dex does not take into account the moisture content at the lower levels. This additional information which is taken into account for the calculation of the TT Index increases its values and consequently can be considered as more effec-tively marking the thunderstorm potential. The Storm Rela-tive Helicity (SRH) reached notably high values on 28 and 29 January, exceeding the suggested thresholds for poten-tially extreme thunderstorm events (74 JKg-1). Similarly, as presented in Table 1, the BRNsh values observed on the 28, 29 and 30 January signify the potential for extreme thunder-storm events to occur (threshold suggested by Savvidou et al. (2009): 43.3 Jkg-1).
Selected tephigrams for Athalassa radiosonde station are presented in Fig. 12. At 06:00 UTC 28 January, the respec-tive tephigram supports the presence of scattered to broken layer cloud between 4000 m and 7000 m. At 12:00 UTC 28 January, increased amounts of both cumuliform and strat-iform cloud with lower bases are supported by the tropo-sphere’s vertical profile, with a significant layer of medium cloud between 3500 m and 7000 m. Thick cloud layers with the lowest bases at 100 m and extending up to 5500m are sus-tained at 06:00 UTC 29 January. Broken to overcast sky con-dition is demonstrated on the 06:00 UTC 29 January tephi-gram, with cloud formations between 100 m and 5500 m. Fi-nally, at 12:00 UTC 29 January, overcast conditions contin-ued to affect the area, but with much lower vertical extent: from 1000 m top 2500 m; at the same time, the amount of medium cloud was decreased.
3.4 Energetic study
Fig.12. Selected tephigrams for Athalassa radiosonde station. The release time 0500UTC or
1100UTC is indicated corresponding to the 0600UTC and 1200UTC synoptic times,
respectively. The scale on the right is in km (left part) and 1000’s of feet (right part).
Fig. 12. Selected tephigrams for Athalassa radiosonde station. The release time 05:00 UTC or 11:00 UTC is indicated corresponding to the
0600UTC and 1200UTC synoptic times, respectively. The scale on the right is in km (left part) and 1000s of feet (right part).
level; hence, this area is not fixed in time but moves along with the system’s spatial evolution. A similar approach was adopted by Michaelides et al. (1999). Table 2 displays the longitudinal and latitudinal lateral boundaries of the area which surrounds the system. In the vertical, ten standard levels were used, namely 1000, 850, 700, 500, 400, 300, 250, 200, 150 and 100 hPa. This quasi-Lagrangian approach is adopted so that the energetics calculations focus more on the individual synoptic system and therefore these reflect its characteristics, to a large extent.
The main forms of atmospheric energy within a system are the zonal available potential energy (ZAPE), eddy avail-able potential energy (EAPE), zonal kinetic energy (ZKE) and eddy kinetic energy (EKE) (Michaelides, 1987, 1992). These forms of energy were calculated for the open area surrounding the depression, as explained above. The con-versions from one form of energy to another were also cal-culated; the most significant ones are the conversions from ZAPE to EAPE, from EAPE to EKE, from EKE to ZKE and from ZAPE to ZKE.
Due to the fact that an open weather system is not isolated and adiabatic from its surroundings, energy can enter or exit the system through its boundaries, in such a way that the sys-tem is either supplied with energy or energy is extracted from
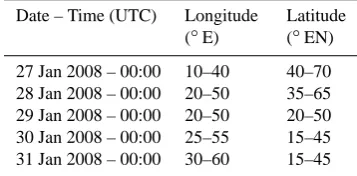
Table 2. Horizontal boundaries of the area that was used for the
energetic calculations.
Date – Time (UTC) Longitude Latitude (◦E) (◦EN)
27 Jan 2008 – 00:00 10–40 40–70 28 Jan 2008 – 00:00 20–50 35–65 29 Jan 2008 – 00:00 20–50 20–50 30 Jan 2008 – 00:00 25–55 15–45 31 Jan 2008 – 00:00 30–60 15–45
it. The transfer of the four forms of energy to or from the sys-tem’s boundaries was also studied.
The calculations of all the aforementioned energetic com-ponents were performed for 00:00 UTC on 27 to 31 January 2008. 29 January is considered to be “Day 0” denoted by D0; similarly, D-2, D-1, D+1 and D+2 refer to the 27, 28, 30 and 31 January 2008, respectively.
(a)
Zonal Available Potential Energy (ZAPE) 0 100 200 300 400 500 600 700 800 900 1000
0 1 2 3 4 5 6 7 8 9
ZAPE (10^5 J.m ^-2)
Is oba ri c La y e r ( h P a )
D-2 D-1 D0 D+1 D+2
Eddie Available Potential Energy (EAPE) 0 100 200 300 400 500 600 700 800 900 1000
0 0.5 1 1.5 2 2.5 3 3.5 4 4.5 5 5.5 6
EAPE (10^5 J.m ^-2))
Is oba ri c La y e r (hP a )
D-2 D-1 D0 D+1 D+2
(a)
(b)
Zonal Kinetic Energy (ZKE) 0 100 200 300 400 500 600 700 800 900 1000
0 1 2 3 4 5 6 7 8 9
ZKE (10^5 J.m ^-2)
Is oba ri c La y e r (h P a )
D-2 D-1 D0 D+1 D+2
Eddie Kinetic Energy (EKE) 0 100 200 300 400 500 600 700 800 900 1000
0 1 2 3 4 5 6 7 8 9
EKE (10^5 J.m ^-2)
Is o b ar ic L a ye r (h P a )
D-2 D-1 D0 D+1 D+2
© (d)
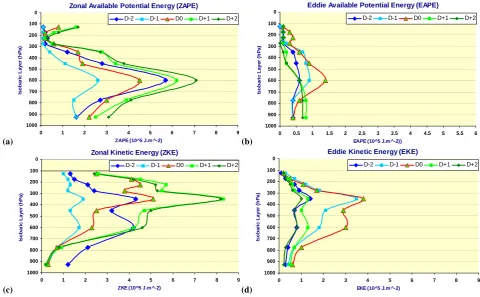
Fig. 13. Vertical distribution of (a) ZAPE, (b) EAPE, (c) ZKE, and (d) EKE on 27 (D-2), 28 (D-1), 29
(D0), 30 (D+1) and 31 January 2008 (D+2).
(b)
Zonal Available Potential Energy (ZAPE) 0 100 200 300 400 500 600 700 800 900 1000
0 1 2 3 4 5 6 7 8 9
ZAPE (10^5 J.m ^-2)
Is oba ri c La y e r ( h P a )
D-2 D-1 D0 D+1 D+2
Eddie Available Potential Energy (EAPE) 0 100 200 300 400 500 600 700 800 900 1000
0 0.5 1 1.5 2 2.5 3 3.5 4 4.5 5 5.5 6
EAPE (10^5 J.m ^-2))
Is oba ri c La y e r (hP a )
D-2 D-1 D0 D+1 D+2
(a)
(b)
Zonal Kinetic Energy (ZKE) 0 100 200 300 400 500 600 700 800 900 1000
0 1 2 3 4 5 6 7 8 9
ZKE (10^5 J.m ^-2)
Is oba ri c La y e r (h P a )
D-2 D-1 D0 D+1 D+2
Eddie Kinetic Energy (EKE) 0 100 200 300 400 500 600 700 800 900 1000
0 1 2 3 4 5 6 7 8 9
EKE (10^5 J.m ^-2)
Is o b ar ic L a ye r (h P a )
D-2 D-1 D0 D+1 D+2
© (d)
Fig. 13. Vertical distribution of (a) ZAPE, (b) EAPE, (c) ZKE, and (d) EKE on 27 (D-2), 28 (D-1), 29
(D0), 30 (D+1) and 31 January 2008 (D+2).
(c) 0 100 200 300 400 500 600 700 800 900 1000
0 1 2 3 4 5 6 7 8 9
ZAPE (10^5 J.m ^-2)
Is oba ri c La y e r ( h P a )
D-2 D-1 D0 D+1 D+2
100 200 300 400 500 600 700 800 900 1000
0 0.5 1 1.5 2 2.5 3 3.5 4 4.5 5 5.5 6
EAPE (10^5 J.m ^-2))
Is oba ri c La y e r (hP a )
D-2 D-1 D0 D+1 D+2
(a)
(b)
Zonal Kinetic Energy (ZKE) 0 100 200 300 400 500 600 700 800 900 1000
0 1 2 3 4 5 6 7 8 9
ZKE (10^5 J.m ^-2)
Is oba ri c La y e r (h P a )
D-2 D-1 D0 D+1 D+2
Eddie Kinetic Energy (EKE) 0 100 200 300 400 500 600 700 800 900 1000
0 1 2 3 4 5 6 7 8 9
EKE (10^5 J.m ^-2)
Is o b ar ic L a ye r (h P a )
D-2 D-1 D0 D+1 D+2
© (d)
Fig. 13. Vertical distribution of (a) ZAPE, (b) EAPE, (c) ZKE, and (d) EKE on 27 (D-2), 28 (D-1), 29
(D0), 30 (D+1) and 31 January 2008 (D+2).
(d) 100 200 300 400 500 600 700 800 900 1000
0 1 2 3 4 5 6 7 8 9
ZAPE (10^5 J.m ^-2)
Is oba ri c La y e r ( h P a )
D-2 D-1 D0 D+1 D+2
100 200 300 400 500 600 700 800 900 1000
0 0.5 1 1.5 2 2.5 3 3.5 4 4.5 5 5.5 6
EAPE (10^5 J.m ^-2))
Is oba ri c La y e r (hP a )
D-2 D-1 D0 D+1 D+2
(a)
(b)
Zonal Kinetic Energy (ZKE) 0 100 200 300 400 500 600 700 800 900 1000
0 1 2 3 4 5 6 7 8 9
ZKE (10^5 J.m ^-2)
Is oba ri c La y e r (h P a )
D-2 D-1 D0 D+1 D+2
Eddie Kinetic Energy (EKE) 0 100 200 300 400 500 600 700 800 900 1000
0 1 2 3 4 5 6 7 8 9
EKE (10^5 J.m ^-2)
Is o b ar ic L a ye r (h P a )
D-2 D-1 D0 D+1 D+2
© (d)
Fig. 13.
Vertical distribution of (a) ZAPE, (b) EAPE, (c) ZKE, and (d) EKE on 27 (D-2), 28 (D-1), 29
(D0), 30 (D+1) and 31 January 2008 (D+2).
Fig. 13. Vertical distribution of (a) ZAPE, (b) EAPE, (c) ZKE, and (d) EKE on 27 (D-2), 28 (D-1), 29 (D0), 30 (D+1) and 31 January 2008
(D+2).
layers was reflected in the very low values within these layers. On the contrary, ZKE obtained its maximum values at the jet stream level. The larger values of ZAPE were cal-culated after the passage of the depression, D+1 and D+2, while relatively high ZAPE was also found on D-2, but still lower than the ZAPE after the depression’s passage. Similar results were found for ZKE; only on 28 January, the values were relatively lower. This can possibly be attributed to the fact that ZKE has been converted to EKE (see discussion be-low).
The approach of the depression was related to a gradual increase of the values of the eddy energies, while when it moved away, the opposite happened: EAPE and EKE noted a gradual increase from 27 until 29 and a decrease thereafter. The conversions from one type of energy to another within the system are presented in Fig. 14. Note that the scale of
x-axis is different on each graph for better representation. It appears that the most significant conversion (in terms of absolute values) was the one from ZAPE to EAPE, within most of the tropospheric layers. The maxima were noted in the middle and upper troposphere, except on D+1. It is worth mentioning that at D-1 and D+1 and at the lowest levels at D-2, EAPE was converted to ZAPE (negative values on the graph).
The conversion of EAPE to EKE was close to zero, al-though small amounts of EAPE were converted to EKE. Nev-ertheless, on the two days of the main interest, namely, 28 and 29 January, some amounts of EKE were converted to EAPE in the layer between 500 hPa and 300 hPa.
Concerning the conversion of ZKE to EKE, a net conver-sion is noted throughout the troposphere, especially on the two days of main interest; this is more pronounced at the level of 350 hPa. Smaller amounts of energy conversions were found after the depression’s passage, while at D-2, EKE was converted to ZKE. The latter conversion could be re-lated to the first weak trough preceding the studied depres-sion, which was still affecting Cyprus.
The conversion of ZKE to ZAPE was well-defined, mainly over the middle and upper tropospheric layers during D0, D+1 and D+2, while on D-1 and D-2 an inverse conversion was found.
(a)
Conversion of EAPE to EKE 0 100 200 300 400 500 600 700 800 900 1000
-4 -3 -2 -1 0 1 2 3 4
EAPE-EKE (W.m ^-2)
Is o b a ric L a y e r ( h P a )
D-2 D-1 D0 D+1 D+2
(a)
(b)
Conversion of ZKE to EKE 0 100 200 300 400 500 600 700 800 900 1000
-4 -3 -2 -1 0 1 2 3 4 5 6 7 8 9 10 11
ZKE-EKE (W.m ^-2)
Is o b a ric L a ye r (h P a )
D-2 D-1 D0 D+1 D+2
Conversion of ZAPE to ZKE 0 100 200 300 400 500 600 700 800 900 1000
-8 -6 -4 -2 0 2 4 6 8
ZAPE-ZKE (W.m ^-2)
Is o b a ric L a y e r ( h P a )
D-2 D-1 D0 D+1 D+2
© (d)
Fig. 14.
Energy conversions of (a) ZAPE to EAPE, (b) EAPE to EKE, (c) ZKE to EKE, and (d) ZAPE to
ZKE (d) on 27 (D-2), 28 (D-1), 29 (D0), 30 (D+1) and 31 January 2008 (D+2).
(b)
Conversion of EAPE to EKE 0 100 200 300 400 500 600 700 800 900 1000
-4 -3 -2 -1 0 1 2 3 4
EAPE-EKE (W.m ^-2)
Is o b a ric L a y e r ( h P a )
D-2 D-1 D0 D+1 D+2
(a)
(b)
Conversion of ZKE to EKE 0 100 200 300 400 500 600 700 800 900 1000
-4 -3 -2 -1 0 1 2 3 4 5 6 7 8 9 10 11
ZKE-EKE (W.m ^-2)
Is o b a ric L a ye r (h P a )
D-2 D-1 D0 D+1 D+2
Conversion of ZAPE to ZKE 0 100 200 300 400 500 600 700 800 900 1000
-8 -6 -4 -2 0 2 4 6 8
ZAPE-ZKE (W.m ^-2)
Is o b a ric L a y e r ( h P a )
D-2 D-1 D0 D+1 D+2
© (d)
Fig. 14. Energy conversions of (a) ZAPE to EAPE, (b) EAPE to EKE, (c) ZKE to EKE, and (d) ZAPE to
ZKE (d) on 27 (D-2), 28 (D-1), 29 (D0), 30 (D+1) and 31 January 2008 (D+2).
(c) 200 300 400 500 600 700 800 900 1000
-4 -3 -2 -1 0 1 2 3 4
EAPE-EKE (W.m ^-2)
Is o b a ric L a y e r ( h P a )
(a)
(b)
Conversion of ZKE to EKE 0 100 200 300 400 500 600 700 800 900 1000
-4 -3 -2 -1 0 1 2 3 4 5 6 7 8 9 10 11
ZKE-EKE (W.m ^-2)
Is o b a ric L a ye r (h P a )
D-2 D-1 D0 D+1 D+2
Conversion of ZAPE to ZKE 0 100 200 300 400 500 600 700 800 900 1000
-8 -6 -4 -2 0 2 4 6 8
ZAPE-ZKE (W.m ^-2)
Is o b a ric L a y e r ( h P a )
D-2 D-1 D0 D+1 D+2
© (d)
Fig. 14. Energy conversions of (a) ZAPE to EAPE, (b) EAPE to EKE, (c) ZKE to EKE, and (d) ZAPE to
ZKE (d) on 27 (D-2), 28 (D-1), 29 (D0), 30 (D+1) and 31 January 2008 (D+2).
(d) 200 300 400 500 600 700 800 900 1000
-4 -3 -2 -1 0 1 2 3 4
EAPE-EKE (W.m ^-2)
Is o b a ric L a y e r ( h P a )
(a)
(b)
Conversion of ZKE to EKE 0 100 200 300 400 500 600 700 800 900 1000
-4 -3 -2 -1 0 1 2 3 4 5 6 7 8 9 10 11
ZKE-EKE (W.m ^-2)
Is o b a ric L a ye r (h P a )
D-2 D-1 D0 D+1 D+2
Conversion of ZAPE to ZKE 0 100 200 300 400 500 600 700 800 900 1000
-8 -6 -4 -2 0 2 4 6 8
ZAPE-ZKE (W.m ^-2)
Is o b a ric L a y e r ( h P a )
D-2 D-1 D0 D+1 D+2
© (d)
Fig. 14.
Energy conversions of (a) ZAPE to EAPE, (b) EAPE to EKE, (c) ZKE to EKE, and (d) ZAPE to
ZKE (d) on 27 (D-2), 28 (D-1), 29 (D0), 30 (D+1) and 31 January 2008 (D+2).
Fig. 14. Energy conversions of (a) ZAPE to EAPE, (b) EAPE to EKE, (c) ZKE to EKE, and (d) ZAPE to ZKE (d) on 27 (D-2), 28 (D-1), 29
(D0), 30 (D+1) and 31 January 2008 (D+2).
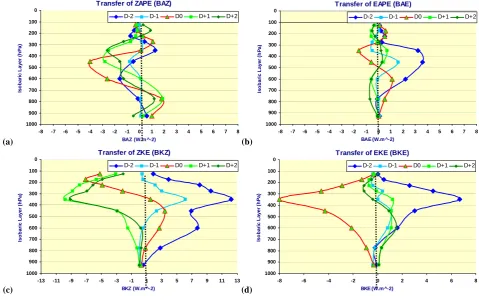
to enter into the system on all of the five days studied but 29 January when a significant loss of EKE from the system was noted (BKE).
More complicated results were found concerning the avail-able potential energy transfers, namely BAZ and BAE. The system exhibited an overall transfer of ZAPE to its surround-ings at the middle levels of the troposphere, but received ZAPE at the lower and upper levels, at all times. The system gained EAPE on the days preceding the trough’s passage; it also gained some amounts at D0, from the lower and middle tropospheric layers. On the contrary, EAPE has been trans-ferred into the system’s environment after the passage and at D0 in the upper troposphere.
4 Concluding remarks
The present work focused on the cold frontal depression that affected the area of Cyprus from 27 to 29 January 2008. In this respect, synoptic, dynamic, energetic and thermody-namic analyses were performed. The depression originated from the north-northwest of the area of Cyprus, but rapidly developed into a frontal depression over the island, with an intense baroclinic character. The associated phenomena were those of a typical cold frontal depression. The jet stream’s
curvature and positioning and the associated upper dynamics were the main contributing factors to the observed intense weather phenomena. The contribution of the Mediterranean Sea was also quite significant, since the lower tropospheric convergence was enhanced by increased vertical heat fluxes through the interaction of the relatively warmer sea and the colder airmass advancing from north.
(a)
Transfer of ZAPE (BAZ) 0 100 200 300 400 500 600 700 800 900 1000
-8 -7 -6 -5 -4 -3 -2 -1 0 1 2 3 4 5 6 7 8
BAZ (W.m ^-2)
Is o b a ri c L a ye r (h P a )
D-2 D-1 D0 D+1 D+2
Transfer of EAPE (BAE) 0 100 200 300 400 500 600 700 800 900 1000
-8 -7 -6 -5 -4 -3 -2 -1 0 1 2 3 4 5 6 7 8
BAE (W.m ^-2)
Is oba ri c La y e r ( h P a )
D-2 D-1 D0 D+1 D+2
(a)
(b)
Transfer of ZKE (BKZ) 0 100 200 300 400 500 600 700 800 900 1000
-13 -11 -9 -7 -5 -3 -1 1 3 5 7 9 11 13
BKZ (W.m ^-2)
Is o b ari c L a yer (h P a )
D-2 D-1 D0 D+1 D+2
Transfer of EKE (BKE) 0 100 200 300 400 500 600 700 800 900 1000
-8 -6 -4 -2 0 2 4 6 8
BKE (W.m ^-2)
Is oba ri c La y e r (h P a )
D-2 D-1 D0 D+1 D+2
(c) (d)
Fig. 15.
Energy transfers of (a) ZAPE, (b) EAPE, (c) ZKE and (d) EKE on 27 (D-2), 28 (D-1), 29 (D0),
30 (D+1) and 31 January 2008 (D+2).
(b)
Transfer of ZAPE (BAZ) 0 100 200 300 400 500 600 700 800 900 1000
-8 -7 -6 -5 -4 -3 -2 -1 0 1 2 3 4 5 6 7 8
BAZ (W.m ^-2)
Is o b a ri c L a ye r (h P a )
D-2 D-1 D0 D+1 D+2
Transfer of EAPE (BAE) 0 100 200 300 400 500 600 700 800 900 1000
-8 -7 -6 -5 -4 -3 -2 -1 0 1 2 3 4 5 6 7 8
BAE (W.m ^-2)
Is oba ri c La y e r ( h P a )
D-2 D-1 D0 D+1 D+2
(a)
(b)
Transfer of ZKE (BKZ) 0 100 200 300 400 500 600 700 800 900 1000
-13 -11 -9 -7 -5 -3 -1 1 3 5 7 9 11 13
BKZ (W.m ^-2)
Is o b ari c L a yer (h P a )
D-2 D-1 D0 D+1 D+2
Transfer of EKE (BKE) 0 100 200 300 400 500 600 700 800 900 1000
-8 -6 -4 -2 0 2 4 6 8
BKE (W.m ^-2)
Is oba ri c La y e r (h P a )
D-2 D-1 D0 D+1 D+2
(c) (d)
Fig. 15. Energy transfers of (a) ZAPE, (b) EAPE, (c) ZKE and (d) EKE on 27 (D-2), 28 (D-1), 29 (D0),
30 (D+1) and 31 January 2008 (D+2).
(c) 0 100 200 300 400 500 600 700 800 900 1000
-8 -7 -6 -5 -4 -3 -2 -1 0 1 2 3 4 5 6 7 8
BAZ (W.m ^-2)
Is o b a ri c L a ye r (h P a )
D-2 D-1 D0 D+1 D+2 100
200 300 400 500 600 700 800 900 1000
-8 -7 -6 -5 -4 -3 -2 -1 0 1 2 3 4 5 6 7 8
BAE (W.m ^-2)
Is oba ri c La y e r ( h P a )
D-2 D-1 D0 D+1 D+2
(a)
(b)
Transfer of ZKE (BKZ) 0 100 200 300 400 500 600 700 800 900 1000
-13 -11 -9 -7 -5 -3 -1 1 3 5 7 9 11 13
BKZ (W.m ^-2)
Is o b ari c L a yer (h P a )
D-2 D-1 D0 D+1 D+2
Transfer of EKE (BKE) 0 100 200 300 400 500 600 700 800 900 1000
-8 -6 -4 -2 0 2 4 6 8
BKE (W.m ^-2)
Is oba ri c La y e r (h P a )
D-2 D-1 D0 D+1 D+2
(c) (d)
Fig. 15. Energy transfers of (a) ZAPE, (b) EAPE, (c) ZKE and (d) EKE on 27 (D-2), 28 (D-1), 29 (D0),
30 (D+1) and 31 January 2008 (D+2).
(d) 0 100 200 300 400 500 600 700 800 900 1000
-8 -7 -6 -5 -4 -3 -2 -1 0 1 2 3 4 5 6 7 8
BAZ (W.m ^-2)
Is o b a ri c L a ye r (h P a )
D-2 D-1 D0 D+1 D+2
0 100 200 300 400 500 600 700 800 900 1000
-8 -7 -6 -5 -4 -3 -2 -1 0 1 2 3 4 5 6 7 8
BAE (W.m ^-2)
Is oba ri c La y e r ( h P a )
D-2 D-1 D0 D+1 D+2
(a)
(b)
Transfer of ZKE (BKZ) 0 100 200 300 400 500 600 700 800 900 1000
-13 -11 -9 -7 -5 -3 -1 1 3 5 7 9 11 13
BKZ (W.m ^-2)
Is o b ari c L a yer (h P a )
D-2 D-1 D0 D+1 D+2
Transfer of EKE (BKE) 0 100 200 300 400 500 600 700 800 900 1000
-8 -6 -4 -2 0 2 4 6 8
BKE (W.m ^-2)
Is oba ri c La y e r (h P a )
D-2 D-1 D0 D+1 D+2
(c) (d)
Fig. 15. Energy transfers of (a) ZAPE, (b) EAPE, (c) ZKE and (d) EKE on 27 (D-2), 28 (D-1), 29 (D0),
30 (D+1) and 31 January 2008 (D+2).
Fig. 15. Energy transfers of (a) ZAPE, (b) EAPE, (c) ZKE and (d) EKE on 27 (D-2), 28 (D-1), 29 (D0), 30 (D+1) and 31 January 2008
(D+2).
with findings by other researchers (e.g., Shay-El and Alpert, 1991; Stein and Alpert, 1993).
Trigo et al. (1999) stated that the major steering mecha-nisms of depressions in the Mediterranean, associated either with large-scale circulation regimes (e.g., low-level baroclin-icity) or local effects (e.g., induced by sea-land contrast or local orography) are much unexplored.
By comparing the tropospheric characteristics in the present study to those analyzed in another study by Nico-laides et al. (2008), many similarities are noted; for example, the spatial and temporal evolution of the low level instability index and that of the divergence field were found to follow similar patterns.
The energetic analysis showed that energy was transferred at the higher tropospheric levels (i.e., jet stream levels) into the system. The energy was found to be gained during the days prior to D0 (i.e., D-2 and D-1) and to be lost to the environment during the following days (i.e., D0, D+1 and D+2).
From the thermodynamic study, the KO index, the BRNsh and the LFC suggested a probability of hailstorms. Taking into account the modified thresholds for the area of Cyprus (Savvidou et al., 2009), the SRH and the TT indices also pointed out the potential for extreme thunderstorm events.
The results of the thermodynamic analysis from the present study were compared to the results from a baroclinic depres-sion analyzed by Nicolaides et al. (2008). Thermodynamic indices, such as TT and BRNsh were found to have higher values (compared to Nicolaides et al., 2008), pointing out the existence of instability, while some of them suggested pre-vailing thunderstorms, tornadic activity and hailstorms over the area of Cyprus.
The utilization of thermodynamic indices is very impor-tant and can shed light on various aspects of the cyclone’s development. In the present study, a number of thermody-namic indices have been explored but other indices can also be considered. For example, Lynn and Yair (2010) have re-cently developed a new Lightning Potential Index (LPI) for evaluating the potential for lightning activity from weather forecast model output data. Such an index can form part of an investigation in future work encompassing lightning ac-tivity over the area.
dynamic factors. The present study confirms the postulation that a combination of thermodynamic and dynamic factors drives the evolution of severe weather phenomena in the area and that for the comprehensiveness of a diagnostic study of such phenomena, the thermodynamic and dynamic structures must be taken into consideration.
Appendix A
Explanation of abbreviations
BAE, Boundary transfer of eddy available potential energy
BAZ, Boundary transfer of zonal available potential energy
BKE, Boundary transfer of eddy kinetic energy
BRN, Bulk Richardson Number
BRNsh, BRN Shear
BKZ, Boundary transfer of zonal kinetic energy CAPE, Convective available potential energy CIN, Convective Inhibition
CTT, Cloud top temperature
D+1, Day +1
D+2, Day +2
D0, Day 0
D-1, Day -1
D-2, Day -2
DCAPE, Downdraft convective available potential energy
EAPE, Eddy available potential energy EKE, Eddy kinetic energy
EL-FZ, Vertical extent of the convective cloud above freezing level
EHI, Energy Helicity Index
K, K index
KO, KO index, KO = 0.5
(2e500−2e700) -0.5 (2e850−2e1000)
where2exis the equivalent potential temperature at X isobaric level LFC, Level of free convection
LI, Lifted Index
LPI, Lightning Potential Index MSLP, Mean sea level pressure
NCAR, National Center for Atmospheric Research NCEP, National Centers for Environmental
Prediction
SRH, Storm relative helicity SWEAT, Severe weather threat
TT, Total totals
VGP, Vorticity Generator Parameter WBZ, Height of the wet-bulb zero ZAPE, Zonal available potential energy ZKE, Zonal kinetic energy
Acknowledgements. This study was undertaken within the
frame-work of project FLASH which is funded by the European Union (Sixth Framework Programme, Contract No. 036852). The authors wish to express their gratitude to two anonymous reviewers and to Yoav Yair of the Open University of Israel, whose comments and suggestions have led to the improvement of this paper.
Edited by: F. Tymvios
Reviewed by: Y. Yair and two other anonymous referees
References
Carlson, T. N.: Mid-latitude weather systems, Harper Collins Aca-demic, London, UK, 507 pp., 1991.
El-Fandy, M. G.: Barometric Lows of Cyprus, Q. J. Roy. Met. Soc., 72, 291–306, 1946.
Jacobeit, J.: Variations of trough position and precipitation patterns in the Mediterranean area, J. Climatol., 7, 453–476, 1987. Jacovides, C. P. and Yonetani, T.: An evaluation of stability indices
for thunderstorm prediction in greater Cyprus, Weather Fore-cast., 5, 559–569, 1990.
Kallos, G. and Metaxas, D. A.: Synoptic processes for the forma-tion of Cyprus lows, Riv. Meteorol. Aeronau., 40(2–3), 121–138, 1980.
Lynn, B. and Yair, Y.: Prediction of lightning flash density with the WRF model, Adv. Geosci., 23, 11–16, 2010,
http://www.adv-geosci.net/23/11/2010/.
Maheras, P., Flocas, H., Patrikas, I., and Anagnostopoulou, C.: A 40 year objective climatology of surface cyclones in the Mediter-ranean region: Spatial and temporal distribution, Int. J. Climatol., 21, 109–130, 2001.
Maheras, P., Flocas, H. A., Anagnostopoulou, C., and Patrikas, I.: On the vertical structure of composite surface cyclones in the Mediterranean region, Theor. Appl. Climatol., 71, 199–217, 2002.
Michaelides, S. C.: Limited area energetics of Genoa cyclogenesis, Mon. Weather Rev., 115, 13–26, 1987.
Michaelides, S. C.: A spatial and temporal energetics analysis of a baroclinic disturbance in the Mediterranean, Mon. Wea. Rev., 120, 1224–1243, 1992.
Michaelides, S., Nicolaides, K., and Karacostas, T.: Statistical char-acteristics of the cold season depressions over the area of Cyprus, Meteorologick´yeasopis 7, 61–66, 2004.`
Michaelides, S. C., Prezerakos, N. G., and Flocas, A. A.: Quasi-Lagrangian energetics of an intense Mediterranean cyclone, Q. J. Roy. Met. Soc., 125, 139–168, 1999.
Michalopoulou, H. and Jacovides, C. P.: Instability indices for the Cyprus area, Meterol. Atmos. Physics, 37, 153–157, 1987. National Weather Service: http://www.crh.noaa.gov/lmk/soo/docu/
indices.php, last access: 14 June 2009.
Nicolaides, K.: Synoptic and dynamic study of the depression cases affected the wider area of Cyprus during cold months, PhD thesis, Aristotelian University, 278 pp., Thessaloniki, Greece, 2005 (in Greek).
Nicolaides, K., Savvidou, K., Orphanou, A., Michaelides, S., Con-stantinides, P., Papachristodoulou, C., and Savvides, M.: An investigation of a baroclinic depression that affected the area of Cyprus, Adv. Geosci., 16, 1–8, 2008,
http://www.adv-geosci.net/16/1/2008/.
Radinovic, D.: Mediterranean cyclones and their influence on the weather and climate, program on short and medium range weather prediction research, PSMP, W.M.O. Sofia, 1987. Savvidou, K., Orphanou, A., Charalambous, D., Lingis, P. and
Michaelides, S.: A statistical analysis of sounding derived in-dices and parameters for extreme and non-extreme thunderstorm events over Cyprus, Adv. Geosci., 23, 79–85, 2010
Shay-El, Y. and Alpert, P.: A diagnostic study of winter diabatic heating in the Mediterranean in relation to cyclones, Q. J. Roy. Meteorol. Soc., 117, 715–747, 1991.
Stein, U. and Alpert, P.: Factor separation in numerical simulations, J. Atmos. Sci., 50, 2107–2115, 1993.
Tafferner, A. and Egger, J.: Test of theories of lee cyclogenesis: ALPEX cases, J. Atmos. Sci., 47, 2417–2428, 1990.
Trigo, I. F., Davies, T. D., and Bigg, G. R.: Objective climatology of cyclones in the Mediterranean region, J. Climate, 12, 1685– 1696, 1999.
Tudur´ı, E. and Ramis, C.: The Environments of Significant Convec-tive Events in the Western Mediterranean, Weather Forecast., 12, 294–306, 1997.
Ziv, B., Saaroni, H., Yair, Y., Ganot, M., Baharad, A., and Isas-chari, D.: Atmospheric factors governing winter thunderstorms in the coastal region of the eastern Mediterranean, Theor. Appl. Climatol., 95, 301–310, 2009.